動的ロング/ショート・スウィング・トレーディング・ストラテジー
作者: リン・ハーンチャオチャン開催日:2024年12月12日11時15分タグ:エイマSMARSIATRTPSL

概要
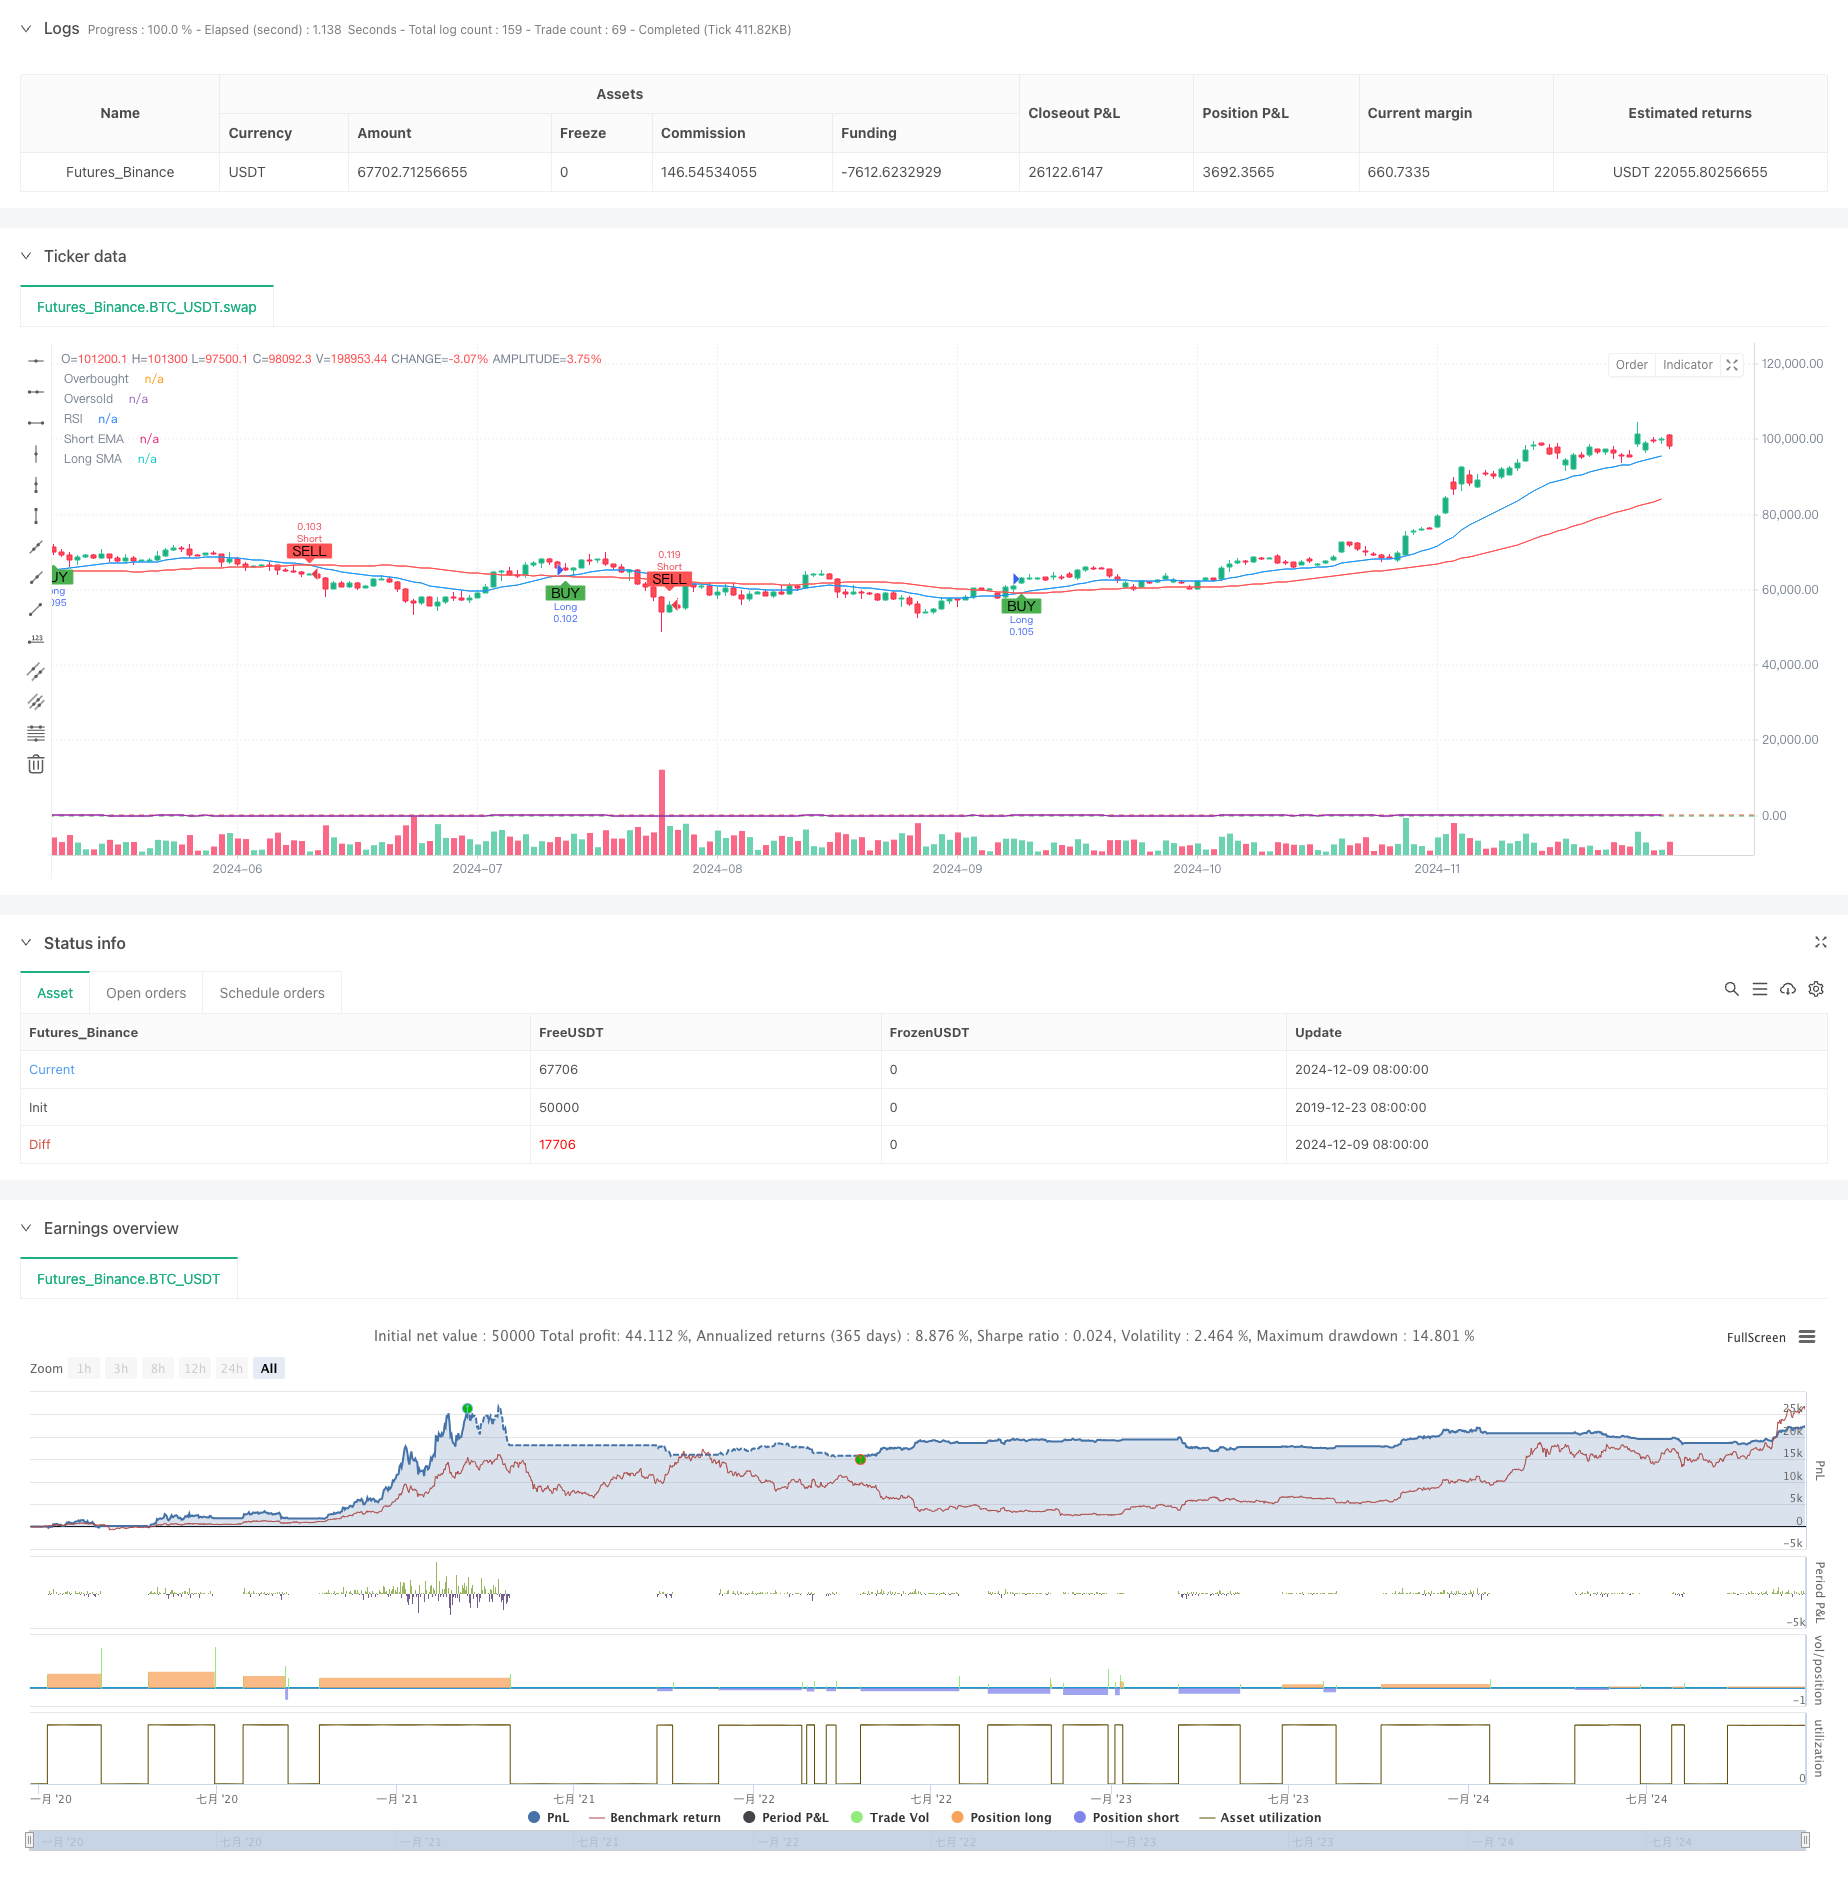
この戦略は,移動平均クロスオーバー,RSIオーバー買い/オーバーセール条件,ATRベースのストップ・ロスト/テイク・プロフィートレベルを含む複数のシグナルを組み合わせた技術指標ベースのスウィング・トレーディングシステムである.コアメカニズムは,ATRを使用して動的ストップ・ロストとテイク・プロフィートレベルを設定し,RSI信号によって確認された短期EMAと長期SMAクロスオーバーを通じて市場のトレンドを把握することを基盤としています.この戦略は,長距離および短距離の取引方向の両方をサポートし,両方向の柔軟な有効化/無効化が可能です.
戦略の原則
戦略は,多層の技術指標アプローチを採用しています.
- トレンド決定層: トレンド指向を決定するために20期EMAと50期SMAクロスオーバーを使用し,SMA上のEMAは長い信号で,下のEMAはショート信号です.
- モメント 確認 層: RSI インディケーターを使用して,RSI 70以下のロングとRSI 30以上のショートを許可します.
- 波動性計算層: 14 期間の ATR を使用してストップ・ロースとテイク・プロフィートのレベルを計算し,ストップ・ロースを 1.5x ATR,テイク・プロフィートを 3x ATR に設定します.
- ポジション管理層: 初期資本と取引リスクパーセント (デフォルトは1%) をベースにポジションサイズを動的に計算する.
戦略 の 利点
- 複数の信号確認:移動平均クロスオーバー,RSI,ATRインジケーターの組み合わせによって誤った信号を減らす.
- ダイナミックストップ・ロス/テイク・プロフィート: ATR ベースのポジション管理を通じて市場の変動に適応する.
- 柔軟な取引方向: 市場状況に基づいて長または短取引を独立して可能とする.
- 厳格なリスク管理: 割合に基づくリスク管理と動的ポジションサイズ化によってリスクの暴露を効果的に制御する.
- ビジュアライゼーションサポート: 信号マーカーとインジケーターディスプレイを含む包括的なチャートビジュアライゼーションを提供します.
戦略リスク
- 横向市場リスク: 移動平均のクロスオーバーは,変動市場において過剰な誤った信号を生む可能性があります.
- スリップリスク: 変動期間中に実際の実行価格がシグナル価格から大幅に偏りることがあります.
- 資本管理リスク:過度のリスクパーセント設定は,単一の取引で大きな損失をもたらす可能性があります.
- パラメータ感度: 戦略のパフォーマンスはパラメータ設定に敏感であり,慎重に最適化する必要があります.
戦略の最適化方向
- トレンド強度フィルターを追加する: ADX インジケーターを実装して,弱いトレンド環境での取引をフィルターする.
- 移動平均期間の最適化: 移動平均のパラメータを市場のサイクル特性に基づいて動的に調整する.
- ストップ・ロスのメカニズムの強化: 利益をより良く保護するために,ストップ・ロスの機能を追加する.
- 音量確認を追加:信号の信頼性を向上させるための追加確認として音量指標を組み込む.
- 市場環境分類: 市場環境認識モジュールを追加し,異なる市場条件で異なるパラメータセットを使用します.
概要
この戦略は,複数の技術指標の組み合わせによって比較的完全な取引システムを構築する.その強みは,信号確認の信頼性と包括的なリスク管理にあります.しかし,戦略のパフォーマンスに対する市場環境の影響は注意が必要です.提案された最適化方向を通じて,改善のための大きな余地があります.ライブ取引に適用する際には,徹底的なパラメータテストとバックテストの検証が推奨されます.
/*backtest
start: 2019-12-23 08:00:00
end: 2024-12-10 08:00:00
period: 1d
basePeriod: 1d
exchanges: [{"eid":"Futures_Binance","currency":"BTC_USDT"}]
*/

// This Pine Script™ code is subject to the terms of the Mozilla Public License 2.0 at https://mozilla.org/MPL/2.0/
// © CryptoRonin84

//@version=5
strategy("Swing Trading Strategy with On/Off Long and Short", overlay=true, default_qty_type=strategy.percent_of_equity, default_qty_value=100)

// Input for turning Long and Short trades ON/OFF
enable_long = input.bool(true, title="Enable Long Trades")
enable_short = input.bool(true, title="Enable Short Trades")

// Input parameters for strategy
sma_short_length = input.int(20, title="Short EMA Length", minval=1)
sma_long_length = input.int(50, title="Long SMA Length", minval=1)
sl_percentage = input.float(1.5, title="Stop Loss (%)", step=0.1, minval=0.1)
tp_percentage = input.float(3, title="Take Profit (%)", step=0.1, minval=0.1)
risk_per_trade = input.float(1, title="Risk Per Trade (%)", step=0.1, minval=0.1)
capital = input.float(10000, title="Initial Capital", step=100)

// Input for date range for backtesting
start_date = input(timestamp("2020-01-01 00:00"), title="Backtest Start Date")
end_date = input(timestamp("2024-12-31 23:59"), title="Backtest End Date")
inDateRange = true

// Moving averages
sma_short = ta.ema(close, sma_short_length)
sma_long = ta.sma(close, sma_long_length)

// RSI setup
rsi = ta.rsi(close, 14)
rsi_overbought = 70
rsi_oversold = 30

// ATR for volatility-based stop-loss calculation
atr = ta.atr(14)
stop_loss_level_long = strategy.position_avg_price - (1.5 * atr)
stop_loss_level_short = strategy.position_avg_price + (1.5 * atr)
take_profit_level_long = strategy.position_avg_price + (3 * atr)
take_profit_level_short = strategy.position_avg_price - (3 * atr)

// Position sizing based on risk per trade
risk_amount = capital * (risk_per_trade / 100)
position_size = risk_amount / (close * sl_percentage / 100)

// Long and Short conditions
long_condition = ta.crossover(sma_short, sma_long) and rsi < rsi_overbought
short_condition = ta.crossunder(sma_short, sma_long) and rsi > rsi_oversold

// Execute long trades
if (long_condition and inDateRange and enable_long)
    strategy.entry("Long", strategy.long, qty=position_size)
    strategy.exit("Take Profit/Stop Loss", "Long", stop=stop_loss_level_long, limit=take_profit_level_long)

// Execute short trades
if (short_condition and inDateRange and enable_short)
    strategy.entry("Short", strategy.short, qty=position_size)
    strategy.exit("Take Profit/Stop Loss", "Short", stop=stop_loss_level_short, limit=take_profit_level_short)

// Plot moving averages
plot(sma_short, title="Short EMA", color=color.blue)
plot(sma_long, title="Long SMA", color=color.red)

// Plot RSI on separate chart
hline(rsi_overbought, "Overbought", color=color.red)
hline(rsi_oversold, "Oversold", color=color.green)
plot(rsi, title="RSI", color=color.purple)

// Plot signals on chart
plotshape(series=long_condition and enable_long, title="Long Signal", location=location.belowbar, color=color.green, style=shape.labelup, text="BUY")
plotshape(series=short_condition and enable_short, title="Short Signal", location=location.abovebar, color=color.red, style=shape.labeldown, text="SELL")

// Background color for backtest range
bgcolor(inDateRange ? na : color.red, transp=90)
関連性
- 量に基づくダイナミックDCA戦略
- ダイナミックATRストップ・ロスのRSI 過売度リバウンド量的な戦略
- 多指標ダイナミック取引戦略
- アダプティブ・ムービング・平均クロスオーバーとストップ・ロスのストラテジー
- RSIモメンタムとATR波動性に基づくトレンドを伴う多期EMAクロスオーバー
- 高勝率トレンドは逆転トレード戦略を意味する
- 多技術指標に基づく高周波ダイナミック最適化戦略
- ATRとMACD統合付きの多期トレンドフォロー・トレード・システム
- MACD-ATRの実装による強化された平均逆転戦略
- 多レベル多期EMAクロスオーバー ダイナミック・テイク・プロフィート最適化戦略
もっと
- モメントとボリュームの確認を持つマルチ移動平均取引システム
- アダプティブ トレイリング・ドラウド バランスのとれた取引戦略
- 強化されたトレンドフォローシステム:ADXとパラボリックSARに基づく動的トレンド識別
- 2つのタイムフレームストーカスティックモメンタム取引戦略
- アダプティブ・ボリンガー・バンド ダイナミック・ポジション・マネジメント・戦略
- ダイナミック RSI スマートタイム スウィング トレーディング 戦略
- 2方向取引戦略 キャンドルスティック吸収パターン分析に基づく
- Bollinger Breakout with Mean Reversion 4H 定量取引戦略
- ダイナミックグリッド位置サイズ戦略の傾向
- 双重BBI (bulls and bears index) クロスオーバー戦略
- 取引戦略をフォローするマルチテクニカル指標傾向
- 先進的な波動性平均逆転取引戦略:VIXと移動平均値に基づく多次元量的な取引システム
- 金のトレンドチャネル逆転のモメンタム戦略
- 先進的なEMAモメンタムトレンド取引戦略
- マルチMAトレンド・インテニシティ・トレーディング・戦略 - MA偏差に基づく柔軟なスマート・トレーディング・システム
- ボリューム重量化二重傾向検出システム
- 多要素対トレンド取引戦略
- 強化されたモメントオシレーターとストカスティックディバージェンスの定量取引戦略
- トレンドブレイク・トレード戦略によるマルチタイムフレームフィボナッチ・リトラセメント
- 多指標の傾向 利益の最適化による戦略