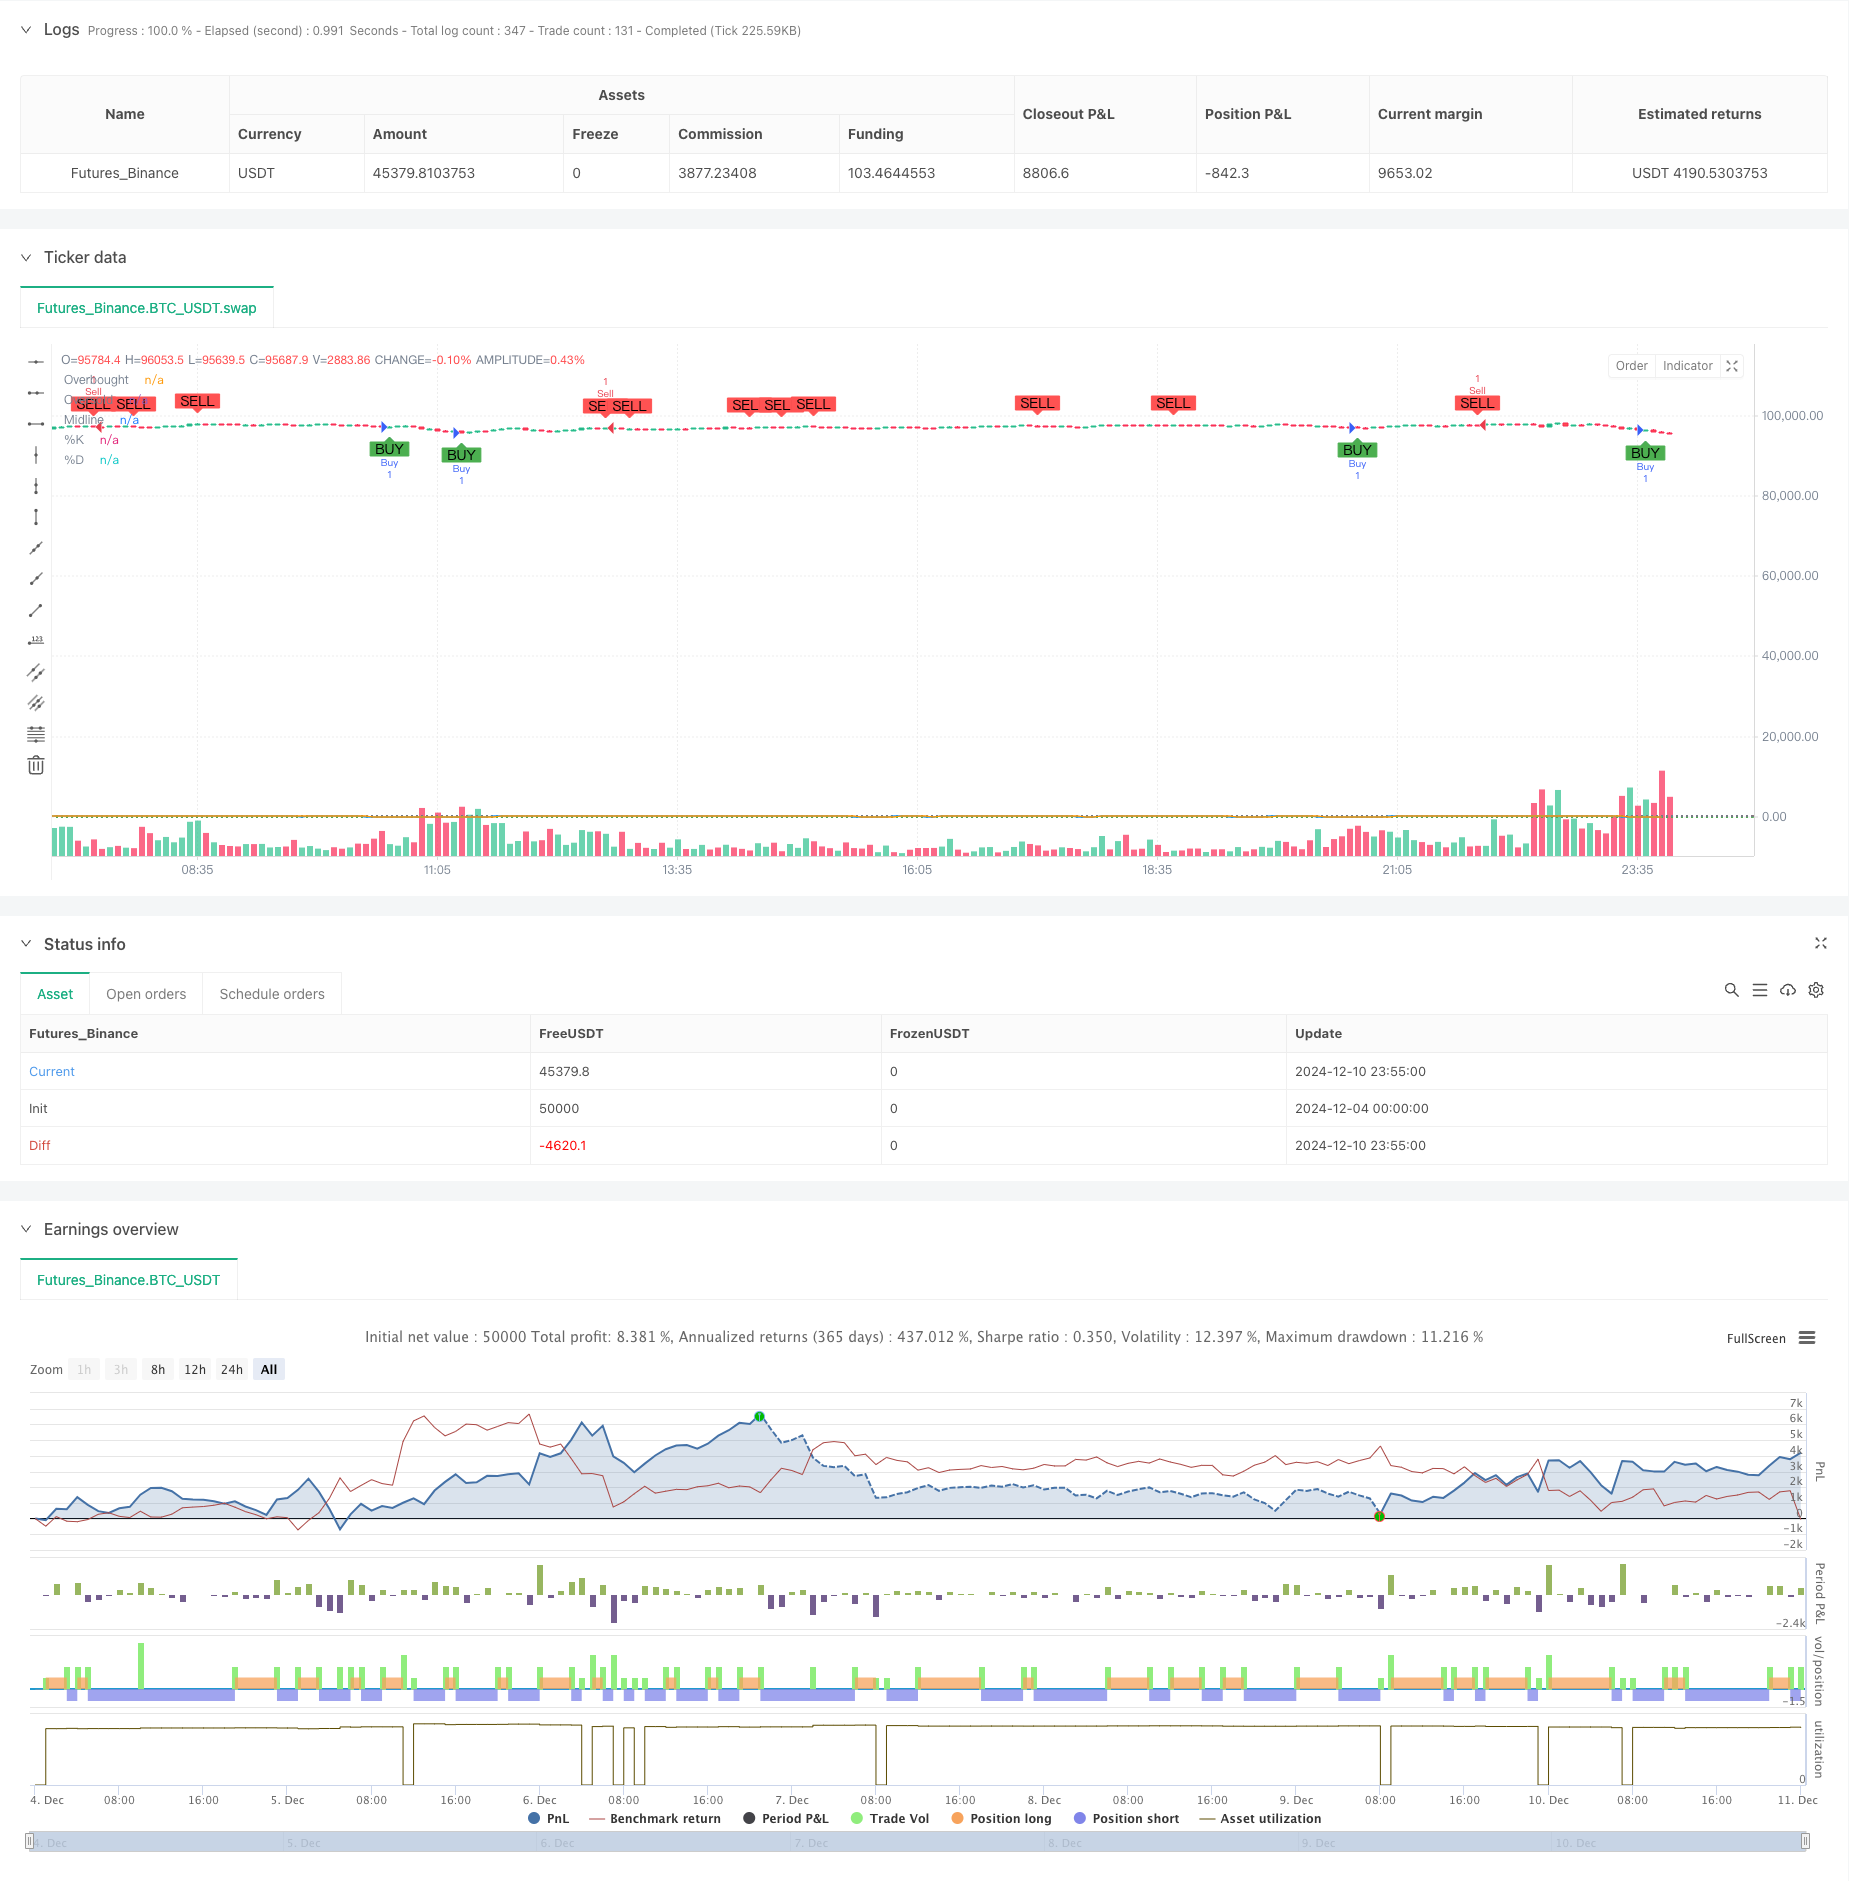
2つのタイムフレームストーカスティックモメンタム取引戦略
作者: リン・ハーンチャオチャン開催日:2024年12月12日 14:19:54タグ:RSIマルチTPSL

概要
この戦略は,ストコスタスティック指標に基づいた二次タイムフレームモメントトレーディングシステムである.異なるタイムフレームでストコスタスティッククロスオーバー信号を分析し,モメント原理とトレンドフォロー方法を組み合わせ,より正確な市場傾向判断と取引タイミングを図る.戦略には,よりよいマネーマネジメントのために,利益とストップ・ロスの設定を含むリスク管理メカニズムも組み込まれている.
戦略の原則
基本的な論理は次の主要な要素に基づいています 1. ストカスティック指標を2つのタイムフレームで使用する:全体的なトレンド確認のための長いタイムフレーム,特定のトレード信号生成のための短いタイムフレーム. 2. 貿易信号生成規則: - 長期信号: 短期の%Kが過売り率 (20%以下) の%Dを超えると,より長い時間枠が上昇傾向を示します. - 短期間シグナル:短期間シグナル %Kが過買い領域 (80以上) から %Dを下回る一方,長期間シグナルは下落傾向を示します. 3. ストカスタス指標のベース期として14期を設定し,スムージングファクターとして3期を設定します. 4. シグナル信頼性を高めるためにキャンドルスタイクパターン確認メカニズムを統合します.
戦略 の 利点
- 多重確認メカニズム: 双重タイムフレーム分析によりより信頼性の高い信号を提供します.
- トレンドフォロー能力: 市場のトレンドターニングポイントを効果的に把握する.
- 高い柔軟性:パラメータは異なる市場条件に調整できます.
- 総合的なリスク管理: 利益とストップ・ロスのメカニズムを統合する
- 明確なシグナル:取引シグナルは明示的で実行が簡単です.
- 適応性が高い:複数の時間枠の組み合わせに適用できる.
戦略リスク
- 誤ったブレイクリスク: 変動する市場で誤った信号を生む可能性があります.
- 遅延リスク: 移動平均の平滑因子により,信号が遅延する可能性があります.
- パラメータの敏感性:異なるパラメータ設定は戦略のパフォーマンスに大きく影響する.
- 市場環境による依存: 傾向のある市場では業績が良くなっているが,変動する市場では業績が低下する可能性がある.
戦略の最適化方向
- 変動指標を導入する:動的ストップ損失調整のためのATR指標を追加する.
- シグナルフィルタリングを最適化 音量確認メカニズムを追加
- ADX のようなトレンド強度指標を組み込む.
- リスク管理の改善:動的ポジションサイズメカニズムを実施する.
- パラメータの調整を最適化する: 市場状況に基づいてパラメータを動的に調整する.
概要
ストーカスティック・インディケーター・アナリスト・アナリスト (STOC) の分析により市場機会を把握する,明確な論理を持つ構造化された取引戦略である.この戦略の強みは複数の確認メカニズムと包括的なリスク管理にあるが,偽のブレイクアウトやパラメータ敏感性などのリスクに注意を払う必要がある.継続的な最適化と改善を通じて,戦略はより良い取引結果を達成する可能性がある.
/*backtest
start: 2024-12-04 00:00:00
end: 2024-12-11 00:00:00
period: 5m
basePeriod: 5m
exchanges: [{"eid":"Futures_Binance","currency":"BTC_USDT"}]
*/

//@version=5
strategy("Enhanced Stochastic Strategy", overlay=true)

// Input untuk Stochastic
length = input.int(14, title="Length", minval=1)
OverBought = input(80, title="Overbought Level")
OverSold = input(20, title="Oversold Level")
smoothK = input.int(3, title="Smooth %K")
smoothD = input.int(3, title="Smooth %D")

// Input untuk Manajemen Risiko
tpPerc = input.float(2.0, title="Take Profit (%)", step=0.1)
slPerc = input.float(1.0, title="Stop Loss (%)", step=0.1)

// Hitung Stochastic
k = ta.sma(ta.stoch(close, high, low, length), smoothK)
d = ta.sma(k, smoothD)

// Logika Sinyal
co = ta.crossover(k, d)  // %K memotong %D ke atas
cu = ta.crossunder(k, d) // %K memotong %D ke bawah

longCondition = co and k < OverSold
shortCondition = cu and k > OverBought

// Harga untuk TP dan SL
var float longTP = na
var float longSL = na
var float shortTP = na
var float shortSL = na

if (longCondition)
    longTP := close * (1 + tpPerc / 100)
    longSL := close * (1 - slPerc / 100)
    strategy.entry("Buy", strategy.long, comment="StochLE")
    strategy.exit("Sell Exit", "Buy", limit=longTP, stop=longSL)

if (shortCondition)
    shortTP := close * (1 - tpPerc / 100)
    shortSL := close * (1 + slPerc / 100)
    strategy.entry("Sell", strategy.short, comment="StochSE")
    strategy.exit("Buy Exit", "Sell", limit=shortTP, stop=shortSL)

// Plot Stochastic dan Level
hline(OverBought, "Overbought", color=color.red, linestyle=hline.style_dotted)
hline(OverSold, "Oversold", color=color.green, linestyle=hline.style_dotted)
hline(50, "Midline", color=color.gray, linestyle=hline.style_dotted)

plot(k, color=color.blue, title="%K")
plot(d, color=color.orange, title="%D")

// Tambahkan sinyal visual
plotshape(longCondition, title="Buy Signal", location=location.belowbar, style=shape.labelup, color=color.new(color.green, 0), text="BUY")
plotshape(shortCondition, title="Sell Signal", location=location.abovebar, style=shape.labeldown, color=color.new(color.red, 0), text="SELL")
関連性
- 双動平均-RSI シネージオプション 定量取引戦略
- 金融資産 MFI ベースオーバーセールゾーン エグジットとシグナル平均化システム
- RSI トレンド・モメント・トラッキング・ストラテジーによる移動平均のクロスオーバー
- RSIと移動平均の組み合わせた定量取引戦略の傾向
- トレンドフィルターと例外出口のスムーズな移動平均ストップ・ロスト&テイク・プロフィート戦略
- 動的動向を追求する戦略 - 多指標統合動力分析システム
- 双 EMA ストカスティック オシレーター システム: トレンドフォローとモメンタムを組み合わせた定量的な取引モデル
- 多次元ゴールド金曜日の異常戦略分析システム
- Gチャンネルトレンド検出戦略
- ダイナミックRSI-価格差異検出と適応型取引戦略システム
もっと
- モメントフィルター統合システムで強化されたボリンジャーブレイク量的な戦略
- マルチEMAクロスオーバーモメントトレンド 戦略をフォローする
- 多ターゲットのインテリジェント・ボリューム・モメント・トレード・戦略
- 多期ボリンガー帯 触動トレンド逆転 定量取引戦略
- 高周波ブレイク取引戦略
- 先進的なダイナミックフィボナッチリトレースメント トレンド 定量的な取引戦略
- 動的指数 動的平均 多階層利益傾向 戦略に従った
- モメントとボリュームの確認を持つマルチ移動平均取引システム
- アダプティブ トレイリング・ドラウド バランスのとれた取引戦略
- 強化されたトレンドフォローシステム:ADXとパラボリックSARに基づく動的トレンド識別
- アダプティブ・ボリンガー・バンド ダイナミック・ポジション・マネジメント・戦略
- ダイナミック RSI スマートタイム スウィング トレーディング 戦略
- 2方向取引戦略 キャンドルスティック吸収パターン分析に基づく
- Bollinger Breakout with Mean Reversion 4H 定量取引戦略
- ダイナミックグリッド位置サイズ戦略の傾向
- 双重BBI (bulls and bears index) クロスオーバー戦略
- 動的ロング/ショート・スウィング・トレーディング・ストラテジー
- 取引戦略をフォローするマルチテクニカル指標傾向
- 先進的な波動性平均逆転取引戦略:VIXと移動平均値に基づく多次元量的な取引システム
- 金のトレンドチャネル逆転のモメンタム戦略