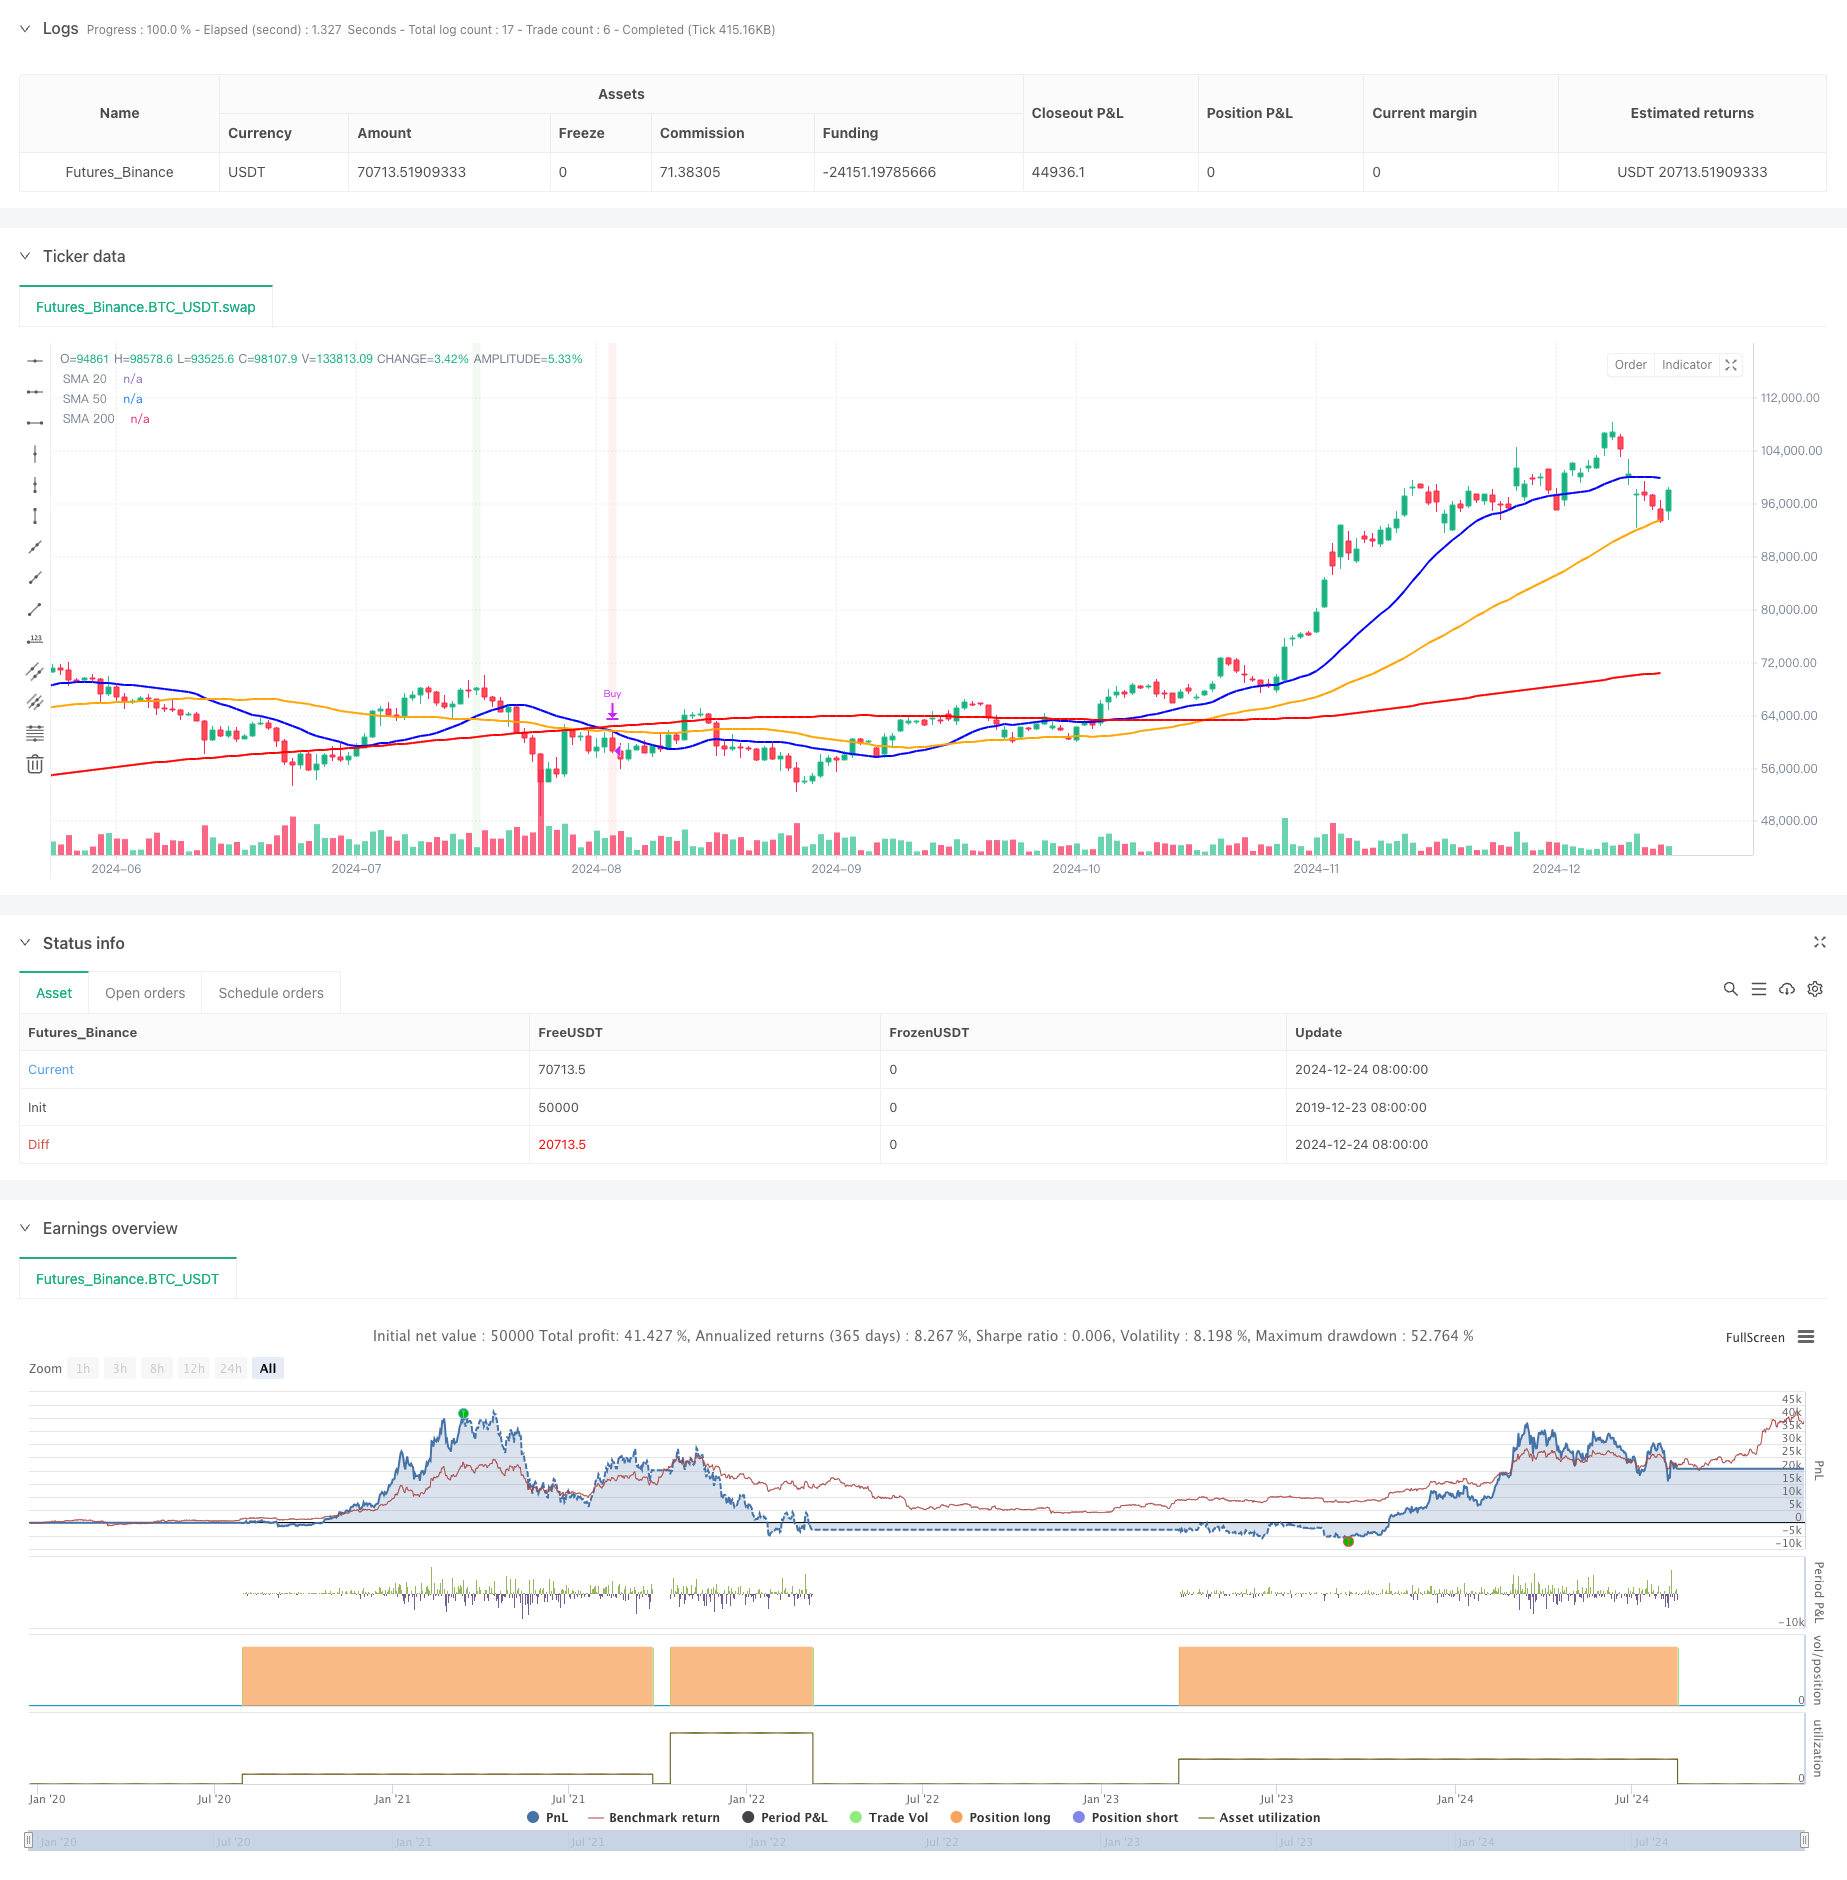
複数の移動平均クロスオーバー・シグナル 強化取引戦略
作者: リン・ハーンチャオチャン開催日:2024年12月27日15時34分02秒タグ:SMAマルチ

概要
この戦略は,複数のシンプル・ムービング・アベア (SMA) クロスオーバー・シグナルに基づいた定量的な取引システムである. 異なる期間 (20日,50日,200日) を有する3つのSMAを使用して,移動平均クロスオーバーと価格ポジション関係を捕捉することによって市場傾向の変化と潜在的な取引機会を特定する. 戦略は,長期移動平均をトレンドフィルターとして使用しながら,短期および中期移動平均クロスオーバーの両方を考慮する.
戦略の原則
基本論理は次の主要な要素に基づいています
- 短期トレンド指標として20日間のSMA,中期トレンド指標として50日間のSMA,長期トレンド指標として200日間のSMAを使用する.
- メインエントリー・シグナル: 20 日SMAが50 日SMAを超え,価格が200 日SMAを超えると,システムはロング・シグナルを生成する.
- メイン出口信号: 20 日SMAが50 日SMAを下回り,価格が200 日SMAを下回ると,システムは閉じる信号を生成します.
- 副信号: 補完指標として50日間と200日間のSMAのクロスオーバーを監視する
- マーカーや背景色の変化を通して取引信号を表示します
戦略 の 利点
- 複数のタイムフレーム分析: 総合的なトレンド分析のために,異なる期間の移動平均を統合します.
- トレンドフィルタリング: 200日間のSMAをトレンドフィルタとして使用し,誤ったブレイクリスクを効果的に軽減する
- シグナル階層: 市場をよりよく知るために,主要信号と次要信号を区別する
- 強化された可視化: 戦略の可読性を改善するためにマーカーと背景色を使用
- 柔軟なパラメータ: 異なる取引ニーズに適応するために移動平均期,色,ライン幅のカスタマイズを可能にします
戦略リスク
- 横向市場リスク: konsolidiation 期間に頻繁に誤った信号を生む可能性があります
- 遅延リスク: 移動平均値は本質的に遅延指標であり,重要な転換点を見逃す可能性があります.
- パラメータ依存性: 適正なパラメータは,異なる市場環境で大きく異なる可能性があります.
- トレンド依存性: トレンド市場では戦略がうまく機能するが,変動市場では劣る
- シグナル衝突:複数の移動平均値が矛盾する信号を生む可能性があります.
戦略の最適化方向
- 動的ポジションサイズ付けのために,ATRまたは他の動態指標を追加することを検討する.
- 音量確認を追加: 信号信頼性を向上させるために音量分析を統合
- 脱出メカニズムの最適化:より柔軟なストップ・ロストと収益戦略の設計
- 市場環境フィルタリングを追加: 異なる市場条件で異なるパラメータを使用するための市場状態認識モジュールを開発
- 適応パラメータを実装する: 市場の特徴に基づいて移動平均期を動的に調整する
概要
この戦略は,明確な論理を備えた構造化された移動平均取引戦略である.価格位置関係と組み合わせた異なる期間の移動平均を包括的に利用することで,戦略は市場の傾向の変化を効果的に把握する.遅延や横向市場脆弱性などの固有のリスクがあるものの,戦略は合理的なパラメータ設定と信号フィルタリングを通じて実用的な価値を維持する.将来の改善は,戦略の安定性と信頼性を高めるために追加の技術指標を組み込み,信号生成メカニズムを最適化することに焦点を当てることができる.
/*backtest
start: 2019-12-23 08:00:00
end: 2024-12-25 08:00:00
period: 1d
basePeriod: 1d
exchanges: [{"eid":"Futures_Binance","currency":"BTC_USDT"}]
*/

//@version=5
strategy("SMA 20/50/200 Strateji", overlay=true)

// SMA Periyotlarını, renklerini ve çizgi kalınlıklarını özelleştirme
sma20_period = input.int(20, title="SMA 20 Periyodu", minval=1)
sma50_period = input.int(50, title="SMA 50 Periyodu", minval=1)
sma200_period = input.int(200, title="SMA 200 Periyodu", minval=1)

sma20_color = input.color(color.blue, title="SMA 20 Rengi")
sma50_color = input.color(color.orange, title="SMA 50 Rengi")
sma200_color = input.color(color.red, title="SMA 200 Rengi")

sma20_width = input.int(2, title="SMA 20 Kalınlığı", minval=1, maxval=5)
sma50_width = input.int(2, title="SMA 50 Kalınlığı", minval=1, maxval=5)
sma200_width = input.int(2, title="SMA 200 Kalınlığı", minval=1, maxval=5)

// SMA Hesaplamaları
sma20 = ta.sma(close, sma20_period)
sma50 = ta.sma(close, sma50_period)
sma200 = ta.sma(close, sma200_period)

// Al ve Sat Koşulları
buyCondition = ta.crossover(sma20, sma50) and close > sma200
sellCondition = ta.crossunder(sma20, sma50) and close < sma200

buyCondition_50_200 = ta.crossover(sma50, sma200)
sellCondition_50_200 = ta.crossunder(sma50, sma200)

// Grafik üzerine SMA çizimleri
plot(sma20, color=sma20_color, linewidth=sma20_width, title="SMA 20")
plot(sma50, color=sma50_color, linewidth=sma50_width, title="SMA 50")
plot(sma200, color=sma200_color, linewidth=sma200_width, title="SMA 200")

// Al-Sat Stratejisi
if buyCondition
    strategy.entry("Buy", strategy.long)
    label.new(bar_index, low, "BUY", style=label.style_label_up, color=color.new(color.green, 0), textcolor=color.white)

if sellCondition
    strategy.close("Buy")
    label.new(bar_index, high, "SELL", style=label.style_label_down, color=color.new(color.red, 0), textcolor=color.white)

if buyCondition_50_200
    label.new(bar_index, low, "50/200 BUY", style=label.style_label_up, color=color.new(color.blue, 0), textcolor=color.white)

if sellCondition_50_200
    label.new(bar_index, high, "50/200 SELL", style=label.style_label_down, color=color.new(color.orange, 0), textcolor=color.white)

// Performans Görselleştirmesi İçin Arka Plan Rengi
bgColor = buyCondition ? color.new(color.green, 90) : sellCondition ? color.new(color.red, 90) : na
bgcolor(bgColor)
関連性
- MA,SMA,MA傾斜,ストップ損失を後押しし,再入力
- 動向平均のクロスオーバー戦略は,二重動向平均に基づいている
- 移動平均のクロスオーバー戦略
- ダイナミックポジション・ダブル・ムービング・メアワー・クロスオーバー戦略
- SMAの二重移動平均取引戦略
- 2つの移動平均交差調整パラメータ取引戦略
- 2つの移動平均モメンタム取引戦略: 時間最適化されたトレンドフォローシステム
- トレンドキャッチャー戦略
- 複数の移動平均トレンド取引戦略
- ストーカスティック・オシレーターとストップ・ロストとストーカスティック・フィルター付きの移動平均クロスオーバー戦略
- MAのクロス戦略
もっと
- 多技術指標に基づく高周波ダイナミック最適化戦略
- トリプル・スーパートレンドと指数関数移動平均トレンド
- クラウドベースのボリンガー帯 双動平均量的な傾向戦略
- Bollinger Bands Trend Divergence に基づいた多レベル量的な取引戦略
- フィボナッチ0.7レベルトレンドブレークスルーに基づく定量的な取引戦略
- 多期フラクタルブレイクオーダーブロック 適応型取引戦略
- 移動平均のクロスオーバーに基づくリスク/報酬比最適化戦略
- ダイナミック・トレンドの認識のトレーディング戦略をフォローする適応傾向
- 境界を越えた動的範囲量的な取引戦略 ボリンジャー帯に基づく
- モメントベースのSMIクロスオーバー信号適応予測戦略
- Bollinger Bands と Woodies CCI を使った多指標フィルタリング取引戦略
- 動的移動平均傾向をRSI確認取引戦略でフォローする
- プルバック最適化システムを持つ多期指数移動平均のダイナミッククロス戦略
- ダイナミック・ムービング・メアージャー・クロスオーバー・トレンド 適応型リスク管理による戦略
- ストカスティックRSIをベースにした適応型取引戦略
- 動的ポジションスケーリングシステムを持つ多レベル機関オーダーフロー量的な戦略
- マルチEMA動的トレンドキャプチャ量的な取引戦略
- 固定ストップ・ロスの最適化モデルによる動的移動平均値とボリンジャー・バンドのクロス戦略
- RSIトレンド逆転取引戦略 ATRストップ損失と取引エリア制御
- オシレーターとダイナミックサポート/レジスタンスの取引戦略を持つマルチEMAクロス