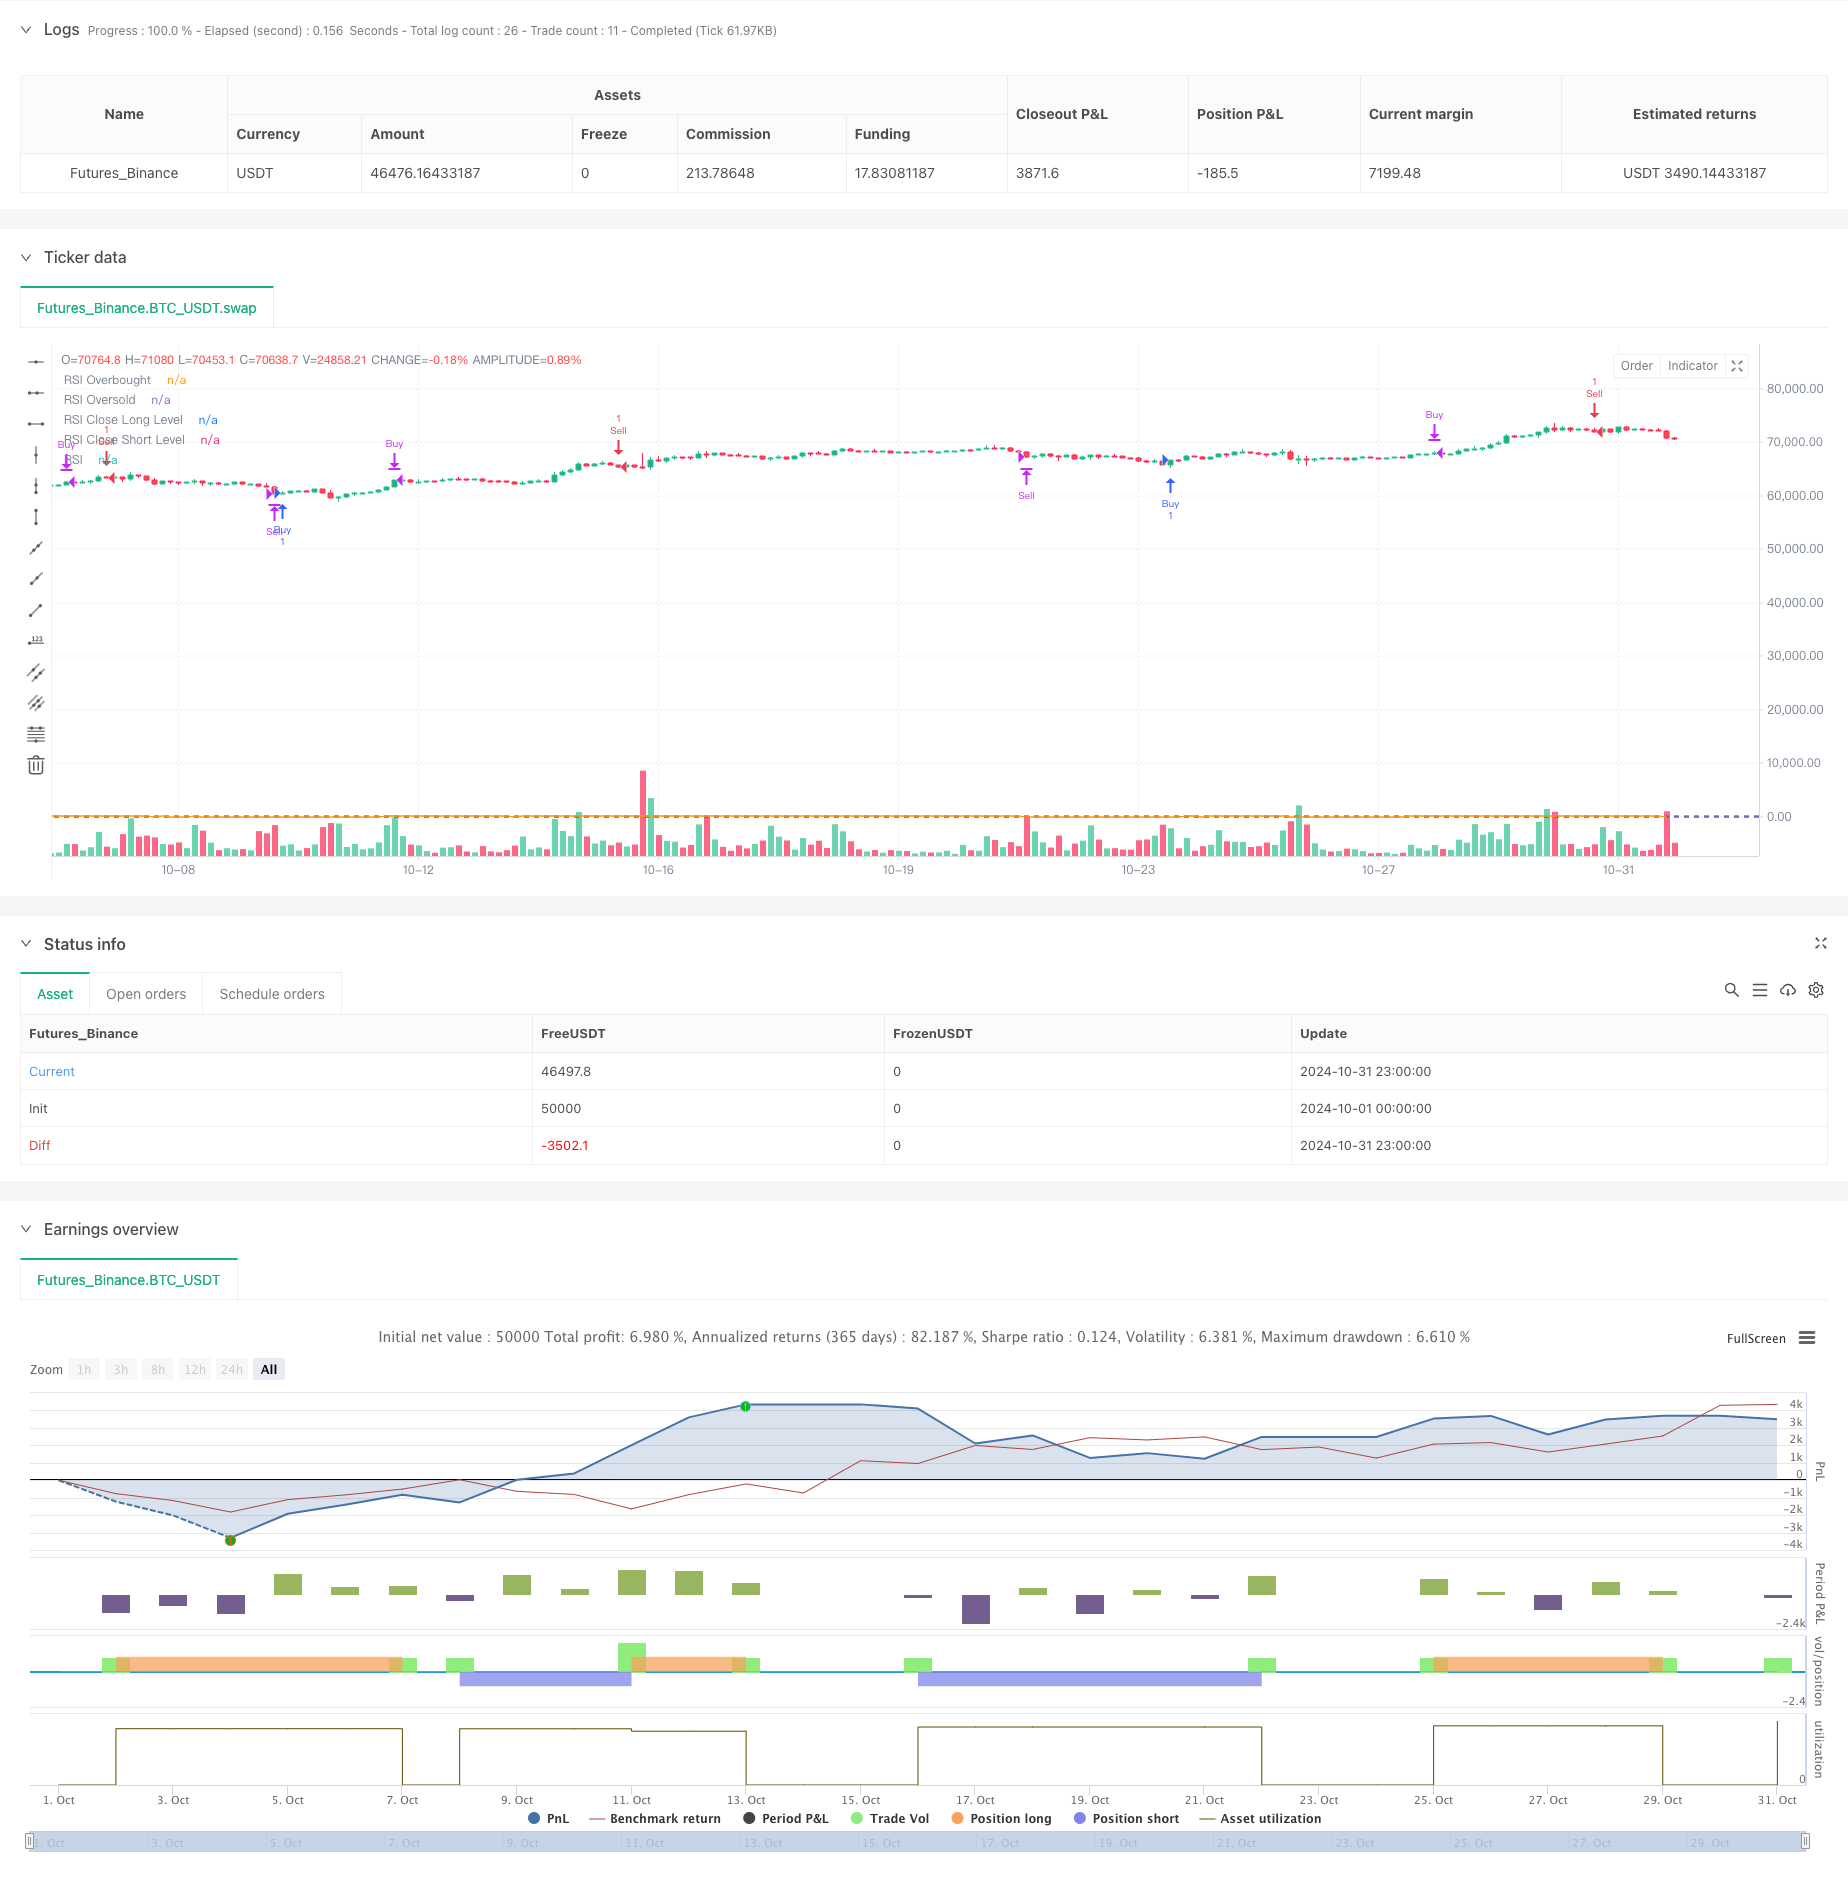
RSI 동적 출구 레벨 모멘텀 거래 전략
저자:차오장, 날짜: 2024-11-28 14:59:20태그:RSI

전반적인 설명
이 전략은 상대적 강도 지수 (RSI) 를 기반으로 한 동적 출구 시스템으로, 동적 출입 및 출구 조건을 통해 시장 트렌드를 포착합니다. 이 전략은 RSI가 과소매와 과소매 수준을 넘어서면 거래 신호를 생성하며, 거래 성과를 최적화하기 위해 다른 RSI 수준에서 출구 조건을 설정하여 독특한 동적 출구 메커니즘을 통합합니다. 이 전략은 시장 방향 모두에서 기회를 포착 할 수있는 완전한 장기 단위 거래 시스템을 사용합니다.
전략 원칙
핵심 논리는 몇 가지 핵심 요소를 포함합니다.
- 신호 생성: 주요 거래 신호로 RSI 과잉 구매/ 과잉 판매 수준 (70/30) 을 사용합니다. RSI가 30을 넘을 때 구매 신호가 생성되며, RSI가 70을 넘을 때 판매 신호가 생성됩니다.
- 포지션 관리: 단일 포지션 원칙을 구현하여 위험 노출을 효과적으로 제어하기 위해 언제든지 하나의 방향 포지션을 보장합니다.
- 동적 출구 메커니즘: 시장 트렌드 특성에 더 잘 적응하는 이 비대칭 설계로 차별화된 RSI 출구 수준을 설정합니다.
- 시각화 모듈: 직관적인 시장 상태 이해를 위해 차트에서 RSI 라인, 과잉 구매 / 과잉 판매 수준 및 출구 수준을 그래프.
전략적 장점
- 체계적인 거래: 완전히 체계적인 접근은 주관적 판단의 감정적 간섭을 제거합니다.
- 리스크 관리: 단일 포지션 원칙과 동적 출구 메커니즘을 통해 효과적인 리스크 관리.
- 높은 적응력: RSI 매개 변수와 출구 레벨은 다른 시장 특성에 맞게 조정할 수 있습니다.
- 양자 무역: 상승하고 감소하는 시장에서 기회를 잡습니다.
- 시각 지원: 직관적인 차트 디스플레이는 시장 조건과 전략 논리를 이해하는 데 도움이 됩니다.
전략 위험
시장 위험: 옆 시장에서 빈번한 거래를 생성하여 거래 비용을 증가시킬 수 있습니다. - 트렌드 지속 위험: 초기 종료는 더 큰 트렌드 기회를 놓칠 수 있습니다.
- 매개 변수 민감성: 전략 성능은 RSI 매개 변수와 출구 레벨 설정에 민감합니다.
- 미끄러짐 영향: 변동적인 시장 조건에서 상당한 미끄러짐 위험을 감수할 수 있습니다.
최적화 방향
- 트렌드 필터를 도입합니다. 잘못된 신호를 필터링하기 위해 이동 평균과 같은 트렌드 지표를 추가합니다.
- 동적 매개 변수 최적화: 시장 변동성에 따라 RSI 매개 변수 및 출구 수준을 자동으로 조정합니다.
- 강화된 포지션 관리: 시장 위험 수준에 따라 포지션 크기를 조정하기 위해 화폐 관리 모듈을 통합합니다.
- 출구 메커니즘을 최적화: 더 나은 이익 보호를 위해 후속 정지 기능을 추가하는 것을 고려하십시오.
요약
이것은 RSI 지표와 동적인 출구 메커니즘을 통해 시장 기회를 포착하는 잘 설계된 모멘텀 거래 전략입니다. 전략의 주요 특징은 높은 체계적인 성격, 강력한 위험 통제 및 강력한 적응력입니다. 내재적인 위험이 존재하지만 매개 변수 최적화 및 기능 확장으로 개선할 수있는 상당한 여지가 있습니다. 견고한 거래 시스템을 찾는 투자자에게는 고려해야 할 가치가있는 전략 프레임워크를 나타냅니다.
/*backtest
start: 2024-10-01 00:00:00
end: 2024-10-31 23:59:59
period: 3h
basePeriod: 3h
exchanges: [{"eid":"Futures_Binance","currency":"BTC_USDT"}]
*/

//@version=5
strategy("RSI Strategy with Close Levels", shorttitle="RSI Strat", overlay=true)

// RSI Input settings
rsiLength = input.int(14, title="RSI Length")
rsiOverbought = input.int(70, title="RSI Overbought Level")
rsiOversold = input.int(30, title="RSI Oversold Level")
rsiCloseLongLevel = input.int(60, title="RSI Level to Close Long Position")
rsiCloseShortLevel = input.int(40, title="RSI Level to Close Short Position")

// Calculate RSI
rsi = ta.rsi(close, rsiLength)

// Generate buy and sell signals based on RSI levels
buySignal = ta.crossover(rsi, rsiOversold)
sellSignal = ta.crossunder(rsi, rsiOverbought)

// Check if there are open positions
var bool inPosition = na
if (strategy.opentrades > 0)
    inPosition := true
else
    inPosition := false

// Open long position on buy signal if not already in a position
if (buySignal and not inPosition)
    strategy.entry("Buy", strategy.long)
    inPosition := true

// Close long position on sell signal or when RSI reaches the close long level
if (inPosition and strategy.position_size > 0 and (sellSignal or rsi >= rsiCloseLongLevel))
    strategy.close("Buy")
    inPosition := false

// Open short position on sell signal if not already in a position
if (sellSignal and not inPosition)
    strategy.entry("Sell", strategy.short)
    inPosition := true

// Close short position on buy signal or when RSI reaches the close short level
if (inPosition and strategy.position_size < 0 and (buySignal or rsi <= rsiCloseShortLevel))
    strategy.close("Sell")
    inPosition := false

// Plot buy and sell signals
//plotshape(series=buySignal, title="Buy Signal", location=location.belowbar, color=color.green, style=shape.labelup, text="BUY")
//plotshape(series=sellSignal, title="Sell Signal", location=location.abovebar, color=color.red, style=shape.labeldown, text="SELL")

// Plot RSI for visualization
hline(rsiOverbought, "RSI Overbought", color=color.red)
hline(rsiOversold, "RSI Oversold", color=color.green)
hline(rsiCloseLongLevel, "RSI Close Long Level", color=color.blue)
hline(rsiCloseShortLevel, "RSI Close Short Level", color=color.purple)
plot(rsi, title="RSI", color=color.orange)
관련
- 보린저 밴드 및 RSI 통합을 통해 향상된 평균 역전 전략
- 수량적 거래 전략의 지원/저항과 함께 다기간의 RSI 격차
- 동적 마취 제어 시스템과 동적 추세에 따른 전략
- 멀티테크니컬 인디케이터 크로스 트렌드 추적 전략: RSI와 스토카스틱 RSI 시너지 거래 시스템
- MACD-RSI 크로스오버 트렌드
- 다중 지표 동적 거래 최적화 전략
- 다중 지표 동적 스톱 로스 동력 트렌드 거래 전략
- 멀티 필터 트렌드 돌파구 스마트 이동 평균 거래 전략
- G 채널 지표와 동적 트렌드 모멘텀 최적화 전략
- 다중 지표 추세 옵션 거래 EMA 크로스 전략
- 다중 지표 변동성 거래 RSI-EMA-ATR 전략
더 많은
- 여러 기간 이동 평균 및 RSI 모멘텀 크로스 전략
- 이중 이동 평균 MACD 크로스오버 날짜 조정 가능한 양적 거래 전략
- 고주파 동적 다중 지표 이동 평균 크로스오버 전략
- 트리플 익스포넌셜 이동 평균 트렌드 거래 전략
- 일일 높은-저한 브레이크 아웃 시스템과 함께 멀티 타임프레임 EMA 트렌드 전략
- 고급 유연한 다기간 이동평균 크로스오버 전략
- T3 이동평균 트렌드 트래일링 스톱 로스 전략
- 이치모쿠 클라우드 브레이크오웃 및 스톱-러스 시스템과 함께 전략에 따른 다기술 지표 트렌드
- 이중 표준편차 볼링거 밴드 모멘텀 브레이크업 전략
- 높은 낮은 브레이크아웃 거래 시스템으로 고급 타임프레임 피보나치 리트레이싱
- 다중 지표 크로스 트렌드 추적 및 부피 가격 결합 적응 거래 전략
- 상거래 시스템을 따르는 고급 이중 이동 평균 모멘텀 트렌드
- 역동적 취득 스마트 트레일 전략
- ATR 변동성 관리와 함께 전략에 따른 다중 시간 프레임 트렌드
- 볼링거 밴드 및 RSI를 기반으로 한 동적 비용 평균화 전략 시스템
- ATR 스톱 로스 시스템과 함께 멀티SMA 지원 레벨 가짜 브레이크 아웃 전략
- 스톱 로스 및 취업 이윤 최적화 시스템과 함께 EMA 크로스오버 전략
- VWAP-MACD-RSI 다중 요인 양적 거래 전략
- 트리플 이동 평균 트렌드 다음 및 모멘텀 통합 양적 거래 전략
- Z 스코어 및 슈퍼트렌드 기반의 동적 거래 전략: 긴 단편 전환 시스템