개요
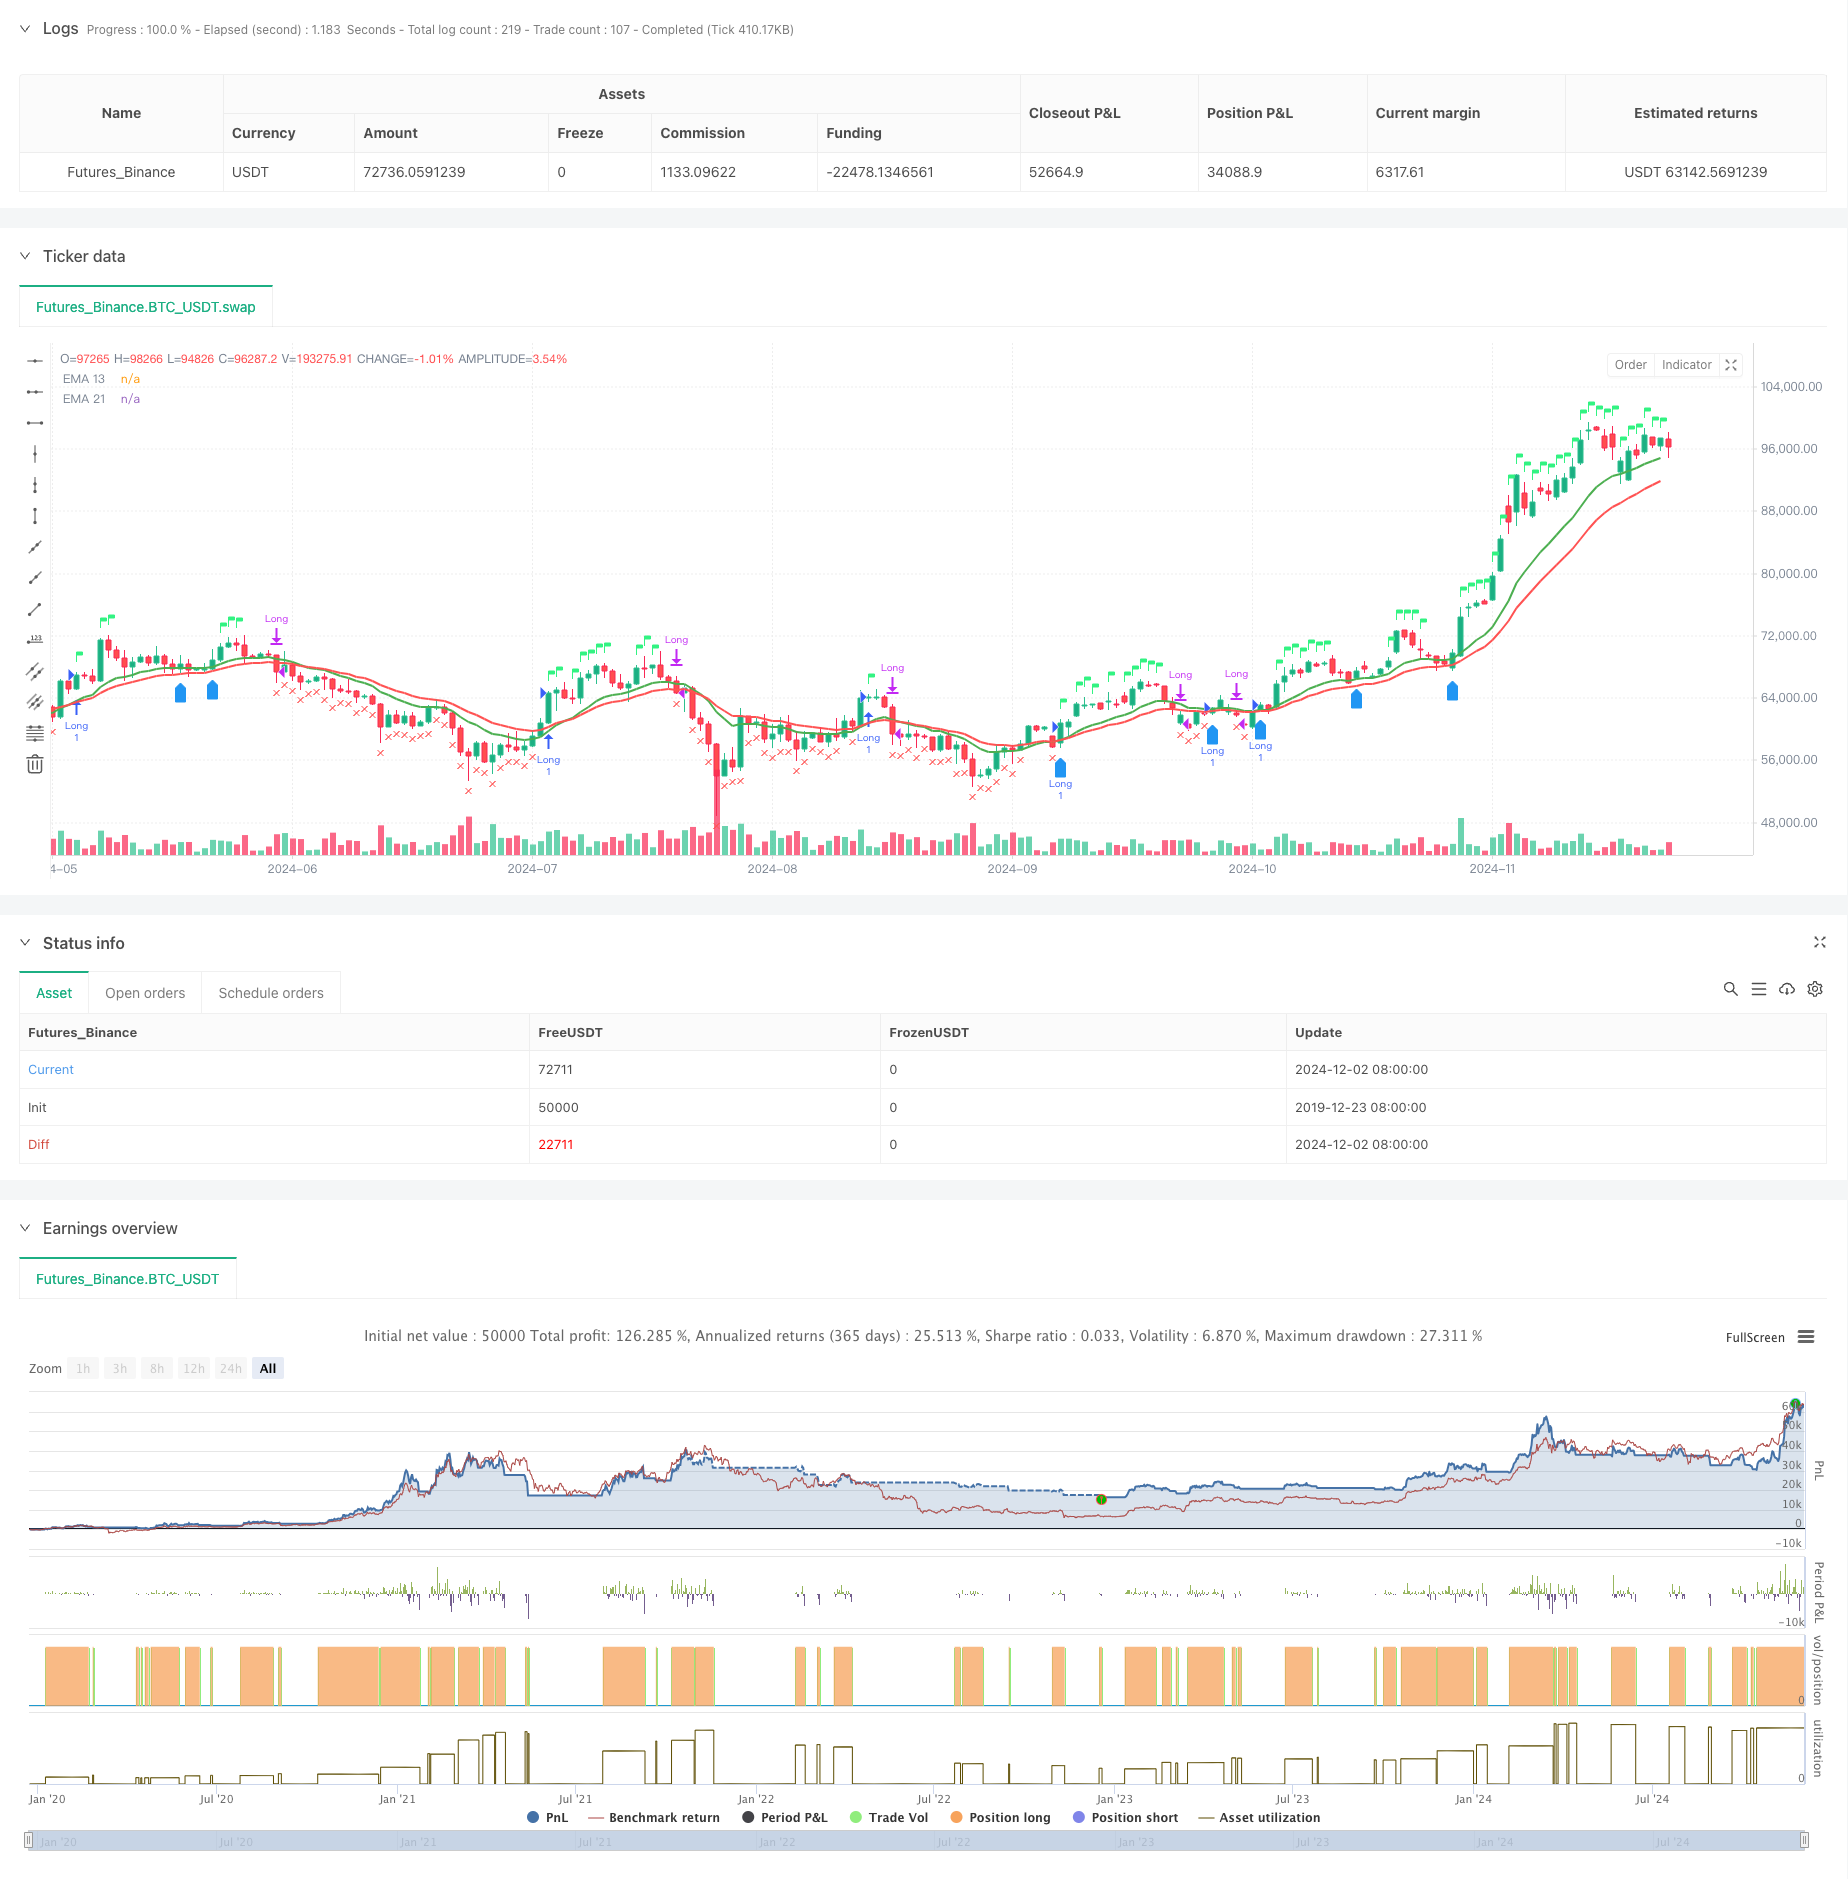
이 전략은 양평선 시스템, 상대적으로 약한 지표 ((RSI) 와 상대적으로 강한 지표 ((RS) 분석을 결합한 통합 거래 시스템입니다. 전략은 13일과 21일 지수 이동 평균 ((EMA) 의 교차 확인 트렌드를 통해, RSI와 기준 지수의 RS 값에 대한 거래 신호의 확인을 결합하면서 다차원 거래 의사 결정 메커니즘을 구현합니다. 이 전략은 또한 52주 최고점에 대한 위험 제어 메커니즘과 재입장 조건에 대한 판단을 포함합니다.
전략 원칙
여러 신호 확인 메커니즘을 사용하는 전략:
- 입력 신호는 다음과 같은 조건을 동시에 충족해야 합니다:
- EMA13에 EMA21을 착용하거나 EMA13보다 높은 가격
- RSI가 60보다 크면
- 상대 강도 (RS) 는
- 탈퇴 조건은 다음과 같습니다.
- 가격 하락 EMA21
- RSI는 50보다 낮습니다
- RS를 마이너스로 변환합니다.
- 재입학 조건:
- 가격은 EMA13를 착용하고 EMA13는 EMA21보다 크다.
- RS는 0으로 유지됩니다.
- 지난주 최고치를 넘어서거나
전략적 이점
- 복수 신호 확인 메커니즘이 가짜 침입 위험을 낮춘다
- 상대 강도 분석과 함께 강력한 품종을 효과적으로 선별합니다.
- 자율적 시간 주기 조정 메커니즘
- 위험 통제 체계가 잘 갖추어져 있습니다.
- 지능형 재입학 메커니즘
- 실시간 거래 상태를 시각화합니다.
전략적 위험
- 시장의 흔들림으로 인해 거래가 빈번해질 수 있습니다.
- 다중 지표에 의존하면 신호 지연이 발생할 수 있습니다.
- 고정 RSI 마이너스는 모든 시장 환경에 적합하지 않을 수 있습니다.
- 상대 강도 계산은 기준 지수의 정확성에 의존합니다.
- 52주 최고치의 중지 손실이 너무 느려질 수 있습니다.
전략 최적화 방향
- 적응된 RSI 마이너스
- 재입학 조건을 최적화하기 위한 판단 논리
- 거래량 분석 차원을 추가합니다.
- 손절매 및 손절매 메커니즘 개선
- 변동율 필터에 추가
- 상대 강도 계산 사이클을 최적화
요약하다
이 전략은 기술 분석과 상대 강도 분석을 결합하여 포괄적인 거래 시스템을 구축한다. 여러 신호 확인 메커니즘과 위험 제어 시스템은 강력한 실용성을 갖는다. 제안된 최적화 방향에 의해 전략은 더 향상될 여지가 있다. 전략의 성공적인 실행은 거래자가 시장에 대한 깊은 이해를 가지고 특정 거래 품종의 특성에 따라 적절한 매개 변수를 조정해야 한다.
전략 소스 코드
/*backtest
start: 2019-12-23 08:00:00
end: 2024-12-03 00:00:00
period: 1d
basePeriod: 1d
exchanges: [{"eid":"Futures_Binance","currency":"BTC_USDT"}]
*/

//@version=5
strategy("EMA 13 & 21 Entry Exit", overlay=true)

// Define the EMAs
ema13 = ta.ema(close, 13)
ema21 = ta.ema(close, 21)

// Define the RSI
rsi = ta.rsi(close, 14)

// Calculate the closing price relative to Nifty 50
//nifty50 = request.security("NSE:NIFTY", timeframe.period, close)
//closeRelative = close / nifty50

// Define a base period (e.g., 123) and adjust it based on the timeframe
//basePeriod = 123

// Calculate the effective period based on the timeframe
//effectivePeriod = basePeriod * (timeframe.isintraday ? (60 / timeframe.multiplier) : 1)

// Calculate the EMA
//rs = ta.ema(closeRelative, effectivePeriod)

// Define the Relative Strength with respect to NIFTY 50
nifty50 = request.security("swap", "D", close)
rs = ta.ema(close / nifty50, 55 )

// Define the previous 2-week low and last week's high
twoWeekLow = ta.lowest(low, 10)  // 10 trading days roughly equal to 2 weeks
lastWeekHigh = ta.highest(high, 5)  // 5 trading days roughly equal to 1 week
fiftytwoWeekhigh = ta.highest(high, 52*5) // 252 tradingdays roughly equal to 52 week.

// Long condition: EMA 21 crossing above EMA 55, price above EMA 21, RSI > 50, and RS > 0
longCondition = ta.crossover(ema13, ema21) or close > ema13 and rsi > 60 and rs > 0

// Exit condition: Price closing below EMA 55 or below the previous 2-week low
exitCondition = close < ema21 or rsi < 50 or rs < 0 //or close < fiftytwoWeekhigh*0.80

// Re-entry condition: Price crossing above EMA 21 after an exit, EMA 21 > EMA 55, and RS > 1
reEntryCondition = ta.crossover(close, ema13) and ema13 > ema21 and rs > 0

// Re-entry condition if trailing stop loss is hit: Price crossing above last week's high
reEntryAfterSL = ta.crossover(close, lastWeekHigh)

// Plot the EMAs
plot(ema13 ,color=color.green, title="EMA 13",linewidth = 2)
plot(ema21, color=color.red, title="EMA 21",linewidth = 2)


// Plot buy and sell signals
plotshape(series=longCondition, location=location.abovebar, color=color.rgb(50, 243, 130), style=shape.flag, title="Buy Signal")
plotshape(series=exitCondition, location=location.belowbar, color=color.red, style=shape.xcross, title="Sell Signal")
plotshape(series=reEntryCondition or reEntryAfterSL, location=location.belowbar, color=color.blue, style=shape.labelup, title="Re-entry Signal")
//plotshape(series = fiftytwoWeekhigh,location=location.abovebar, color=color.blue,style=shape.flag, title="52WH")

// Plot background color for RS > 0
//bgcolor(rs > 0 ? color.new(color.green, 90) : na, title="RS Positive Background")
// Plot the previous 2-week low and last week's high
// plot(twoWeekLow, color=color.orange, title="2-Week Low")
// plot(lastWeekHigh, color=color.purple, title="Last Week High")

// Strategy logic
if (longCondition or reEntryCondition or reEntryAfterSL)
    strategy.entry("Long", strategy.long)

if (exitCondition)
    strategy.close("Long")

 // Calculate Stop Loss (SL) and Profit
var float entryPrice = na
var float stopLoss = na
var float profit = na

if (strategy.opentrades > 0)
    entryPrice := strategy.opentrades.entry_price(strategy.opentrades - 1)
    stopLoss := fiftytwoWeekhigh * 0.80
    profit := (close - entryPrice) / entryPrice * 100

// Display the strategy table
var table strategyTable = table.new(position.top_right, 4, 2, border_width = 1)

// Make the table movable
tableX = input.int(0, title="Table X Position")
tableY = input.int(0, title="Table Y Position")

// Add size options for the table
tableSize = input.string("small", title="Table Size", options=["tiny", "small", "large"])

// Adjust table size based on user input
tableWidth = tableSize == "tiny" ? 2 : tableSize == "small" ? 4 : 6
tableHeight = tableSize == "tiny" ? 1 : tableSize == "small" ? 2 : 3

// Create the table with the specified size
//table = table.new(position.top_right, tableWidth, tableHeight, border_width = 1)

// Position the table based on user input
// table.cell(strategyTable, tableX, tableY, "Entry Price",  bgcolor=#18eef9)
// table.cell(strategyTable, tableX, tableY + 1, str.tostring(entryPrice, format.mintick), bgcolor=#18eef9)
// table.cell(strategyTable, tableX + 1, tableY, "Stop Loss (20%)", bgcolor=color.red)
// table.cell(strategyTable, tableX + 1, tableY + 1, str.tostring(stopLoss, format.mintick), bgcolor=color.red)
// table.cell(strategyTable, tableX + 2, tableY, "Profit (%)", bgcolor=color.green)
// table.cell(strategyTable, tableX + 2, tableY + 1, str.tostring(profit, format.percent), bgcolor=color.green)