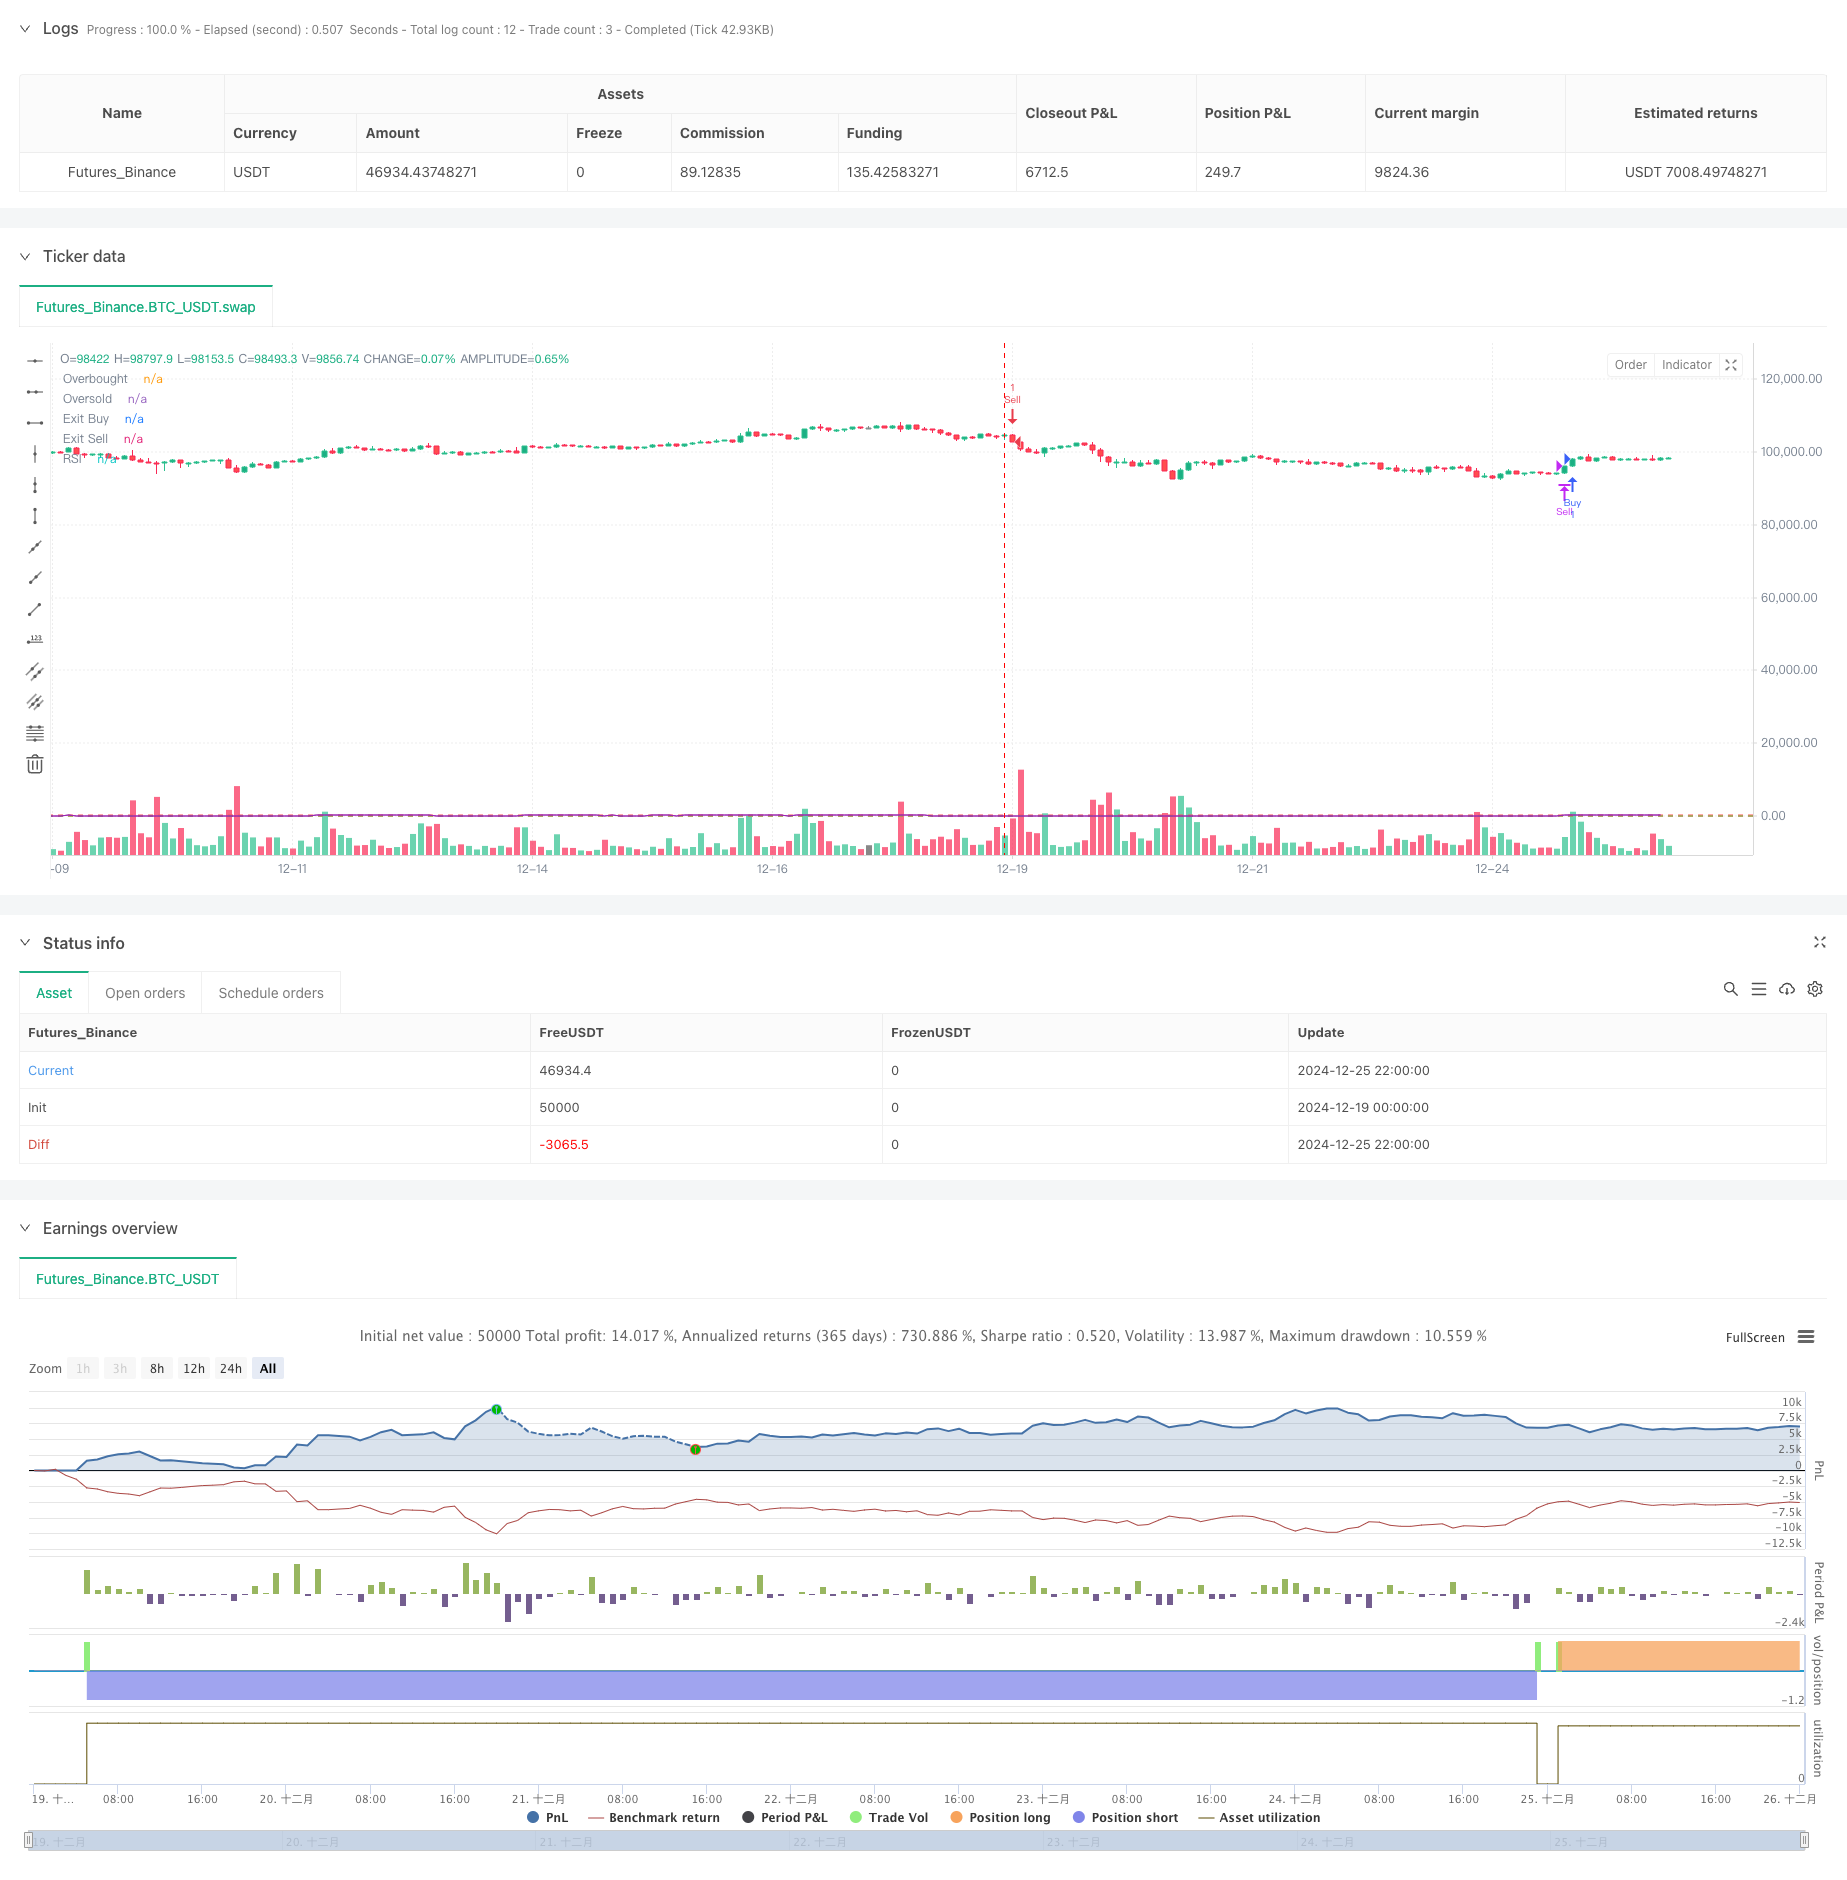
ATR 스톱 로스 및 거래 구역 제어와 함께 RSI 트렌드 역전 거래 전략
저자:차오장, 날짜: 2024-12-27 14:52:55태그:RSIATR

전반적인 설명
이 전략은 상대적 강도 지수 (RSI) 를 기반으로 한 트렌드 역전 거래 시스템으로, 과잉 구매 및 과잉 판매 구역을 통해 시장 전환점을 포착하는 동시에 위험 통제를 위해 ATR 기반 동적 스톱 로스를 통합하도록 설계되었습니다. 전략의 독특한 특징은 불안정한 시장에서 빈번한 거래를 효과적으로 방지하는 '무역 구역' 개념을 도입하는 것입니다. 이 전략은 특히 높은 변동성과 명확한 트렌드 특성을 가진 시장에 적합합니다.
전략 원칙
이 전략은 다음과 같은 핵심 논리를 구현합니다.
- 14 기간 RSI를 사용하여 시장의 과반 구매 및 과반 판매 상황을 식별합니다.
- RSI가 60을 넘어서고 종료 가격이 이전 최고치보다 높을 때 긴 진입을 촉발합니다.
- RSI가 40 이하로 떨어지고 닫기 가격이 이전 최저치보다 낮을 때 단축 엔트리를 유발합니다.
- RSI가 45-55 사이일 때 거래 금지 구역을 설정하여 통합 단계에서 빈번한 거래를 방지합니다.
- 리스크 통제를 위해 1.5배 ATR에 기초한 동적 스톱 손실을 설정합니다.
- RSI가 45 이하로 떨어지면 긴 포지션을 종료하고 RSI가 55 이상으로 올라가면 짧은 포지션을 종료합니다.
전략적 장점
- 거래 결정에 대한 트렌드 역전 및 추진력 특성을 결합합니다.
- 거래 금지 구역을 통해 불안한 시장에서 잘못된 신호를 효과적으로 피합니다.
- 시장 변동에 적응하는 동적 스톱 로스를 사용하는 ATR
- 주관적 판단을 피하는 명확한 입국 및 출입 조건
- 간단하고 명확한 전략 논리, 이해하기 쉽고 유지하기 쉬운
- 강력한 위험 관리 메커니즘
전략 위험
- 급변하는 시장에서 기회를 놓칠 수 있습니다.
- RSI 지표는 입력 시기를 지연시킬 수있는 고유 한 지연을 가지고 있습니다.
- 금지 무역 구역은 중요한 무역 기회를 놓칠 수 있습니다.
- 높은 변동성 기간 동안 ATR 정지는 너무 넓을 수 있습니다.
- 다른 시장 조건에 대한 적절한 매개 변수 최적화를 요구합니다.
전략 최적화 방향
- 신호 신뢰성을 향상시키기 위해 여러 시간 프레임 RSI 확인을 포함
- 부가 확인으로 부피 지표를 추가합니다.
- 비무역 구역의 동적 조정 메커니즘을 최적화
- 강한 트렌드에서 매개 변수를 조정하는 트렌드 필터 기능을 추가하는 것을 고려하십시오.
- 전략의 적응성을 향상시키기 위한 적응적 매개 변수 최적화 메커니즘을 개발
- 자본 효율을 높이기 위한 수익제도 추가
요약
이 전략은 혁신적인 RSI 역전 신호와 거래 금지 구역의 조합을 통해 트렌드 트레이딩의 타이밍 문제를 효과적으로 해결합니다. ATR 동적 스톱 손실의 도입은 신뢰할 수있는 위험 제어 메커니즘을 제공합니다. 전략에는 일부 잠재적 인 위험이 있지만 안정성과 수익성을 더욱 향상시키기 위해 제안된 최적화 방향을 통해 해결할 수 있습니다. 전반적으로 이것은 논리적으로 명확하고 실용적인 트렌드 역전 거래 전략입니다.
/*backtest
start: 2024-12-19 00:00:00
end: 2024-12-26 00:00:00
period: 2h
basePeriod: 2h
exchanges: [{"eid":"Futures_Binance","currency":"BTC_USDT"}]
*/

//@version=5
strategy("RSI-Based Trading Strategy with No Trading Zone and ATR Stop Loss", overlay=true)

// Input parameters
rsiPeriod = input(14, title="RSI Period")
rsiOverbought = input(60, title="RSI Overbought Level")
rsiOversold = input(40, title="RSI Oversold Level")
rsiExitBuy = input(45, title="RSI Exit Buy Level")
rsiExitSell = input(55, title="RSI Exit Sell Level")
atrPeriod = input(14, title="ATR Period")
atrMultiplier = input(1.5, title="ATR Stop Loss Multiplier")

// Calculate RSI and ATR
rsi = ta.rsi(close, rsiPeriod)
atr = ta.atr(atrPeriod)

// Buy conditions
buyCondition = ta.crossover(rsi, rsiOverbought) and close > high[1]
if (buyCondition and not strategy.position_size)
    stopLossLevel = close - atr * atrMultiplier
    strategy.entry("Buy", strategy.long, stop=stopLossLevel)

// Exit conditions for buy
exitBuyCondition = rsi < rsiExitBuy
if (exitBuyCondition and strategy.position_size > 0)
    strategy.close("Buy")

// Sell conditions
sellCondition = ta.crossunder(rsi, rsiOversold) and close < low[1]
if (sellCondition and not strategy.position_size)
    stopLossLevel = close + atr * atrMultiplier
    strategy.entry("Sell", strategy.short, stop=stopLossLevel)

// Exit conditions for sell
exitSellCondition = rsi > rsiExitSell
if (exitSellCondition and strategy.position_size < 0)
    strategy.close("Sell")

// Plotting RSI for visualization
hline(rsiOverbought, "Overbought", color=color.red)
hline(rsiOversold, "Oversold", color=color.green)
hline(rsiExitBuy, "Exit Buy", color=color.blue)
hline(rsiExitSell, "Exit Sell", color=color.orange)
plot(rsi, title="RSI", color=color.purple)

// // No Trading Zone
// var box noTradingZone = na

// // Create a rectangle for the no trading zone
// if (rsi >= rsiExitBuy and rsi <= rsiExitSell)
//     // If the no trading zone box does not exist, create it
//     if (na(noTradingZone))
//         noTradingZone := box.new(bar_index, high, bar_index + 1, low, bgcolor=color.new(color.gray, 90), border_color=color.new(color.gray, 90))
//     else
//         // Update the existing box to cover the current candle
//         box.set_left(noTradingZone, bar_index)
//         box.set_right(noTradingZone, bar_index + 1)
//         box.set_top(noTradingZone, high)
//         box.set_bottom(noTradingZone, low)
// else
//     // If the RSI is outside the no trading zone, delete the box
//     if (not na(noTradingZone))
//         box.delete(noTradingZone)
//         noTradingZone := na
관련
- 다중 지표 지능형 피라미드 전략
- RSI 최적화 시스템으로 듀얼 타임프레임 슈퍼트렌드
- 이중 시간 프레임 슈퍼 트렌드 RSI 지능형 거래 전략
- RSI 트렌드 역전 전략
- RSI-볼링거 대역 통합 전략: 동적 자율 적응 다중 지표 거래 시스템
- RSI-ATR 모멘텀 변동성 결합 거래 전략
- 토요일 전환 전략 (주말 필터)
- 다단계 동적 트렌드 추적 시스템
- Han Yue - 다중 EMA, ATR 및 RSI를 기반으로 한 트렌드 다음 거래 전략
- Z 스코어 및 슈퍼트렌드 기반의 동적 거래 전략: 긴 단편 전환 시스템
더 많은
- 모멘텀 기반 SMI 크로스오버 신호 적응 예측 전략
- 다중 이동 평균 크로스오버 신호 강화 거래 전략
- 볼링거 반드와 우디스 CCI를 이용한 다중 지표 필터링 거래 전략
- 동적 이동 평균 트렌드를 RSI 확인 거래 전략으로 따라
- 풀백 최적화 시스템과 동적 다 기간 기하급수적 이동 평균 크로스 전략
- 동적 이동 평균 크로스오버 트렌드 적응적 리스크 관리 전략
- 스토카스틱 RSI를 기반으로 한 적응적 거래 전략
- 다단계 기관 주문 흐름 양적 전략
- 다중 EMA 동적 트렌드 포착 양적 거래 전략
- 동적 이동 평균 및 고정 스톱 손실 최적화 모델과 볼링거 밴드 교차 전략
- 오시레이터와 동적 지원/저항 거래 전략과 함께 멀티 EMA 크로스
- 거래 전략에 따른 다중SMA 및 스토카스틱 결합 트렌드
- 표준화 된 로그아리듬 수익에 기초한 적응적 동적 거래 전략
- 다중 지표 크로스 트렌드 다음 거래 전략: 스토카스틱 RSI 및 이동 평균 시스템 기반의 양적 분석
- 다중 지표 트렌드 크로싱 전략: 황소 시장 지원 밴드 거래 시스템
- 다단계 동적 MACD 트렌드 52주 높은/저한 연장 분석 시스템
- 이중 EMA RSI 모멘텀 트렌드 역전 거래 시스템 - EMA와 RSI 크로스오버에 기반한 모멘텀 돌파구 전략
- 다중 지표 높은 주파수 범위 거래 전략
- 동적 트렌드 라인 브레이크 오버 트레이딩 전략
- EMA와 SMA를 기반으로 하는 전략에 따른 다중 지표 동적 경향