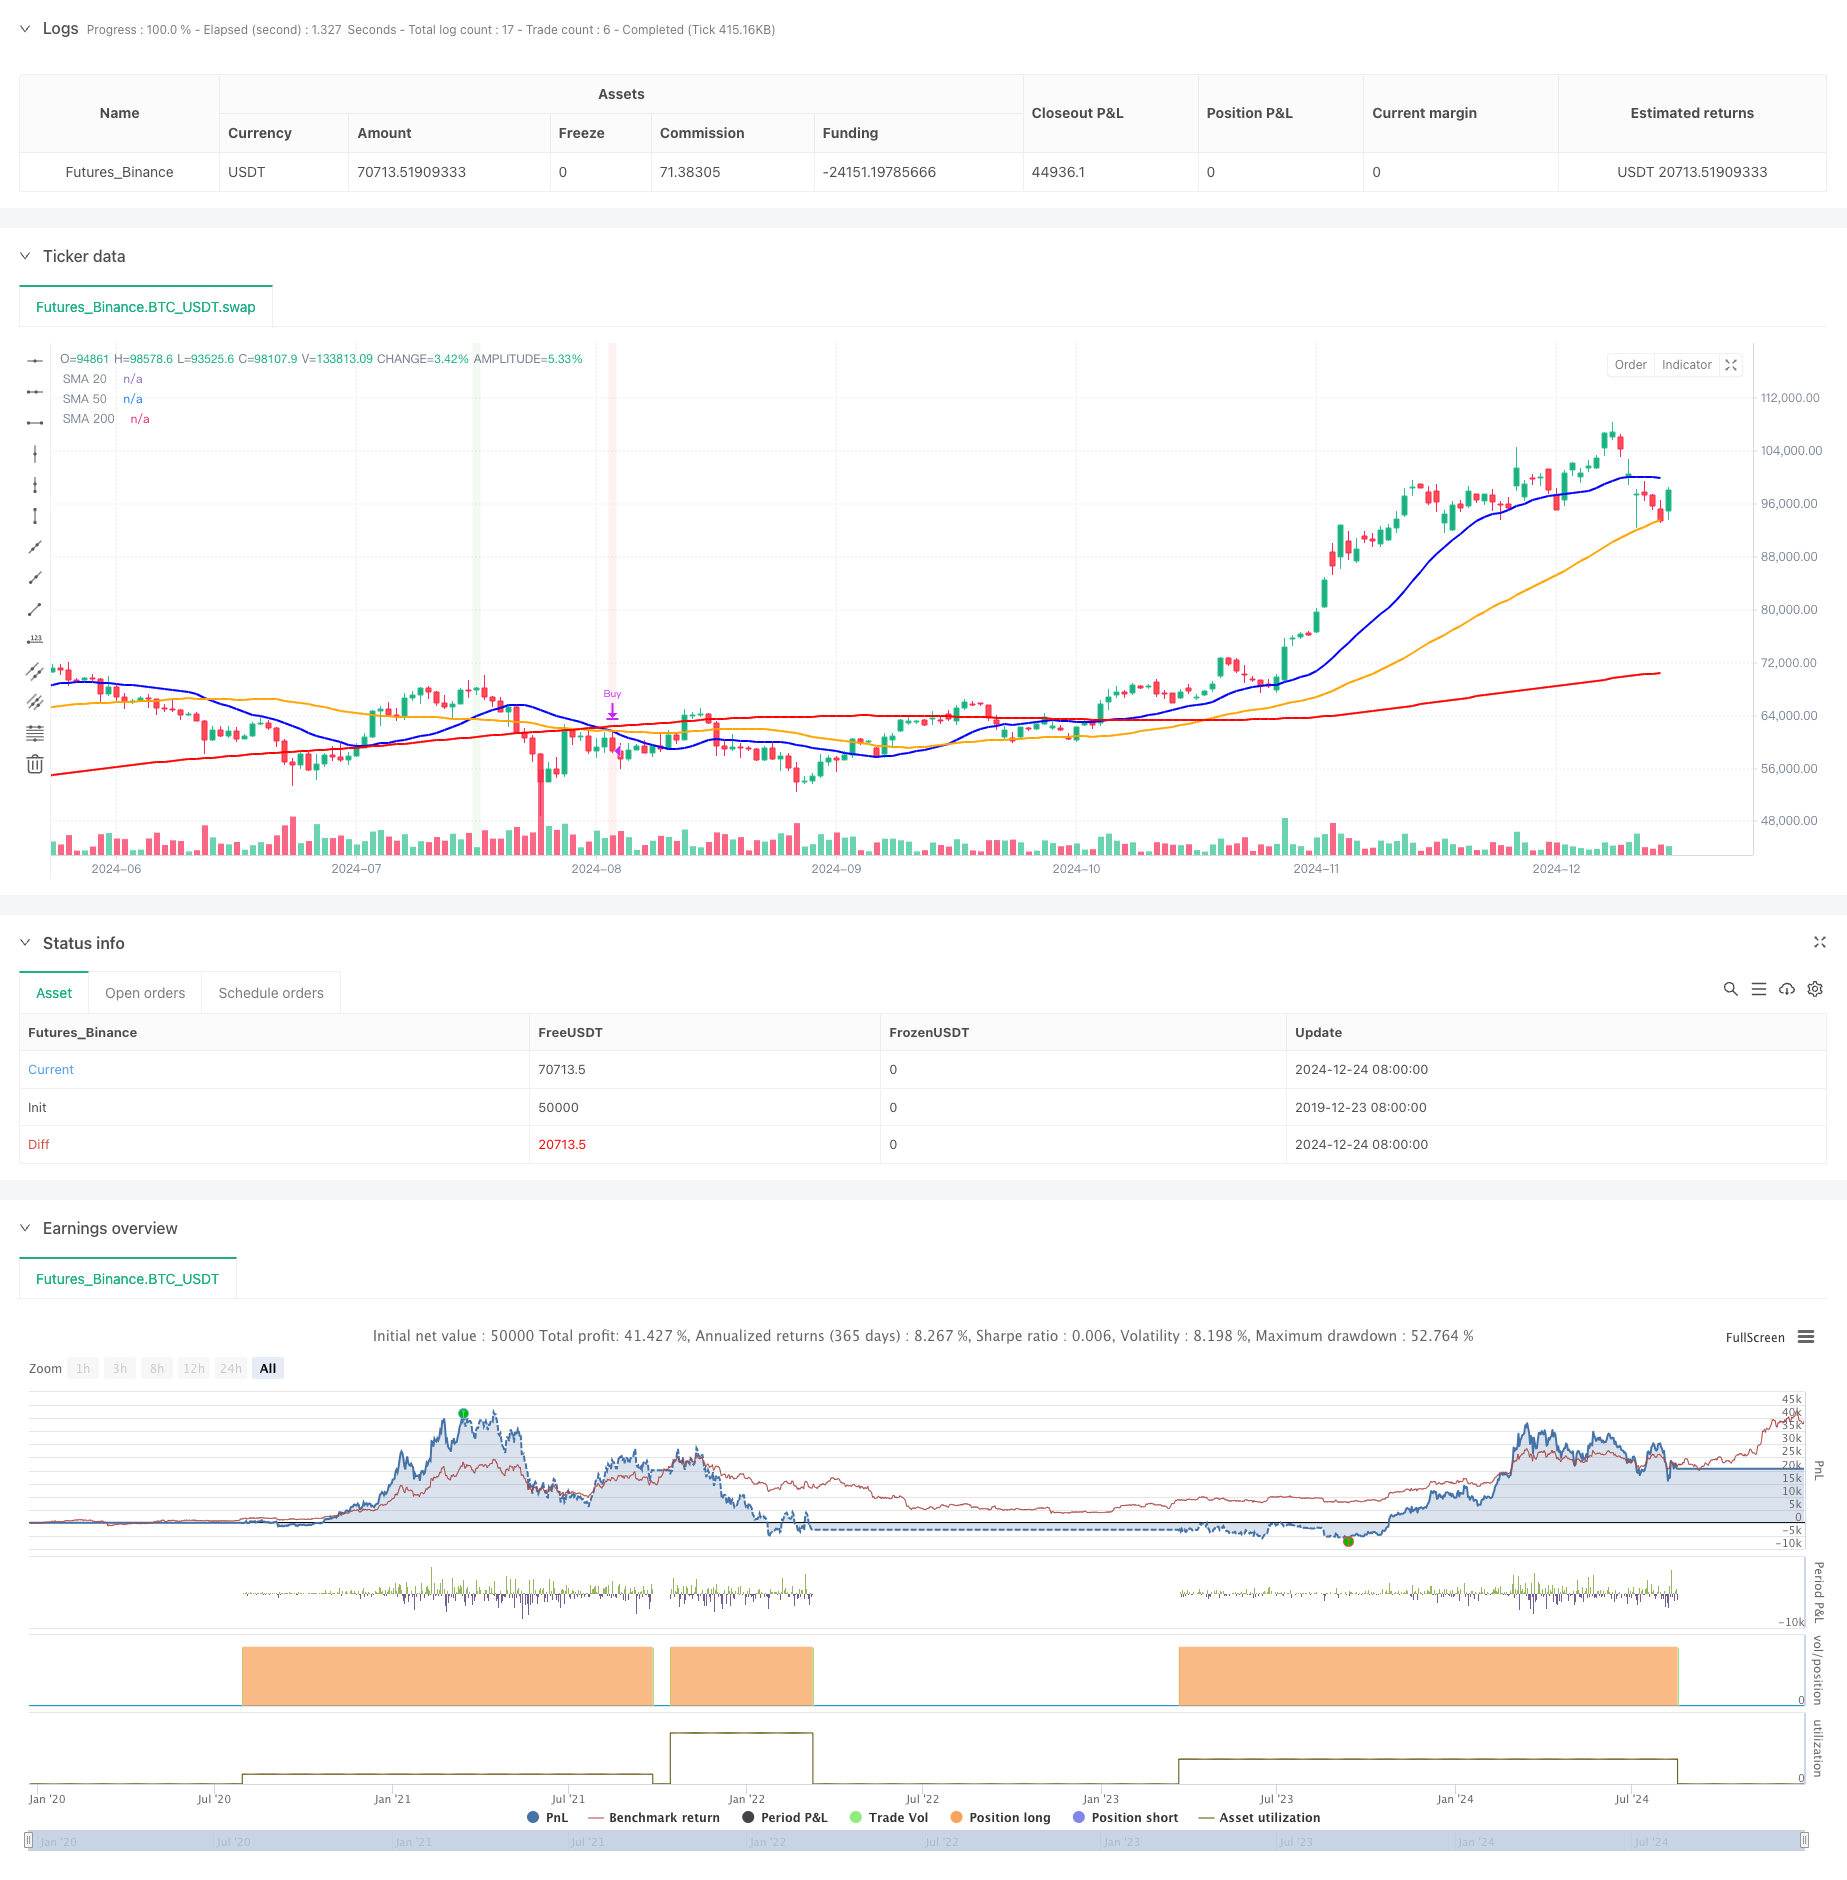
다중 이동 평균 크로스오버 신호 강화 거래 전략
저자:차오장, 날짜: 2024-12-27 15:34:02태그:SMAMA

전반적인 설명
이 전략은 여러 가지 간단한 이동 평균 (SMA) 크로스오버 신호를 기반으로 한 양적 거래 시스템이다. 이동 평균 크로스오버와 가격 위치 관계를 포착함으로써 시장 트렌드 변화와 잠재적 거래 기회를 식별하기 위해 서로 다른 기간 (20, 50, 200 일) 을 가진 세 개의 SMA를 사용합니다. 전략은 장기 이동 평균을 트렌드 필터로 사용하여 거래 품질을 향상시키는 동안 단기 및 중기 이동 평균 크로스오버를 모두 고려합니다.
전략 원칙
핵심 논리는 다음과 같은 핵심 요소에 기반합니다.
- 단기 트렌드 지표로 20일 SMA, 중기 트렌드 지표로 50일 SMA, 장기 트렌드 지표로 200일 SMA를 사용합니다.
- 주요 입시 신호: 20일 SMA가 50일 SMA를 넘고 가격이 200일 SMA를 넘으면 시스템이 긴 신호를 생성합니다.
- 주요 출구 신호: 20일 SMA가 50일 SMA를 넘고 가격이 200일 SMA를 넘으면 시스템이 종료 신호를 생성합니다.
- 2차 신호: 추가 지표로 50일과 200일 SMA 사이의 교차점을 모니터링합니다.
- 마커와 배경 색상 변경을 통해 거래 신호를 시각화
전략적 장점
- 멀티 타임프레임 분석: 종합적인 트렌드 분석을 위해 다양한 기간의 이동 평균을 통합합니다.
- 트렌드 필터링: 200일 SMA를 트렌드 필터로 사용하여 잘못된 브레이크 위험을 효과적으로 줄입니다.
- 신호 계층: 시장에 대한 더 나은 통찰력을 위해 1차 신호와 2차 신호를 구분합니다.
- 향상된 시각화: 전략 가독성을 향상시키기 위해 마커와 배경 색상을 사용합니다.
- 유연한 매개 변수: 이동 평균 기간, 색상 및 라인 너비의 사용자 정의를 허용하여 다른 거래 필요에 적응합니다.
전략 위험
- 부평적 시장 위험: 통합 단계에서 종종 잘못된 신호를 생성할 수 있습니다.
- 지연 위험: 이동 평균은 본질적으로 지연 지표이며 중요한 전환점을 놓칠 수 있습니다.
- 매개 변수 의존성: 최적 매개 변수는 다른 시장 환경에서 크게 다를 수 있습니다.
- 트렌드 의존성: 트렌드 시장에서 전략이 더 잘 수행되지만, 다양한 시장에서 성과가 떨어집니다.
- 신호 충돌: 여러 이동 평균은 모순적인 신호를 생성할 수 있습니다.
전략 최적화 방향
- 변동성 지표를 포함합니다: 동적 포지션 크기를 위해 ATR 또는 다른 변동성 지표를 추가하는 것을 고려하십시오.
- 볼륨 확인 추가: 신호 신뢰성을 향상시키기 위해 볼륨 분석을 통합
- 출구 메커니즘을 최적화: 더 유연한 스톱 로스 및 수익 전략 설계
- 시장 환경 필터링 추가: 다른 시장 조건에서 다른 매개 변수를 사용하기 위해 시장 상태 인식 모듈을 개발
- 적응 매개 변수를 구현합니다. 시장 특성에 따라 이동 평균 기간을 동적으로 조정합니다.
요약
이것은 명확한 논리를 가진 잘 구성된 이동 평균 거래 전략이다. 가격 위치 관계와 결합된 다양한 기간의 이동 평균을 포괄적으로 활용함으로써 전략은 시장 트렌드 변화를 효과적으로 포착합니다. 지연 및 측면 시장 취약성과 같은 특정 내재적인 위험이 있지만 합리적인 매개 변수 설정과 신호 필터링을 통해 전략은 실용적 가치를 유지합니다. 향후 개선은 추가 기술 지표를 통합하고 전략 안정성과 신뢰성을 향상시키기 위해 신호 생성 메커니즘을 최적화하는 데 초점을 맞출 수 있습니다.
/*backtest
start: 2019-12-23 08:00:00
end: 2024-12-25 08:00:00
period: 1d
basePeriod: 1d
exchanges: [{"eid":"Futures_Binance","currency":"BTC_USDT"}]
*/

//@version=5
strategy("SMA 20/50/200 Strateji", overlay=true)

// SMA Periyotlarını, renklerini ve çizgi kalınlıklarını özelleştirme
sma20_period = input.int(20, title="SMA 20 Periyodu", minval=1)
sma50_period = input.int(50, title="SMA 50 Periyodu", minval=1)
sma200_period = input.int(200, title="SMA 200 Periyodu", minval=1)

sma20_color = input.color(color.blue, title="SMA 20 Rengi")
sma50_color = input.color(color.orange, title="SMA 50 Rengi")
sma200_color = input.color(color.red, title="SMA 200 Rengi")

sma20_width = input.int(2, title="SMA 20 Kalınlığı", minval=1, maxval=5)
sma50_width = input.int(2, title="SMA 50 Kalınlığı", minval=1, maxval=5)
sma200_width = input.int(2, title="SMA 200 Kalınlığı", minval=1, maxval=5)

// SMA Hesaplamaları
sma20 = ta.sma(close, sma20_period)
sma50 = ta.sma(close, sma50_period)
sma200 = ta.sma(close, sma200_period)

// Al ve Sat Koşulları
buyCondition = ta.crossover(sma20, sma50) and close > sma200
sellCondition = ta.crossunder(sma20, sma50) and close < sma200

buyCondition_50_200 = ta.crossover(sma50, sma200)
sellCondition_50_200 = ta.crossunder(sma50, sma200)

// Grafik üzerine SMA çizimleri
plot(sma20, color=sma20_color, linewidth=sma20_width, title="SMA 20")
plot(sma50, color=sma50_color, linewidth=sma50_width, title="SMA 50")
plot(sma200, color=sma200_color, linewidth=sma200_width, title="SMA 200")

// Al-Sat Stratejisi
if buyCondition
    strategy.entry("Buy", strategy.long)
    label.new(bar_index, low, "BUY", style=label.style_label_up, color=color.new(color.green, 0), textcolor=color.white)

if sellCondition
    strategy.close("Buy")
    label.new(bar_index, high, "SELL", style=label.style_label_down, color=color.new(color.red, 0), textcolor=color.white)

if buyCondition_50_200
    label.new(bar_index, low, "50/200 BUY", style=label.style_label_up, color=color.new(color.blue, 0), textcolor=color.white)

if sellCondition_50_200
    label.new(bar_index, high, "50/200 SELL", style=label.style_label_down, color=color.new(color.orange, 0), textcolor=color.white)

// Performans Görselleştirmesi İçin Arka Plan Rengi
bgColor = buyCondition ? color.new(color.green, 90) : sellCondition ? color.new(color.red, 90) : na
bgcolor(bgColor)
관련
- MA, SMA, MA 슬로프, 트래일링 스톱 손실, 재입구
- 이중 이동 평균에 기초한 이동 평균 크로스오버 전략
- 이동 평균 크로스오버 전략
- 동적 위치 이중 이동 평균 크로스오버 전략
- SMA 이중 이동 평균 거래 전략
- 스토카스틱 오시레이터 및 스토카스틱 필터와 함께 이동 평균 크로스오버 전략
- 이중 이동 평균 추진력 거래 전략: 시간 최적화 트렌드 추적 시스템
- 트렌드 포착 전략
- 다중 이동 평균 트렌드 거래 전략
- 이중 이동 평균 크로스오버 적응 매개 변수 거래 전략
- MA 횡단 전략
더 많은
- 다기술 지표 기반의 고주파 동적 최적화 전략
- 삼중 슈퍼트렌드 및 계수적인 이동 평균 트렌드 양적 거래 전략을 따르는
- 클라우드 기반 볼링거 대역 두 배 이동 평균 양적 경향 전략
- 볼링거 밴드 트렌드 디버전스 기반의 다단계 양적 거래 전략
- 피보나치 0.7 레벨 트렌드 돌파를 기반으로 한 양적 거래 전략
- 여러 기간 프랙탈 브레이크 오더 블록 적응 거래 전략
- 이동평균 크로스오버에 기반한 리스크/어워드 비율 최적화 전략
- 동적 트렌드 인식 거래 전략을 따르는 적응 트렌드
- 보린저 대역을 기반으로 한 국경 간 동적 범위 양적 거래 전략
- 모멘텀 기반 SMI 크로스오버 신호 적응 예측 전략
- 볼링거 반드와 우디스 CCI를 이용한 다중 지표 필터링 거래 전략
- 동적 이동 평균 트렌드를 RSI 확인 거래 전략으로 따라
- 풀백 최적화 시스템과 동적 다 기간 기하급수적 이동 평균 크로스 전략
- 동적 이동 평균 크로스오버 트렌드 적응적 리스크 관리 전략
- 스토카스틱 RSI를 기반으로 한 적응적 거래 전략
- 다단계 기관 주문 흐름 양적 전략
- 다중 EMA 동적 트렌드 포착 양적 거래 전략
- 동적 이동 평균 및 고정 스톱 손실 최적화 모델과 볼링거 밴드 교차 전략
- ATR 스톱 로스 및 거래 구역 제어와 함께 RSI 트렌드 역전 거래 전략
- 오시레이터와 동적 지원/저항 거래 전략과 함께 멀티 EMA 크로스