Penembusan Kotak Darvas Dinamik dengan Sistem Perdagangan Pengesahan Trend Purata Bergerak
Penulis:ChaoZhang, Tarikh: 2024-11-18 16:00:53Tag:MA25SMA

Ringkasan
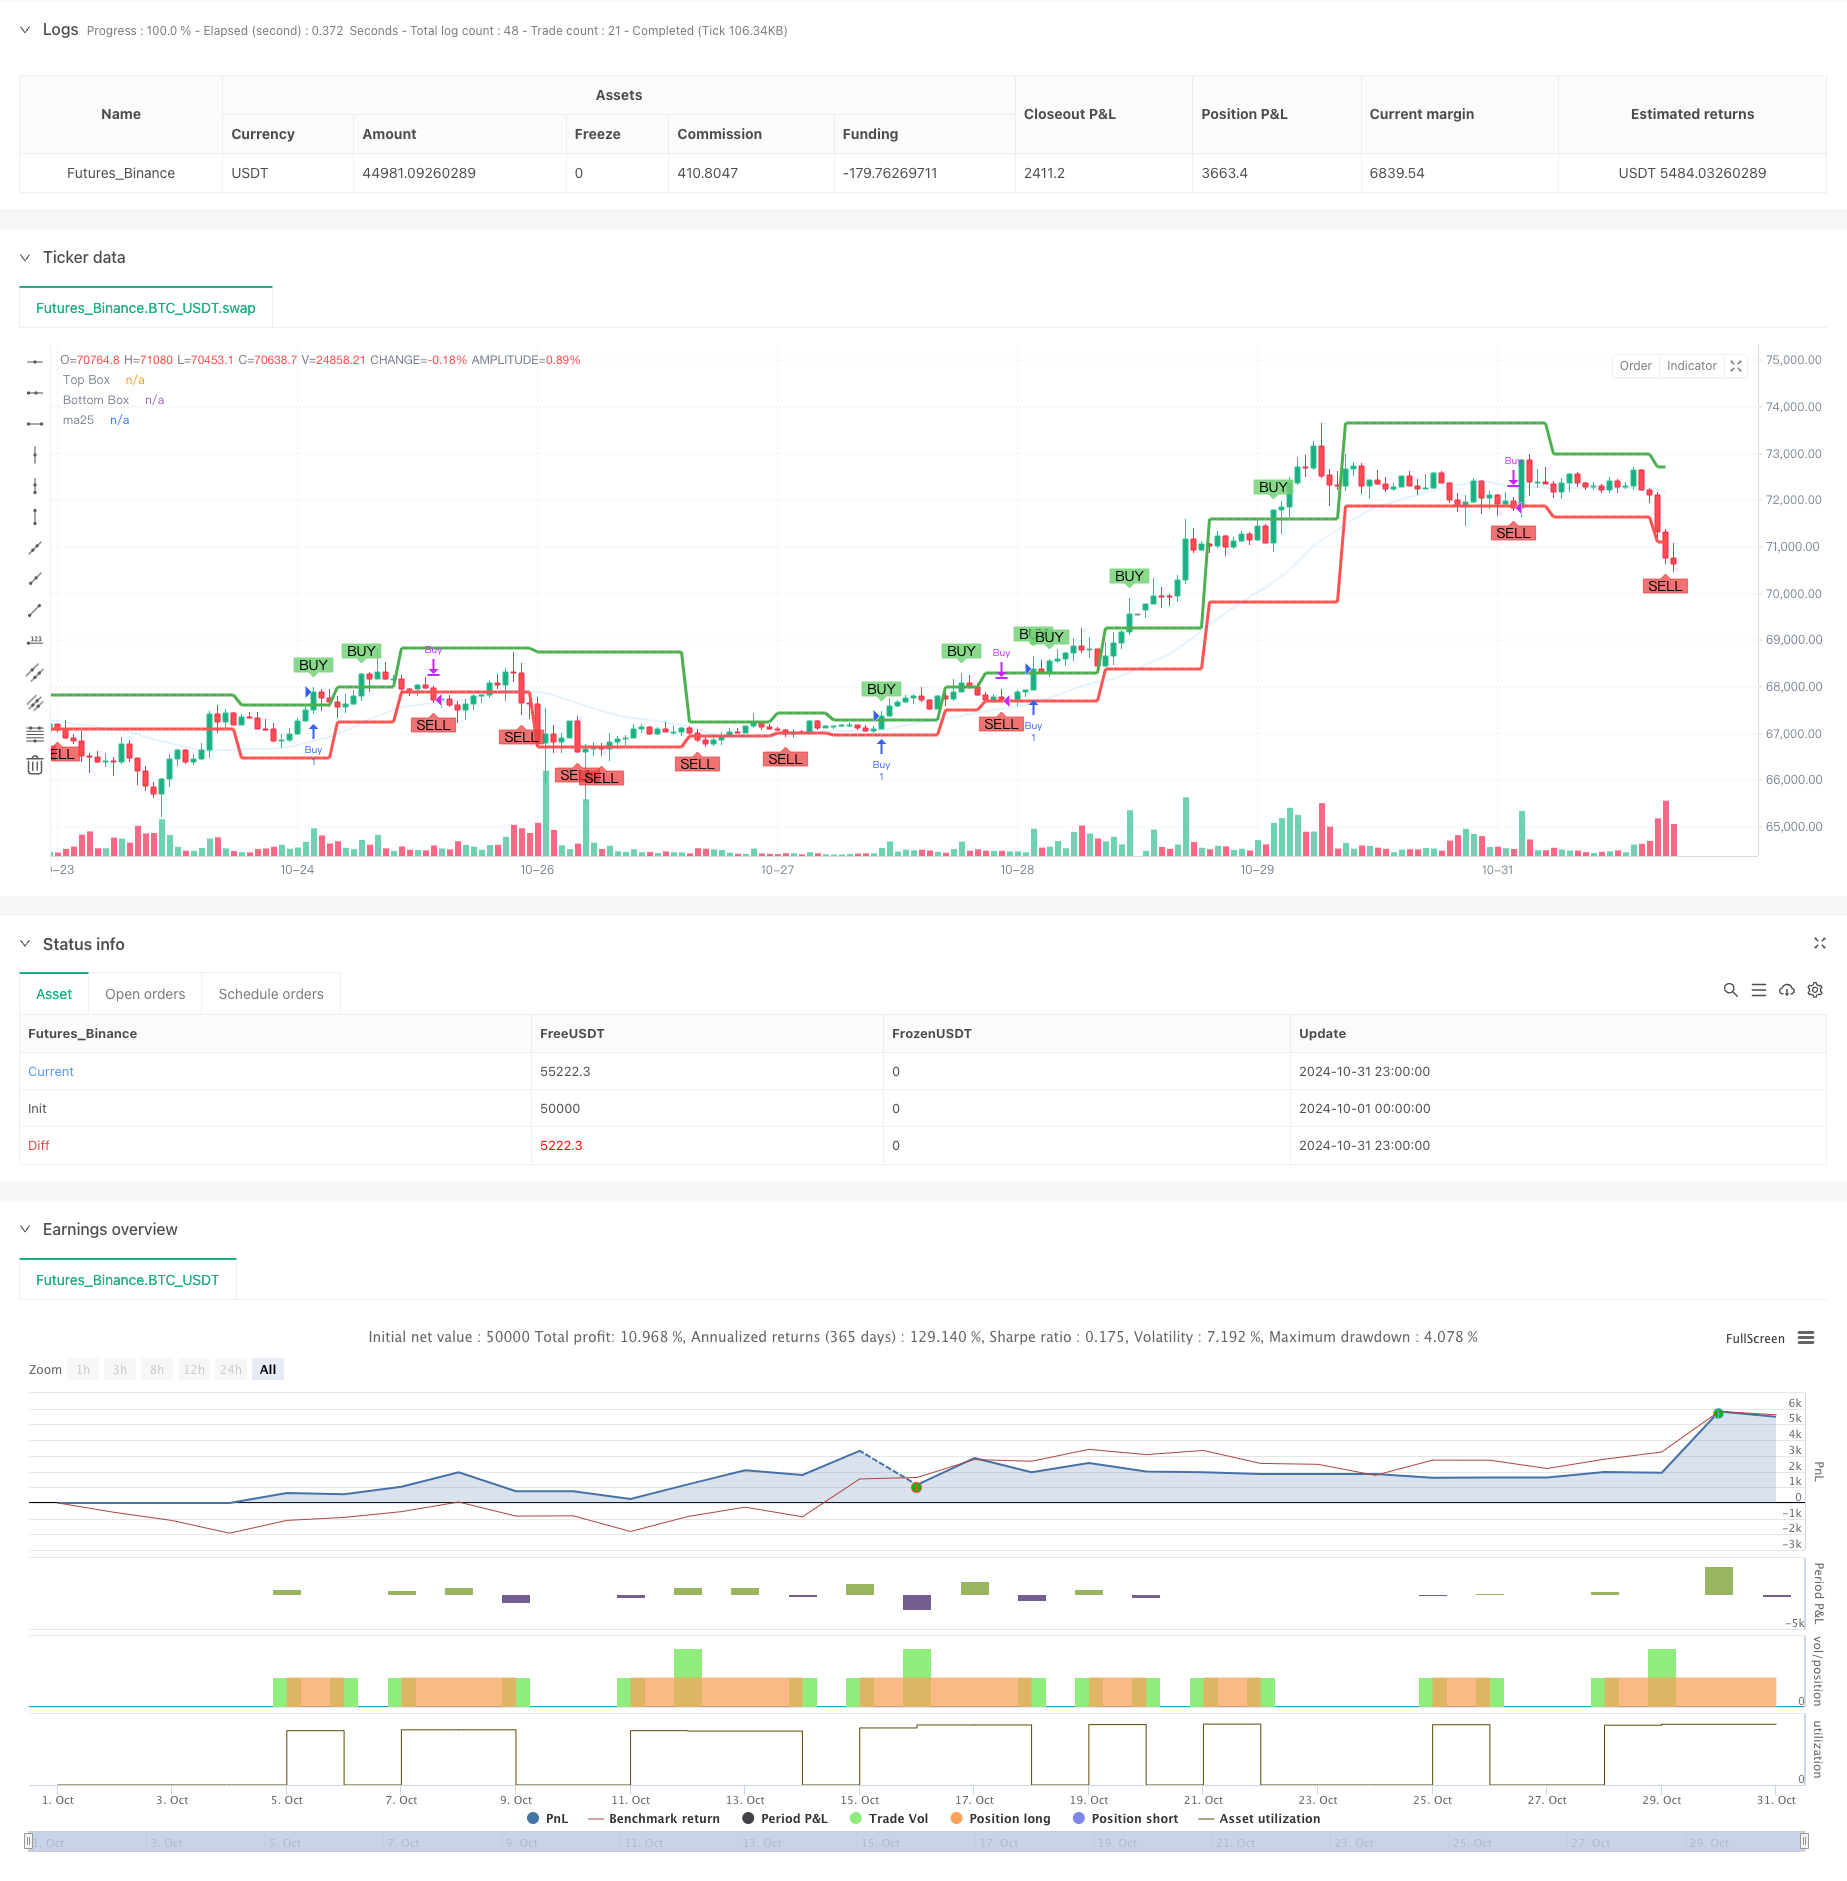
Artikel ini memperkenalkan sistem perdagangan trend berikut yang menggabungkan Kotak Darvas dan Purata Bergerak 25 tempoh (MA25). Strategi mengenal pasti zon penyatuan harga melalui pembentukan kotak dan mengesahkan trend dengan purata bergerak untuk menangkap pergerakan pasaran yang kuat semasa pecah. Reka bentuk sistem secara menyeluruh mempertimbangkan kesinambungan trend dan penapisan pecah palsu, menyediakan peniaga dengan rangka kerja lengkap untuk masuk dan keluar pasaran.
Prinsip Strategi
Strategi ini terdiri daripada tiga komponen utama:
- Pembinaan Kotak Darvas: Sistem menentukan sempadan kotak dengan mengira harga tertinggi dan terendah selama 5 tempoh.
- Pengesahan Trend Purata Bergerak: Purata bergerak mudah 25 tempoh diperkenalkan sebagai penapis trend, hanya mempertimbangkan kedudukan apabila harga di atas MA25.
- Generasi Isyarat Perdagangan:
- Isyarat Beli: Harga pecah di atas kotak atas dan di atas MA25
- Isyarat Jual: Harga pecah di bawah bahagian bawah kotak
Kelebihan Strategi
- Trend yang kuat mengikut keupayaan:
- Mencatatkan permulaan trend melalui pecah kotak
- Penapisan MA25 memastikan perdagangan dalam arah trend utama
- Pengoptimuman Kualiti Isyarat:
- Mekanisme pengesahan berganda mengurangkan risiko pecah palsu
- Syarat masuk dan keluar yang jelas mengelakkan pertimbangan subjektif
- Kawalan Risiko Komprehensif:
- Bahagian bawah kotak secara semula jadi membentuk tahap stop-loss
- MA25 menyediakan perlindungan trend tambahan
Risiko Strategi
- Risiko pasaran berbelit-belit:
- Pengecualian yang kerap boleh menyebabkan berhenti berturut-turut
- Disyorkan untuk digunakan di pasaran yang mempunyai trend yang kuat
- Risiko Lag:
- Pembentukan kotak memerlukan masa, mungkin terlepas langkah awal
- MA25 sebagai purata jangka sederhana mempunyai kelewatan yang melekat
- Risiko Pengurusan Wang:
- Memerlukan peruntukan modal yang betul untuk setiap perdagangan
- Cadangan untuk menyesuaikan saiz kedudukan secara dinamik dengan turun naik
Arahan Pengoptimuman Strategi
- Pengoptimuman Parameter:
- Tempoh kotak yang boleh diselaraskan berdasarkan ciri pasaran
- Tempoh MA boleh diselaraskan dengan ciri kitaran pasaran
- Peningkatan Isyarat:
- Boleh menambah mekanisme pengesahan jumlah
- Pertimbangkan untuk melaksanakan stop-loss dinamik
- Peningkatan Kawalan Risiko:
- Tambah penapis volatiliti
- Melaksanakan saiz kedudukan dinamik
Ringkasan
Strategi ini membina sistem dagangan yang kukuh dengan menggabungkan teori Darvas Box klasik dengan trend purata bergerak yang mengikuti. Kelebihannya utama terletak pada menangkap pasaran trend dengan berkesan sambil mengawal risiko melalui beberapa mekanisme penapisan. Walaupun terdapat beberapa kelewatan yang melekat, strategi ini dapat mencapai prestasi yang stabil di pasaran trend melalui pengoptimuman parameter yang betul dan pengurusan risiko.
/*backtest
start: 2024-10-01 00:00:00
end: 2024-10-31 23:59:59
period: 1h
basePeriod: 1h
exchanges: [{"eid":"Futures_Binance","currency":"BTC_USDT"}]
*/

//@version=5
strategy("DARVAS BOX with MA25 Buy Condition", overlay=true, shorttitle="AEG DARVAS")

// Input for box length
boxp = input.int(5, "BOX LENGTH")

// Calculate 25-period moving average
ma25 = ta.sma(close, 25)

// Lowest low and highest high within the box period
LL = ta.lowest(low, boxp)
k1 = ta.highest(high, boxp)
k2 = ta.highest(high, boxp - 1)
k3 = ta.highest(high, boxp - 2)

// New high detection
NH = ta.valuewhen(high > k1[1], high, 0)

// Logic to detect top and bottom of Darvas Box
box1 = k3 < k2
TopBox = ta.valuewhen(ta.barssince(high > k1[1]) == boxp - 2 and box1, NH, 0)
BottomBox = ta.valuewhen(ta.barssince(high > k1[1]) == boxp - 2 and box1, LL, 0)

// Plot the top and bottom Darvas Box lines
plot(TopBox, linewidth=3, color=color.green, title="Top Box")
plot(BottomBox, linewidth=3, color=color.red, title="Bottom Box")
plot(ma25, color=#2195f31e, linewidth=2, title="ma25")

// --- Buy and Sell conditions ---

// Buy when price breaks above the Darvas Box AND MA15
buyCondition = ta.crossover(close, TopBox) and close > ma25

// Sell when price drops below the Darvas Box
sellCondition = ta.crossunder(close, BottomBox)

// --- Buy and Sell Signals ---

// Plot BUY+ and SELL labels
plotshape(series=buyCondition, title="Buy+ Signal", location=location.abovebar, color=#72d174d3, style=shape.labeldown, text="BUY")
plotshape(series=sellCondition, title="Sell Signal", location=location.belowbar, color=color.rgb(234, 62, 62, 28), style=shape.labelup, text="SELL")

// --- Strategy execution ---

if (buyCondition)
    strategy.entry("Buy", strategy.long)

if (sellCondition)
    strategy.close("Buy")
- Strategi Bollinger Bands mengambil keuntungan dinamik
- Bollinger Bands Standard Deviation Breakout Strategi
- Dual Timeframe Momentum Strategi
- Band Mobo
- Indikator Momentum Squeeze
- Strategi Bollinger Bands Stochastic Oscillator
- Nik Stoch
- TMA Overlay
- Strategi Stop Loss dan Ambil Keuntungan Bollinger Bands yang dinamik
- Strategi pengesahan silang purata bergerak berganda dengan Model Pengoptimuman Integrasi Volume-Harga
- Trend silang purata bergerak berganda mengikut strategi dengan sistem Stop-Loss dan Take-Profit dinamik
- Sistem Dagangan Mengikut Trend Multi-Timeframe dengan Integrasi ATR dan MACD
- Strategi Perdagangan Pintar RSI Supertrend Jangka Masa Berganda
- Dual MACD Price Action Breakout Trailing Strategi
- Multi-EMA Trend Momentum Recognition dan Sistem Dagangan Stop-Loss
- Strategi Pengesahan Trend Volume Dual EMA untuk Perdagangan Kuantitatif
- Strategi silang EMA-RSI berganda dengan mengambil keuntungan dinamik/berhenti kerugian
- Peningkatan Trend Penyesuaian Dinamik Berbilang Tempoh Berikutan Sistem Dagangan
- Strategi Dagangan Dua Arah Penembusan Volatiliti Besar: Sistem Masuk Sempadan Berasaskan Titik
- Strategi Kuantitatif Pembalikan Rata-rata Bollinger yang Ditingkatkan
- Strategi Dagangan Kuantitatif EMA Crossover Dinamis Take-Profit Stop-Loss
- Trend Crossover Multi-EMA Mengikut Strategi dengan Peningkatan Stop-Loss dan Take-Profit yang Dinamik
- Strategi crossover purata bergerak berganda dengan pengurusan risiko dinamik
- Strategi penyeimbangan pegangan dua platform
- Pertukaran purata bergerak berganda dengan strategi pengurusan risiko dinamik
- Mengambil kekuatan trend Multi-MA dengan strategi mengambil keuntungan momentum
- Sistem Dagangan Berpeluang Berpeluang
- Rata-rata Bergerak Berbilang Tahap dengan Sistem Dagangan Pengiktirafan Pola Candlestick
- Strategi Dagangan EMA Trend Momentum Multi-Timeframe
- Strategi Dagangan Berimbang Berasaskan Masa Berputar Pendek dan Lama