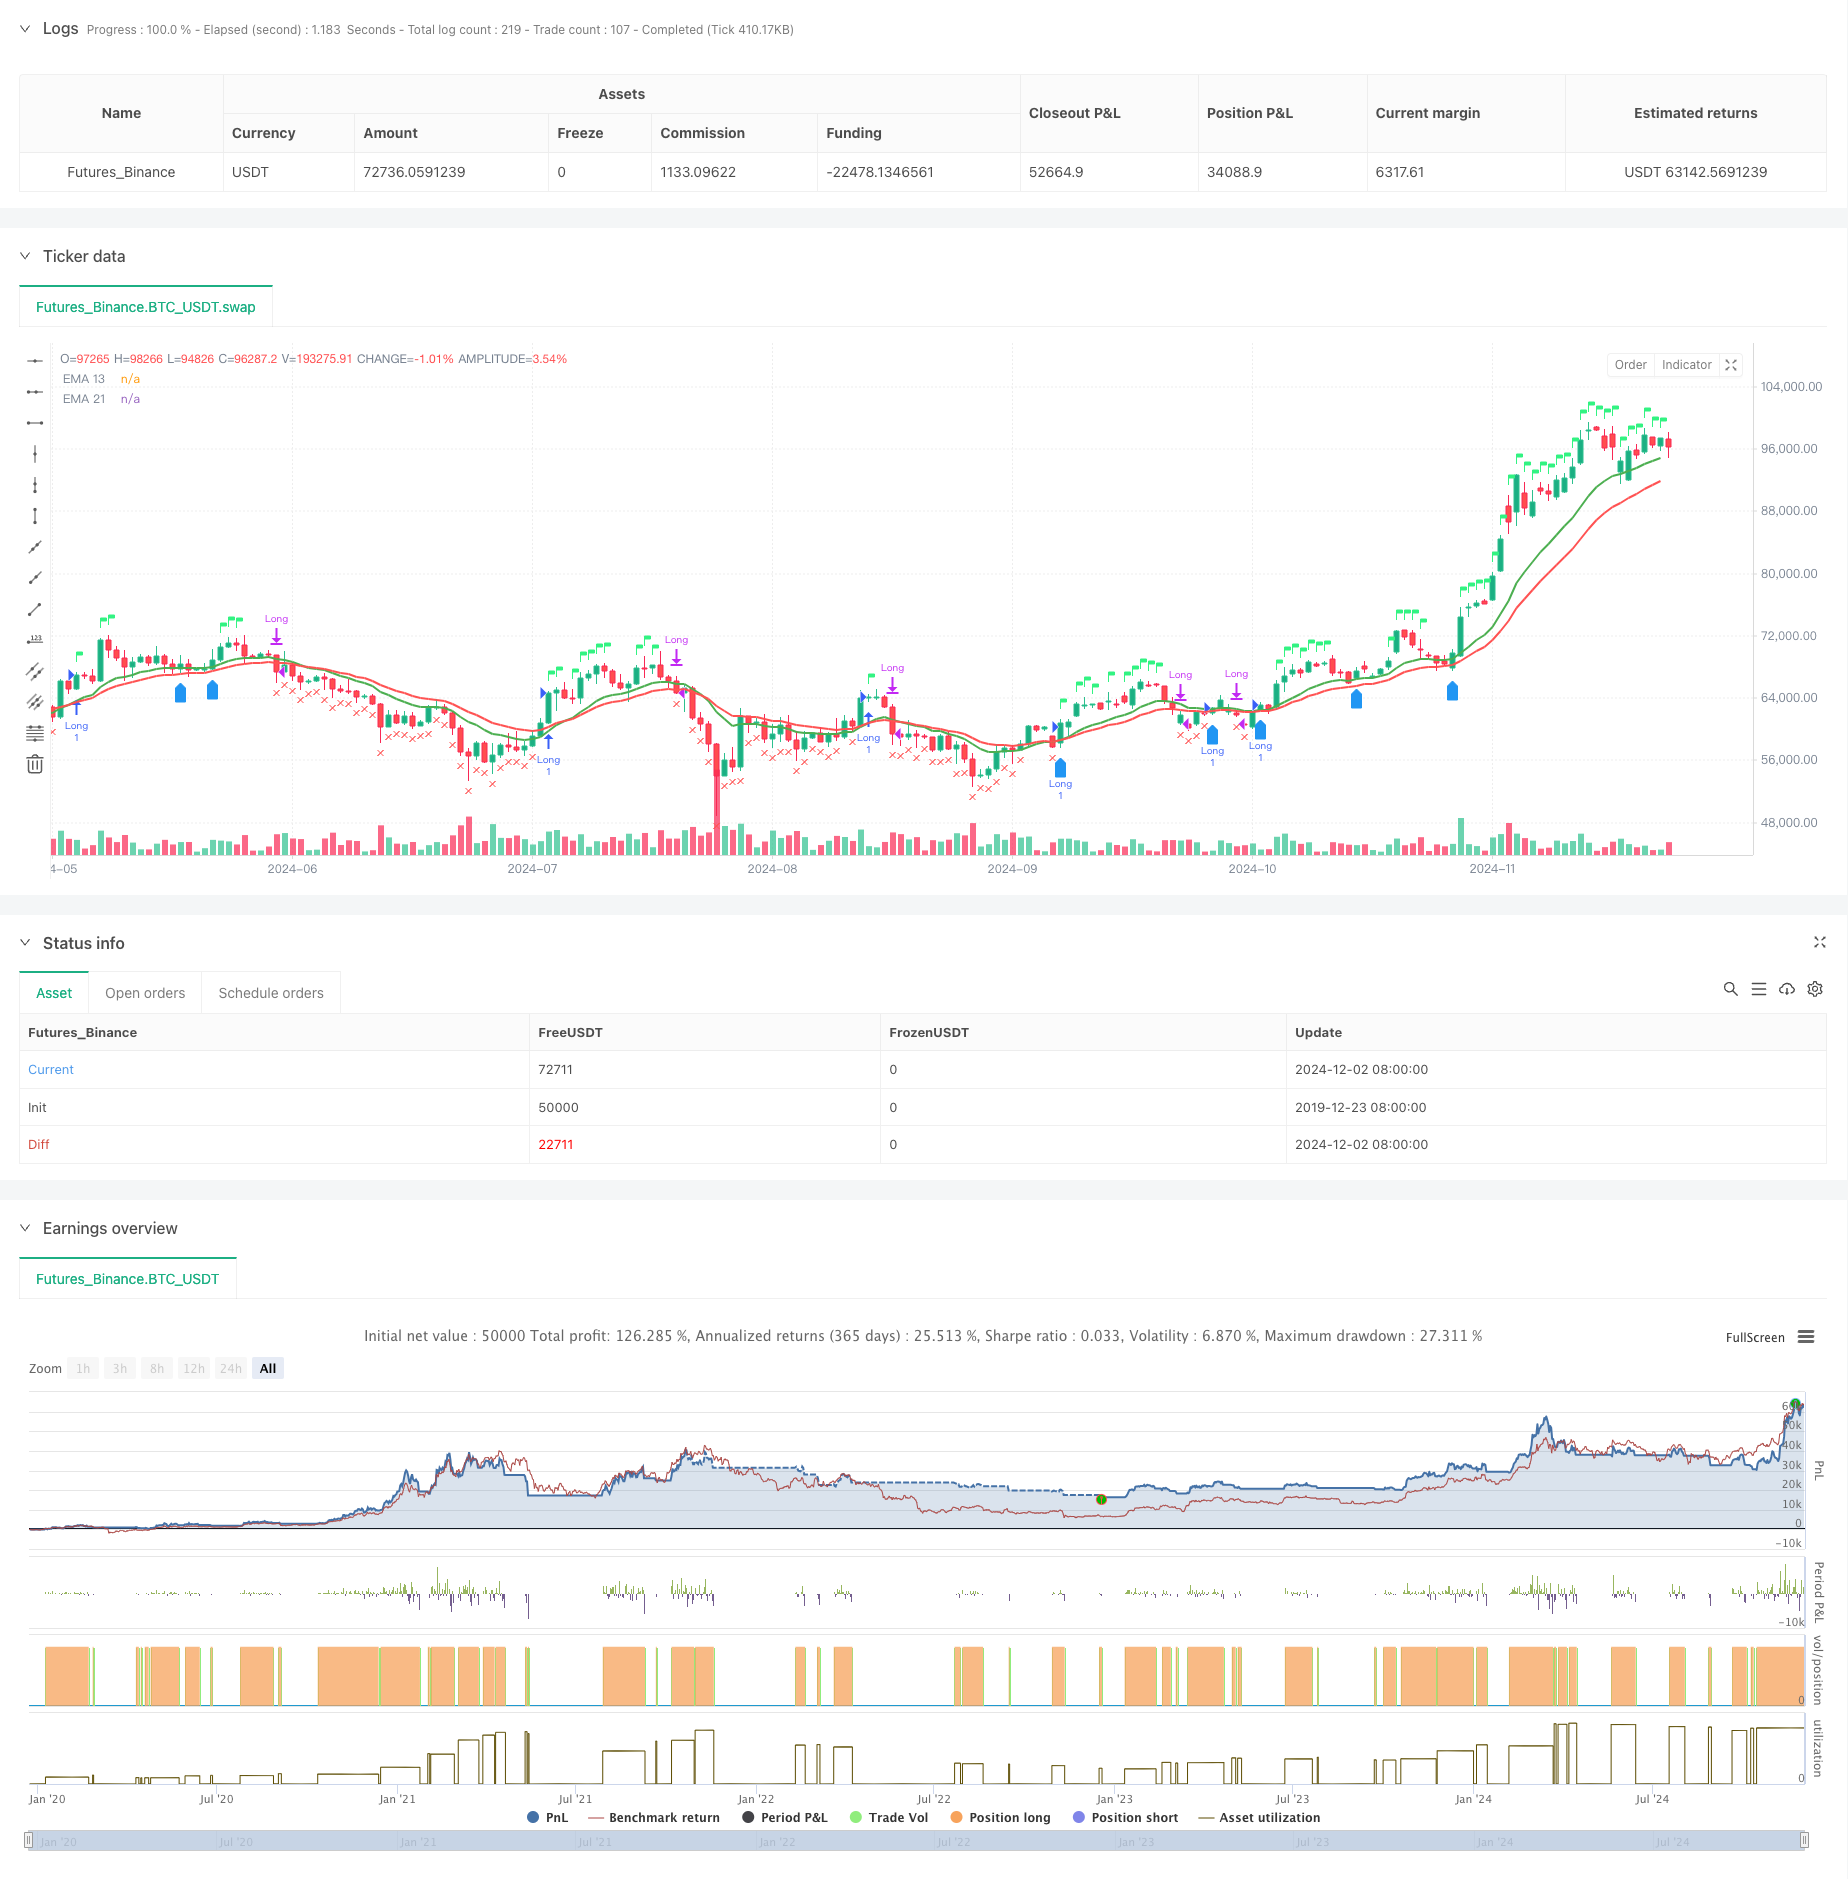
Обзор
Стратегия представляет собой комплексную торговую систему, объединяющую систему двойной равнолинейной системы, анализ относительно сильных и слабых индикаторов (RSI) и относительной силы (RS). Стратегия реализует многомерный механизм принятия решений по торговле, подтверждая тенденции через перекрестное подтверждение 13-го и 21-го индексов сдвигающейся средней (EMA), а также подтверждение торговых сигналов в сочетании с RSI и RS-значениями по отношению к базовым индексам. Стратегия также включает в себя механизм контроля риска и заключения на основе 52-недельных максимумов и условий повторного входа в рынок.
Стратегический принцип
Стратегия использует множественный механизм подтверждения сигналов:
- Входящий сигнал должен одновременно удовлетворять следующим условиям:
- EMA13 носить EMA21 или цена выше EMA13
- RSI больше 60
- Относительная интенсивность ((RS) является положительной
- Условия для выхода включают в себя:
- Цены упали ниже EMA21
- RSI ниже 50
- RS превращается в отрицательный
- Условия для повторного поступления:
- Цены на EMA13 и EMA13 больше, чем EMA21
- RS остается нулевым
- Или цена превзошла рекорд прошлой недели
Стратегические преимущества
- Механизм подтверждения множественных сигналов снижает риск ложного взлома
- Эффективный отбор сильных сортов в сочетании с анализом относительной силы
- Применение адаптивных механизмов коррекции временных циклов
- Система управления рисками
- Интеллектуальные механизмы повторного поступления
- Предоставление визуализации состояния торгов в реальном времени
Стратегический риск
- На рынке могут появиться “частые” сделки
- Задержка сигнала может быть вызвана зависимостью от множества показателей.
- Фиксированный RSI может не подходить для всех рыночных условий.
- Относительная интенсивность зависит от точности расчета базового индекса
- 52-недельная остановка может быть слишком мягкой
Направление оптимизации стратегии
- Введение адаптированного порога RSI
- Оптимизация логики рецензирования условий повторного поступления
- Повышение объема анализа
- Улучшить механизм стоп-профита и стоп-лосса
- Добавление фильтра частоты колебаний
- Оптимизация циклов вычисления относительной интенсивности
Подвести итог
Стратегия, объединенная с техническим анализом и анализом относительной интенсивности, создает целостную торговую систему. Ее многочисленные механизмы подтверждения сигналов и система управления рисками делают ее более практичной.
/*backtest
start: 2019-12-23 08:00:00
end: 2024-12-03 00:00:00
period: 1d
basePeriod: 1d
exchanges: [{"eid":"Futures_Binance","currency":"BTC_USDT"}]
*/

//@version=5
strategy("EMA 13 & 21 Entry Exit", overlay=true)

// Define the EMAs
ema13 = ta.ema(close, 13)
ema21 = ta.ema(close, 21)

// Define the RSI
rsi = ta.rsi(close, 14)

// Calculate the closing price relative to Nifty 50
//nifty50 = request.security("NSE:NIFTY", timeframe.period, close)
//closeRelative = close / nifty50

// Define a base period (e.g., 123) and adjust it based on the timeframe
//basePeriod = 123

// Calculate the effective period based on the timeframe
//effectivePeriod = basePeriod * (timeframe.isintraday ? (60 / timeframe.multiplier) : 1)

// Calculate the EMA
//rs = ta.ema(closeRelative, effectivePeriod)

// Define the Relative Strength with respect to NIFTY 50
nifty50 = request.security("swap", "D", close)
rs = ta.ema(close / nifty50, 55 )

// Define the previous 2-week low and last week's high
twoWeekLow = ta.lowest(low, 10)  // 10 trading days roughly equal to 2 weeks
lastWeekHigh = ta.highest(high, 5)  // 5 trading days roughly equal to 1 week
fiftytwoWeekhigh = ta.highest(high, 52*5) // 252 tradingdays roughly equal to 52 week.

// Long condition: EMA 21 crossing above EMA 55, price above EMA 21, RSI > 50, and RS > 0
longCondition = ta.crossover(ema13, ema21) or close > ema13 and rsi > 60 and rs > 0

// Exit condition: Price closing below EMA 55 or below the previous 2-week low
exitCondition = close < ema21 or rsi < 50 or rs < 0 //or close < fiftytwoWeekhigh*0.80

// Re-entry condition: Price crossing above EMA 21 after an exit, EMA 21 > EMA 55, and RS > 1
reEntryCondition = ta.crossover(close, ema13) and ema13 > ema21 and rs > 0

// Re-entry condition if trailing stop loss is hit: Price crossing above last week's high
reEntryAfterSL = ta.crossover(close, lastWeekHigh)

// Plot the EMAs
plot(ema13 ,color=color.green, title="EMA 13",linewidth = 2)
plot(ema21, color=color.red, title="EMA 21",linewidth = 2)


// Plot buy and sell signals
plotshape(series=longCondition, location=location.abovebar, color=color.rgb(50, 243, 130), style=shape.flag, title="Buy Signal")
plotshape(series=exitCondition, location=location.belowbar, color=color.red, style=shape.xcross, title="Sell Signal")
plotshape(series=reEntryCondition or reEntryAfterSL, location=location.belowbar, color=color.blue, style=shape.labelup, title="Re-entry Signal")
//plotshape(series = fiftytwoWeekhigh,location=location.abovebar, color=color.blue,style=shape.flag, title="52WH")

// Plot background color for RS > 0
//bgcolor(rs > 0 ? color.new(color.green, 90) : na, title="RS Positive Background")
// Plot the previous 2-week low and last week's high
// plot(twoWeekLow, color=color.orange, title="2-Week Low")
// plot(lastWeekHigh, color=color.purple, title="Last Week High")

// Strategy logic
if (longCondition or reEntryCondition or reEntryAfterSL)
    strategy.entry("Long", strategy.long)

if (exitCondition)
    strategy.close("Long")

 // Calculate Stop Loss (SL) and Profit
var float entryPrice = na
var float stopLoss = na
var float profit = na

if (strategy.opentrades > 0)
    entryPrice := strategy.opentrades.entry_price(strategy.opentrades - 1)
    stopLoss := fiftytwoWeekhigh * 0.80
    profit := (close - entryPrice) / entryPrice * 100

// Display the strategy table
var table strategyTable = table.new(position.top_right, 4, 2, border_width = 1)

// Make the table movable
tableX = input.int(0, title="Table X Position")
tableY = input.int(0, title="Table Y Position")

// Add size options for the table
tableSize = input.string("small", title="Table Size", options=["tiny", "small", "large"])

// Adjust table size based on user input
tableWidth = tableSize == "tiny" ? 2 : tableSize == "small" ? 4 : 6
tableHeight = tableSize == "tiny" ? 1 : tableSize == "small" ? 2 : 3

// Create the table with the specified size
//table = table.new(position.top_right, tableWidth, tableHeight, border_width = 1)

// Position the table based on user input
// table.cell(strategyTable, tableX, tableY, "Entry Price",  bgcolor=#18eef9)
// table.cell(strategyTable, tableX, tableY + 1, str.tostring(entryPrice, format.mintick), bgcolor=#18eef9)
// table.cell(strategyTable, tableX + 1, tableY, "Stop Loss (20%)", bgcolor=color.red)
// table.cell(strategyTable, tableX + 1, tableY + 1, str.tostring(stopLoss, format.mintick), bgcolor=color.red)
// table.cell(strategyTable, tableX + 2, tableY, "Profit (%)", bgcolor=color.green)
// table.cell(strategyTable, tableX + 2, tableY + 1, str.tostring(profit, format.percent), bgcolor=color.green)