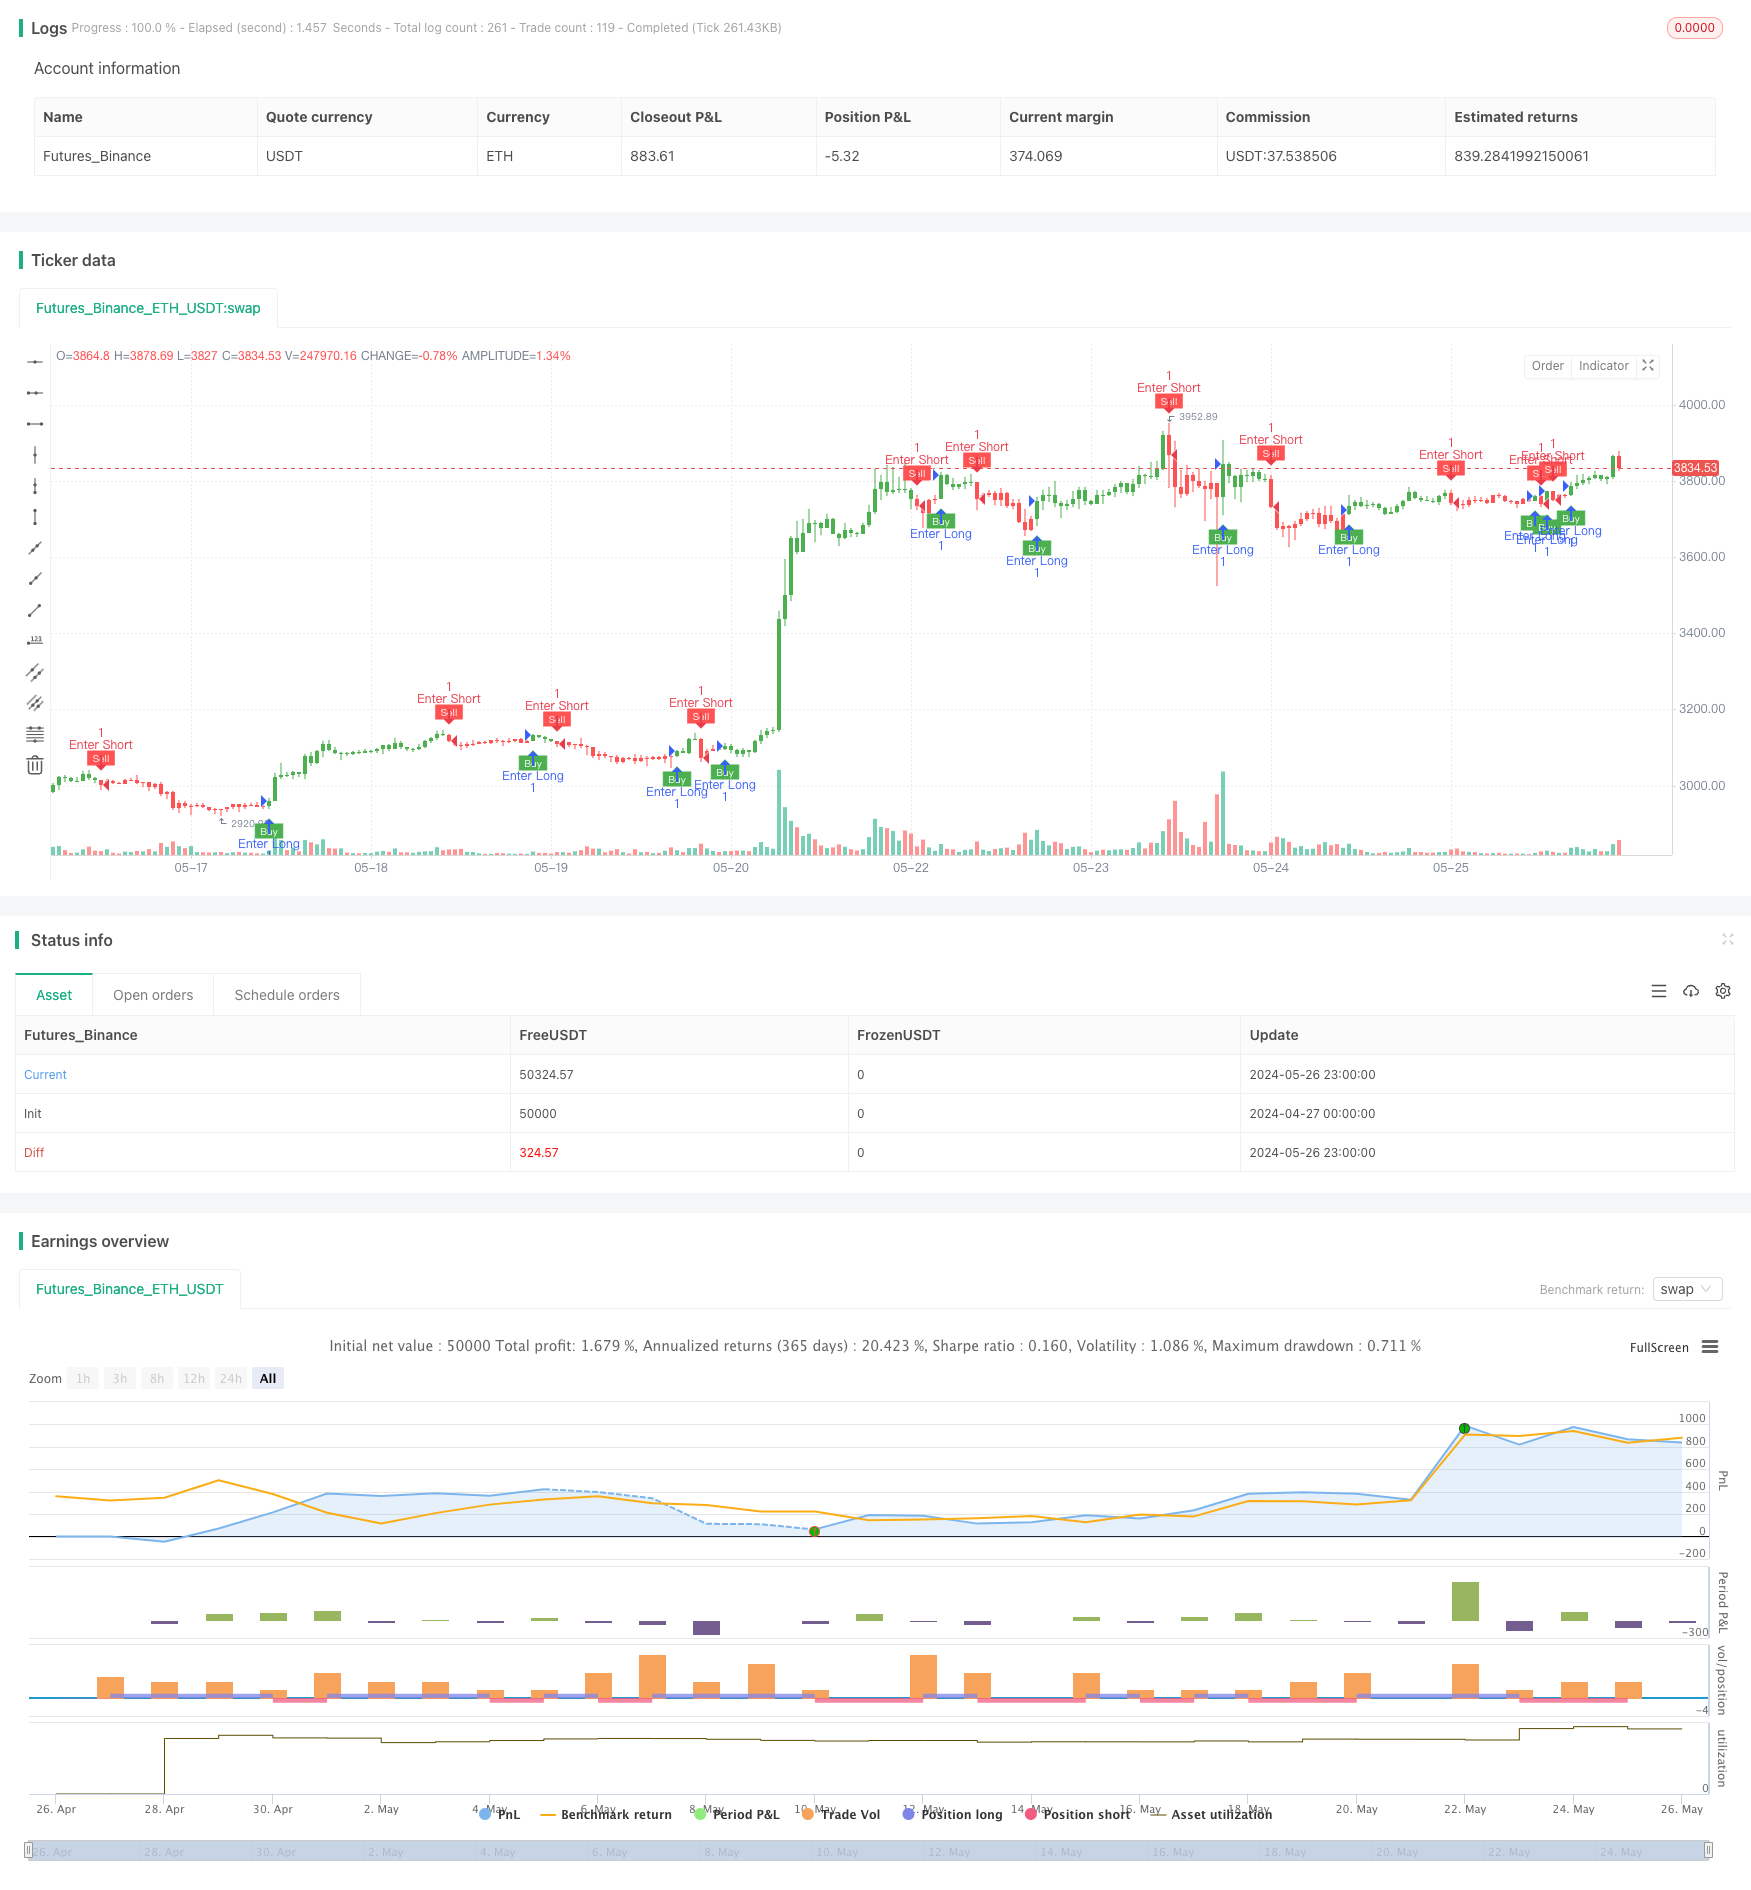
Tổng quan
Chiến lược này sử dụng hai chỉ số ATR (trung bình sóng thực) và EMA (trung bình di chuyển chỉ số) để thích ứng với sự biến động của thị trường bằng cách điều chỉnh động điểm dừng lỗ. Ý tưởng chính của chiến lược là: Sử dụng chỉ số ATR để đo lường tỷ lệ biến động của thị trường và thiết lập điểm dừng lỗ theo kích thước của tỷ lệ biến động; đồng thời sử dụng chỉ số EMA để xác định hướng giao dịch, mở nhiều lệnh khi giá vượt qua EMA lên và mở đơn trống khi EMA phá vỡ.
Nguyên tắc chiến lược
- Tính toán chỉ số ATR để đo lường mức độ biến động của thị trường.
- Tính toán điểm dừng động dựa trên giá trị của ATR và tham số nhân của đầu vào.
- Sử dụng chỉ số EMA như một điều kiện lọc, đặt lệnh nhiều khi giá vượt qua EMA lên và đặt lệnh trống khi giá vượt qua EMA xuống.
- Khi giữ vị thế, liên tục điều chỉnh vị trí dừng lỗ theo sự thay đổi của giá và điểm dừng lỗ động.
- Khi giá chạm điểm dừng động, bạn sẽ đóng và mở lại vị trí.
Lợi thế chiến lược
- Khả năng thích ứng: Bằng cách điều chỉnh động điểm dừng lỗ, chiến lược có thể thích ứng với sự biến động của tỷ lệ biến động trong các tình trạng thị trường khác nhau, kiểm soát rủi ro.
- Khả năng theo dõi xu hướng mạnh mẽ: Sử dụng chỉ số EMA để đánh giá hướng giao dịch, có thể nắm bắt được xu hướng thị trường hiệu quả.
- Các tham số có thể điều chỉnh: Bạn có thể kiểm soát rủi ro và lợi nhuận của chiến lược một cách linh hoạt bằng cách điều chỉnh các tham số chu kỳ và nhân của ATR.
Rủi ro chiến lược
- Rủi ro thiết lập tham số: Thiết lập tham số ATR và tham số nhân có thể ảnh hưởng trực tiếp đến hiệu suất của chiến lược, thiết lập tham số không chính xác có thể dẫn đến thất bại của chiến lược.
- Rủi ro của thị trường chấn động: Trong thị trường chấn động, việc mở cửa thường xuyên có thể dẫn đến điểm trượt lớn và mất phí xử lý.
- Rủi ro đảo chiều xu hướng: Chiến lược có thể gây ra tổn thất liên tục khi xu hướng thị trường đảo ngược.
Hướng tối ưu hóa chiến lược
- Thêm nhiều chỉ số kỹ thuật, như MACD, RSI, để cải thiện tính chính xác của xu hướng.
- Tối ưu hóa các phương pháp tính toán điểm dừng lỗ, chẳng hạn như giới thiệu các phương pháp dừng di động, dừng tỷ lệ động.
- Tối ưu hóa các tham số, tìm ra các tổ hợp tham số ATR chu kỳ và nhân tốt nhất, tăng sự ổn định và lợi nhuận của chiến lược.
- Thêm mô-đun quản lý vị trí, điều chỉnh kích thước vị trí theo biến động của thị trường và mức độ rủi ro của tài khoản.
Tóm tắt
Chiến lược này sử dụng hai chỉ số ATR và EMA để thích ứng với sự biến động của thị trường bằng cách điều chỉnh động điểm dừng lỗ, đồng thời sử dụng chỉ số EMA để đánh giá hướng giao dịch. Chiến lược có khả năng thích ứng và theo dõi xu hướng mạnh mẽ, nhưng có thể gặp phải một số rủi ro khi đặt tham số, biến động thị trường và biến đổi xu hướng. Trong tương lai, có thể nâng cao hiệu suất của chiến lược bằng cách giới thiệu nhiều chỉ số kỹ thuật, tối ưu hóa thuật toán dừng lỗ, tối ưu hóa tham số và thêm các phương thức quản lý vị trí.
/*backtest
start: 2024-04-27 00:00:00
end: 2024-05-27 00:00:00
period: 1h
basePeriod: 15m
exchanges: [{"eid":"Futures_Binance","currency":"ETH_USDT"}]
*/

//@version=5
strategy(title='UT MB&SS Bot', overlay=true)

// Inputs
a = input(1, title='Key Value. \'This changes the sensitivity\'')
c = input(10, title='ATR Period')
h = input(false, title='Signals from Heikin Ashi Candles')
stoploss = input(2.0, title='Stop Loss (ATR Multiples)')

xATR = ta.atr(c)
nLoss = a * xATR

src = h ? request.security(ticker.heikinashi(syminfo.tickerid), timeframe.period, close, lookahead=barmerge.lookahead_off) : close

var xATR_trailing_stop = 0.0
iff_1 = src > nz(xATR_trailing_stop[1], 0) ? src - nLoss : src + nLoss
iff_2 = src < nz(xATR_trailing_stop[1], 0) and src[1] < nz(xATR_trailing_stop[1], 0) ? math.min(nz(xATR_trailing_stop[1]), src + nLoss) : iff_1
xATR_trailing_stop := src > nz(xATR_trailing_stop[1], 0) and src[1] > nz(xATR_trailing_stop[1], 0) ? math.max(nz(xATR_trailing_stop[1]), src - nLoss) : iff_2

pos = 0
iff_3 = src[1] > nz(xATR_trailing_stop[1], 0) and src < nz(xATR_trailing_stop[1], 0) ? -1 : nz(pos[1], 0)
pos := src[1] < nz(xATR_trailing_stop[1], 0) and src > nz(xATR_trailing_stop[1], 0) ? 1 : iff_3

xcolor = pos == -1 ? color.red : pos == 1 ? color.green : color.blue

ema = ta.ema(src, 1)
above = ta.crossover(ema, xATR_trailing_stop)
below = ta.crossover(xATR_trailing_stop, ema)

buy = src > xATR_trailing_stop and above
sell = src < xATR_trailing_stop and below

barbuy = src > xATR_trailing_stop
barsell = src < xATR_trailing_stop

plotshape(buy, title='Buy', text='Buy', style=shape.labelup, location=location.belowbar, color=color.new(color.green, 0), textcolor=color.new(color.white, 0), size=size.tiny)
plotshape(sell, title='Sell', text='Sell', style=shape.labeldown, location=location.abovebar, color=color.new(color.red, 0), textcolor=color.new(color.white, 0), size=size.tiny)

barcolor(barbuy ? color.green : na)
barcolor(barsell ? color.red : na)

stop_level = pos == 1 ? xATR_trailing_stop - stoploss * xATR : xATR_trailing_stop + stoploss * xATR
stop_level := math.max(stop_level, nz(stop_level[1]))

if pos == 1
    strategy.exit('Exit Long', 'UT Long', stop=stop_level)
else if pos == -1
    strategy.exit('Exit Short', 'UT Short', stop=stop_level)


if buy
    strategy.entry("Enter Long", strategy.long)
else if sell
    strategy.entry("Enter Short", strategy.short)