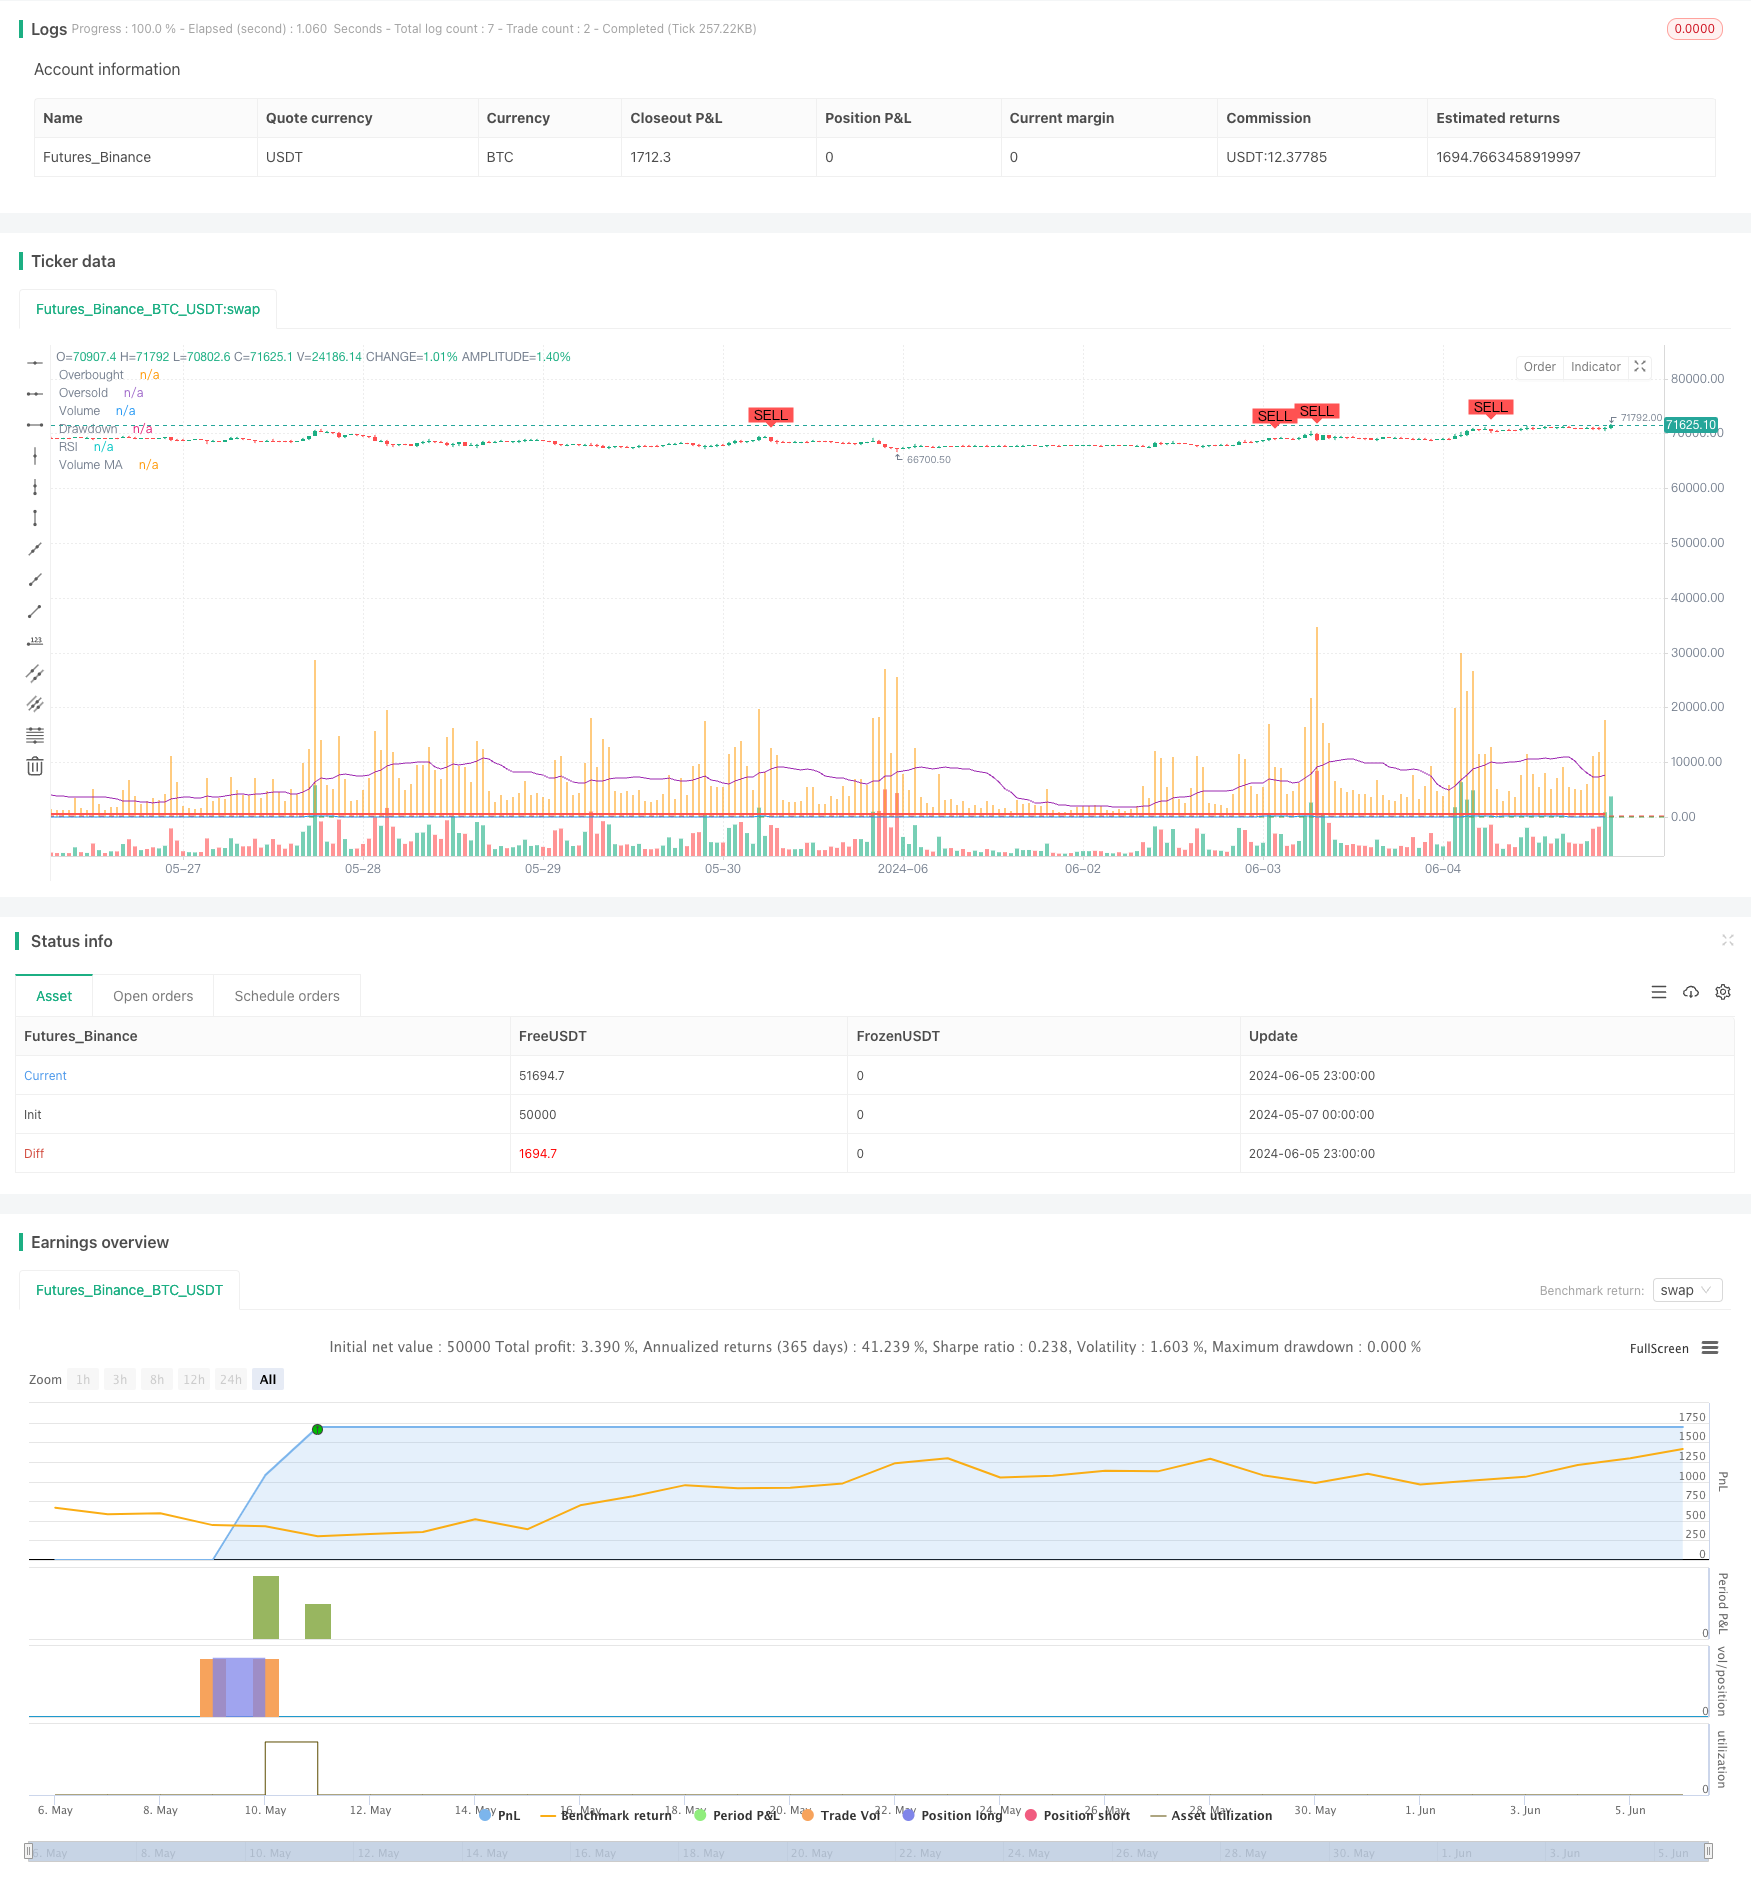
RSI ডায়নামিক ড্রডাউন স্টপ লস কৌশল
লেখক:চাওঝাং, তারিখঃ 2024-06-07 15:47:51ট্যাগঃআরএসআইএমএ

সারসংক্ষেপ
এই কৌশলটি ওয়াইকফ পদ্ধতির উপর ভিত্তি করে, যা বাজারের জমে ও বিতরণ পর্যায়ে চিহ্নিত করার জন্য আপেক্ষিক শক্তি সূচক (আরএসআই) এবং ভলিউম মুভিং গড় (ভলিউম এমএ) একত্রিত করে, ক্রয় এবং বিক্রয় সংকেত তৈরি করে। উপরন্তু, কৌশলটি সর্বাধিক ড্রডাউন থ্রেশহোল্ড সেট করে ঝুঁকি নিয়ন্ত্রণের জন্য একটি গতিশীল ড্রডাউন স্টপ-লস প্রক্রিয়া ব্যবহার করে।
কৌশল নীতি
- RSI সূচক এবং ভলিউম মুভিং গড় গণনা করুন।
- যখন আরএসআই ওভারসোল্ড এলাকার উপরে অতিক্রম করে এবং ভলিউম এমএ-র চেয়ে বেশি হয়, তখন এটি বাজারের জমে থাকা পর্যায়ে চিহ্নিত করে এবং একটি ক্রয় সংকেত তৈরি করে।
- যখন আরএসআই ওভারকুপ এলাকার নিচে অতিক্রম করে এবং ভলিউম এমএ এর চেয়ে বেশি হয়, তখন এটি বাজারের বিতরণ পর্যায়ে সনাক্ত করে এবং বিক্রয় সংকেত তৈরি করে।
- এই কৌশলটি একই সাথে অ্যাকাউন্টের সর্বাধিক মূলধন এবং বর্তমান ড্রডাউন ট্র্যাক করে। যদি বর্তমান ড্রডাউন নির্ধারিত সর্বাধিক ড্রডাউন থ্রেশহোল্ড অতিক্রম করে তবে কৌশলটি সমস্ত অবস্থান বন্ধ করে দেয়।
- ক্রয় পজিশনগুলি বিতরণ পর্যায়ে বা যখন সর্বাধিক উত্তোলন অতিক্রম করে তখন বন্ধ হয়, যখন বিক্রয় পজিশনগুলি জমে থাকা পর্যায়ে বা যখন সর্বাধিক উত্তোলন অতিক্রম করে তখন বন্ধ হয়।
কৌশলগত সুবিধা
- আরএসআই এবং ভলিউম সূচক একত্রিত করে, কৌশলটি বাজারের জমে ও বিতরণ পর্যায়ে আরও সঠিকভাবে ধরা দিতে পারে।
- ডায়নামিক ড্রাউনডাউন স্টপ-লস প্রক্রিয়া কার্যকরভাবে কৌশলটির সর্বাধিক ড্রাউনডাউন নিয়ন্ত্রণ করে, সামগ্রিক কৌশল ঝুঁকি হ্রাস করে।
- ৫ মিনিটের উচ্চ ফ্রিকোয়েন্সি ডেটার জন্য উপযুক্ত, যা বাজারের পরিবর্তনের দ্রুত প্রতিক্রিয়া এবং সময়মত অবস্থানের সমন্বয় করতে সক্ষম করে।
কৌশলগত ঝুঁকি
- RSI এবং ভলিউম সূচকগুলি নির্দিষ্ট বাজারের অবস্থার অধীনে বিভ্রান্তিকর সংকেত তৈরি করতে পারে, যা কৌশল দ্বারা ভুল ট্রেডিং সিদ্ধান্তের দিকে পরিচালিত করে।
- সর্বাধিক ড্রাউন থ্রেশহোল্ডের নির্ধারণকে বাজারের বৈশিষ্ট্য এবং ব্যক্তিগত ঝুঁকি পছন্দ অনুসারে সামঞ্জস্য করা দরকার; অনুপযুক্ত সেটিংগুলি অকাল পজিশন বন্ধ বা অত্যধিক ঝুঁকি গ্রহণের দিকে পরিচালিত করতে পারে।
- কৌশলটি অস্থির বাজারে ঘন ঘন ট্রেডিং সংকেত তৈরি করতে পারে, যা ট্রেডিং খরচ বৃদ্ধি করে।
কৌশল অপ্টিমাইজেশান নির্দেশাবলী
- কৌশলটির সংকেতগুলির নির্ভুলতা উন্নত করার জন্য অন্যান্য প্রযুক্তিগত সূচক যেমন MACD, Bollinger Bands ইত্যাদি প্রবর্তন করার কথা বিবেচনা করুন।
- RSI এবং ভলিউম সূচকগুলির পরামিতিগুলিকে অনুকূলিত করুন, যেমন RSI এর দৈর্ঘ্য, অতিরিক্ত ক্রয় / অতিরিক্ত বিক্রয় প্রান্তিক ইত্যাদি বিভিন্ন বাজারের অবস্থার সাথে খাপ খাইয়ে নেওয়া।
- ড্রাউনডাউন স্টপ-লস ছাড়াও, ঝুঁকি নিয়ন্ত্রণ এবং মুনাফা লক করার জন্য ট্রেলিং স্টপ-লস বা মুনাফা সুরক্ষা প্রক্রিয়া অন্তর্ভুক্ত করুন।
সংক্ষিপ্তসার
আরএসআই ডায়নামিক ড্রাউডাউন স্টপ-লস স্ট্র্যাটেজি ঝুঁকি নিয়ন্ত্রণের জন্য একটি গতিশীল ড্রাউডাউন স্টপ-লস প্রক্রিয়া ব্যবহার করার সময় আরএসআই এবং ভলিউম সূচকগুলির সংমিশ্রণ করে বাজারের জমে ও বিতরণ পর্যায়ে সনাক্ত করে। কৌশলটি বাজার প্রবণতা এবং ঝুঁকি ব্যবস্থাপনা উভয়কেই বিবেচনা করে, এটি কিছুটা কার্যকর করে তোলে। তবে, কৌশলটির পারফরম্যান্স সূচক পরামিতি এবং বাজারের বৈশিষ্ট্যগুলির পছন্দের উপর নির্ভর করে, এর স্থায়িত্ব এবং লাভজনকতা উন্নত করার জন্য ক্রমাগত অপ্টিমাইজেশন এবং সমন্বয় প্রয়োজন।
/*backtest
start: 2024-05-07 00:00:00
end: 2024-06-06 00:00:00
period: 1h
basePeriod: 15m
exchanges: [{"eid":"Futures_Binance","currency":"BTC_USDT"}]
*/

//@version=5
strategy("Wyckoff Methodology Strategy with Max Drawdown", overlay=true)

// Define input parameters
length = input(14, title="RSI Length")
overbought = input(70, title="RSI Overbought Level")
oversold = input(30, title="RSI Oversold Level")
volume_length = input(20, title="Volume MA Length")
initial_capital = input(10000, title="Initial Capital")
max_drawdown = input(500, title="Max Drawdown")

// Calculate RSI
rsi = ta.rsi(close, length)

// Calculate Volume Moving Average
vol_ma = ta.sma(volume, volume_length)

// Identify Accumulation Phase
accumulation = ta.crossover(rsi, oversold) and volume > vol_ma

// Identify Distribution Phase
distribution = ta.crossunder(rsi, overbought) and volume > vol_ma

// Plot RSI
hline(overbought, "Overbought", color=color.red)
hline(oversold, "Oversold", color=color.green)
plot(rsi, title="RSI", color=color.blue)

// Plot Volume and Volume Moving Average
plot(volume, title="Volume", color=color.orange, style=plot.style_histogram)
plot(vol_ma, title="Volume MA", color=color.purple)

// Variables to track drawdown
var float max_equity = initial_capital
var float drawdown = 0.0

// Update max equity and drawdown
current_equity = strategy.equity
if (current_equity > max_equity)
    max_equity := current_equity
drawdown := max_equity - current_equity

// Generate Buy and Sell Signals
if (accumulation and drawdown < max_drawdown)
    strategy.entry("Buy", strategy.long)
if (distribution and drawdown < max_drawdown)
    strategy.entry("Sell", strategy.short)

// Plot Buy and Sell signals on chart
plotshape(series=accumulation, location=location.belowbar, color=color.green, style=shape.labelup, title="Buy Signal", text="BUY")
plotshape(series=distribution, location=location.abovebar, color=color.red, style=shape.labeldown, title="Sell Signal", text="SELL")

// Close positions if drawdown exceeds max drawdown
if (drawdown >= max_drawdown)
    strategy.close_all("Max Drawdown Exceeded")

// Set strategy exit conditions
strategy.close("Buy", when=distribution or drawdown >= max_drawdown)
strategy.close("Sell", when=accumulation or drawdown >= max_drawdown)

// Display drawdown on chart
plot(drawdown, title="Drawdown", color=color.red, linewidth=2, style=plot.style_stepline)
- সেরা ট্রেডিংভিউ কৌশল
- মাল্টি-কনফার্মেশন বিপরীত ক্রয় কৌশল
- এমএ, এসএএমএ, এমএ ঢাল, ট্রেইলিং স্টপ লস, পুনরায় প্রবেশ
- বোলিংজার ব্যান্ড, চলমান গড় এবং আরএসআই এর উপর ভিত্তি করে স্বল্পমেয়াদী ট্রেডিং কৌশল
- মাল্টি-লেভেল ডায়নামিক ট্রেন্ড অনুসরণ সিস্টেম
- মঙ্গলবারের টার্নআরাউন্ড কৌশল (উইকেন্ড ফিল্টার)
- ডাবল মুভিং এভারেজ আরএসআই ট্রেন্ড ইম্পুটম কৌশল
- ইএমএ এবং ট্রেন্ডলাইন ব্রেকআউটের উপর ভিত্তি করে দ্বৈত চলমান গড় আরএসআই গতি কৌশল
- ডায়নামিক সাপোর্ট-রেসিস্ট্যান্স ব্রেকআউট মুভিং এভারেজ ক্রসওভার কৌশল
- চলমান গড় ফিল্টার কৌশল সহ তিনবার বৈধকৃত আরএসআই গড় বিপরীত
- বিবি ব্রেকআউট কৌশল
- ভিডাব্লুএপি এবং আরএসআই ডায়নামিক বোলিংজার ব্যান্ডস লাভ এবং স্টপ লস কৌশল গ্রহণ করে
- চ্যান্ডে-ক্রোল স্টপ ডায়নামিক এটিআর ট্রেন্ড স্ট্র্যাটেজি অনুসরণ
- এই কৌশল Chaikin মানি ফ্লো (CMF) এর উপর ভিত্তি করে ট্রেডিং সংকেত উৎপন্ন করে
- ট্রেন্ড ফিল্টারড পিন বার বিপরীত কৌশল
- সমর্থন এবং প্রতিরোধের স্তরে বিপরীতমুখী প্যাটার্নের উপর ভিত্তি করে পরিমাণগত ট্রেডিং কৌশল
- এমএ, এসএএমএ, এমএ ঢাল, ট্রেইলিং স্টপ লস, পুনরায় প্রবেশ
- এসটিআই ক্রসওভার কৌশল
- ইএমএ ডাবল মুভিং এভারেজ ক্রসওভার কৌশল
- উইলিয়ামস %R ডায়নামিক টিপি/এসএল অ্যাডজাস্টমেন্ট স্ট্র্যাটেজি
- ভলিউম অ্যানোমালি সনাক্তকরণের সাথে ভিডাব্লুএপি ট্রেডিং কৌশল
- সুপারট্রেন্ড এবং ইএমএ সংমিশ্রণ কৌশল
- TGT দামের পতনের উপর ভিত্তি করে কিনে নেওয়ার কৌশল
- ইএমএ ক্রসওভার এবং আরএসআই ফিল্টার সহ দ্বৈত প্রবণতা কৌশল
- ইএমএ এবং প্যারাবোলিক এসএআর সংমিশ্রণ কৌশল
- এমএসিডি এবং আরএসআই মাল্টি-ফিল্টার ইনট্রা-ডে ট্রেডিং কৌশল
- দুই বাজারের মধ্যে মূল্য সম্পর্ক ভিত্তিক সালিসি ট্রেডিং কৌশল
- RSI-ভিত্তিক ট্রেডিং স্ট্র্যাটেজি, শতাংশ ভিত্তিক লাভ এবং স্টপ লস
- অপ্টিমাইজড লং ট্রেডিংয়ের জন্য এমএসিডি এবং মার্টিনগেল সংমিশ্রণ কৌশল
- এলিট ওয়েভ স্টোকাস্টিক ইএমএ কৌশল