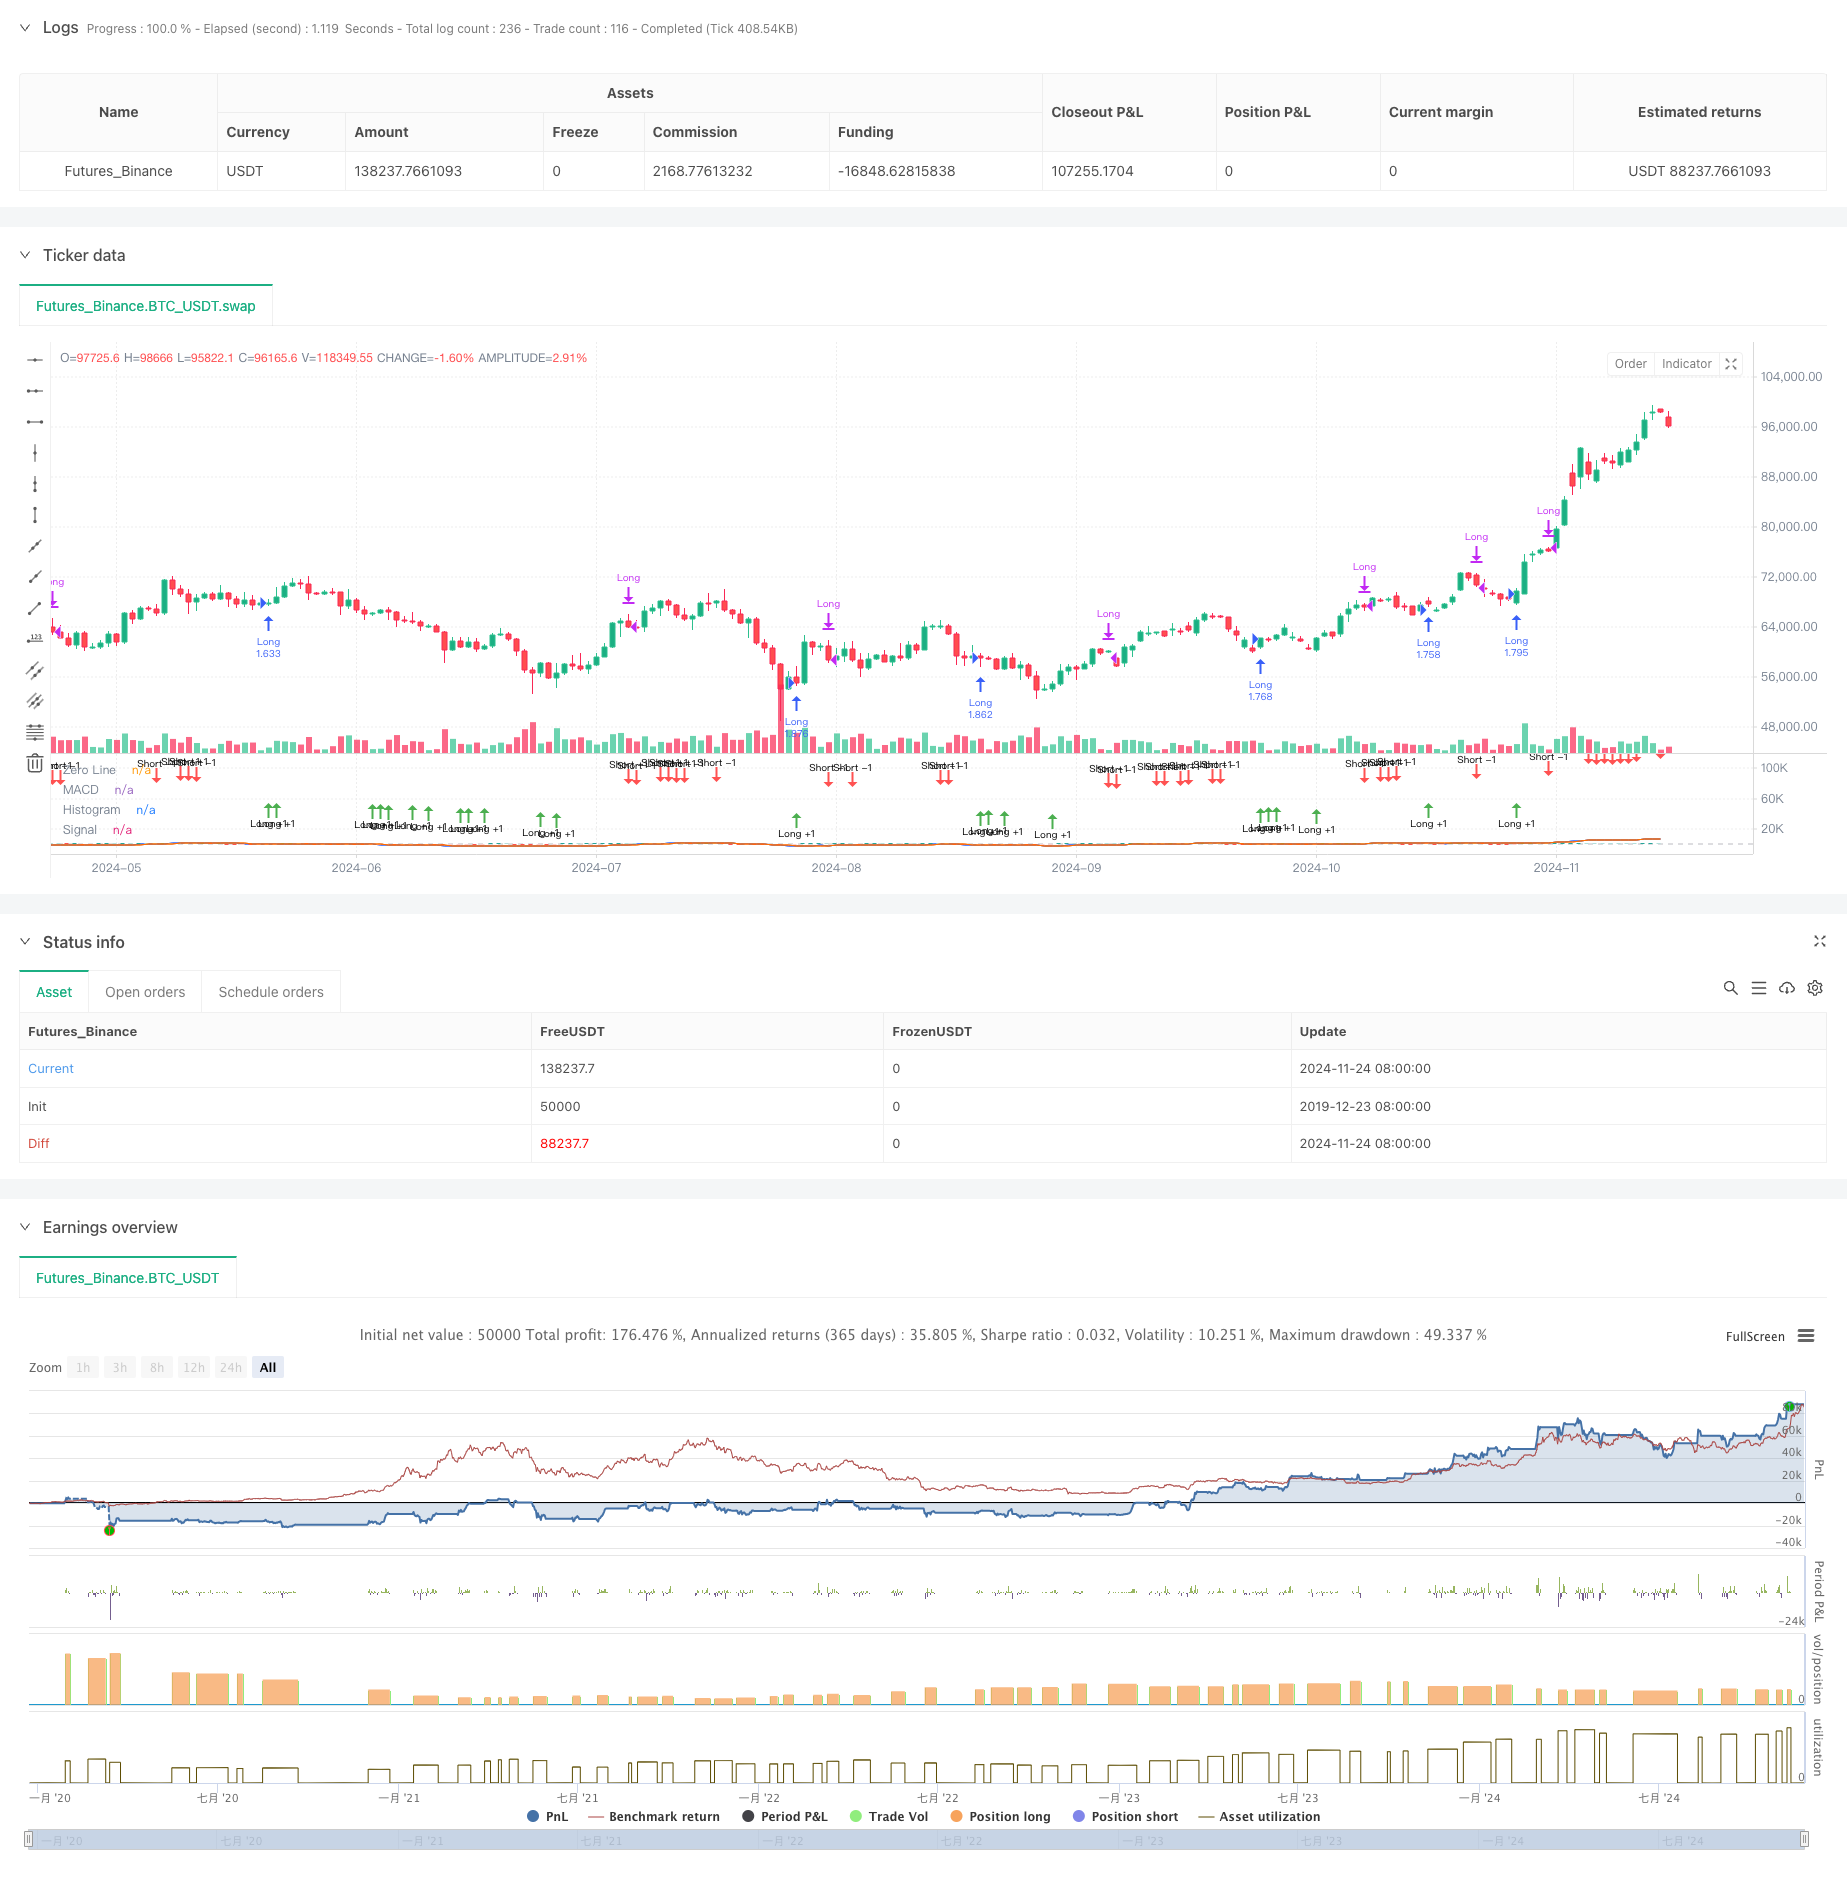
এমএসিডি ডায়নামিক ওসিলেশন ক্রস-প্রাকদর্শন কৌশল
লেখক:চাওঝাং, তারিখঃ ২০২৪-১১-২৭ 14:54:02ট্যাগঃএমএসিডিইএমএএসএমএROC

সারসংক্ষেপ
এই কৌশলটি MACD (মোটিভিং এভারেজ কনভার্জেন্স ডিভার্জেন্স) সূচকের গতিশীল বৈশিষ্ট্যগুলির উপর ভিত্তি করে ট্রেডিং সিদ্ধান্ত গ্রহণ করে। মূল পদ্ধতিটি সম্ভাব্য সোনার এবং মৃত্যুর ক্রসগুলি পূর্বাভাস দেওয়ার জন্য MACD হিস্টোগ্রামের পরিবর্তনগুলি পর্যবেক্ষণের উপর দৃষ্টি নিবদ্ধ করে, যা প্রাথমিক অবস্থানের প্রতিষ্ঠার অনুমতি দেয়। কৌশলটি আরও ভাল প্রবেশের সময় পেতে হিস্টোগ্রামের গতিশীল বৈশিষ্ট্যগুলিতে জোর দিয়ে traditionalতিহ্যবাহী MACD ক্রসওভার সংকেতগুলির বাইরে চলে যায়।
কৌশলগত নীতি
কৌশলটি একটি সংশোধিত এমএসিডি সূচক ব্যবস্থা ব্যবহার করে, দ্রুত (ইএমএ১২) এবং ধীর (ইএমএ২৬) চলমান গড়ের মধ্যে পার্থক্যকে একত্রিত করে, একটি ২-অবধি সংকেত লাইনের সাথে। মূল ট্রেডিং লজিকটি বেশ কয়েকটি মূল পয়েন্টের উপর ভিত্তি করেঃ
- প্রবণতা গতিবিদ্যা বিচার করার জন্য হিস্টোগ্রাম পরিবর্তনের হার (hist_change) গণনা করা
- হিস্টোগ্রাম নেতিবাচক হলে এবং পরপর তিনটি সময়ের জন্য ঊর্ধ্বমুখী প্রবণতা দেখলে লং পজিশনে প্রবেশ করে সোনার ক্রস সংকেত প্রত্যাশা করা
- হিস্টোগ্রামটি ইতিবাচক হলে এবং পরপর তিনটি সময়ের জন্য নেমে যাওয়ার প্রবণতা দেখলে অবস্থান বন্ধ করে মৃত্যুর ক্রস সংকেত প্রত্যাশা করা
- নির্দিষ্ট সময়সীমার মধ্যে ট্রেড করার জন্য একটি সময় ফিল্টারিং প্রক্রিয়া বাস্তবায়ন
কৌশলগত সুবিধা
- শক্তিশালী সংকেত পূর্বাভাসঃ হিস্টোগ্রাম গতিবিদ্যা পর্যবেক্ষণ করে সম্ভাব্য ক্রসওভার সংকেতগুলি প্রত্যাশিত করে, প্রবেশের সময়কাল উন্নত করে
- যুক্তিসঙ্গত ঝুঁকি নিয়ন্ত্রণঃ ০.১% কমিশন এবং ৩ পয়েন্ট স্লিপিং অন্তর্ভুক্ত করে, যা বাস্তবসম্মত ট্রেডিং শর্তকে প্রতিফলিত করে
- নমনীয় মূলধন ব্যবস্থাপনাঃ কার্যকর ঝুঁকি নিয়ন্ত্রণের জন্য অ্যাকাউন্টের মূলধনের তুলনায় শতাংশ ভিত্তিক পজিশন সাইজিং ব্যবহার করে
- চমৎকার ভিজ্যুয়ালাইজেশনঃ ট্রেডিং সিগন্যালের জন্য রঙ-কোডেড হিস্টোগ্রাম এবং তীর চিহ্নিতকারী ব্যবহার করে, বিশ্লেষণ সহজতর করে
কৌশলগত ঝুঁকি
- ভুয়া ব্রেকআউট ঝুঁকিঃ বিভিন্ন বাজারে প্রায়ই মিথ্যা সংকেত আসতে পারে।
- বিলম্ব ঝুঁকিঃ ভবিষ্যদ্বাণীমূলক প্রক্রিয়া সত্ত্বেও, এমএসিডি কিছু অন্তর্নিহিত বিলম্ব বজায় রাখে
- বাজার পরিবেশের উপর নির্ভরশীলতাঃ কৌশলটি ট্রেন্ডিং মার্কেটে ভাল পারফর্ম করে, সম্ভাব্যভাবে বিভিন্ন অবস্থার মধ্যে নিম্নতর পারফর্ম করে
- প্যারামিটার সংবেদনশীলতাঃ কৌশল কর্মক্ষমতা দ্রুত এবং ধীর লাইন সময়কাল সেটিংস উপর অত্যন্ত নির্ভরশীল
অপ্টিমাইজেশান নির্দেশাবলী
- বাজার পরিবেশ ফিল্টারিংঃ বাজারের অবস্থার উপর ভিত্তি করে ট্রেডিং পরামিতিগুলি সামঞ্জস্য করার জন্য প্রবণতা সনাক্তকরণ সূচক যুক্ত করুন
- পজিশন ম্যানেজমেন্টের উন্নতিঃ সিগন্যাল শক্তির উপর ভিত্তি করে গতিশীল অবস্থান আকার বাস্তবায়ন
- স্টপ লস বাস্তবায়নঃ ড্রাউনডাউন নিয়ন্ত্রণে ট্রেলিং বা ফিক্সড স্টপ লস যুক্ত করুন
- সিগন্যাল নিশ্চিতকরণ বাড়ানোঃ ক্রস-ভ্যালিডেশনের জন্য অতিরিক্ত প্রযুক্তিগত সূচক অন্তর্ভুক্ত করা
- প্যারামিটার অপ্টিমাইজেশনঃ বাজারের অবস্থার উপর ভিত্তি করে সামঞ্জস্যপূর্ণ প্যারামিটার বাস্তবায়ন করুন
সংক্ষিপ্তসার
এই কৌশলটি ঐতিহ্যবাহী এমএসিডি ট্রেডিং সিস্টেমগুলির উপর উন্নতি করার জন্য এমএসিডি হিস্টোগ্রামের গতিশীল বৈশিষ্ট্যগুলি উদ্ভাবনীভাবে ব্যবহার করে। ভবিষ্যদ্বাণীমূলক প্রক্রিয়াটি প্রাথমিক প্রবেশ সংকেত সরবরাহ করে, যখন কঠোর ট্রেডিং শর্ত এবং ঝুঁকি নিয়ন্ত্রণ ব্যবস্থা কৌশল স্থিতিশীলতা নিশ্চিত করে। আরও অপ্টিমাইজেশন এবং পরিমার্জন সহ, এই কৌশলটি প্রকৃত ট্রেডিং অবস্থার মধ্যে উন্নত পারফরম্যান্সের প্রতিশ্রুতি দেখায়।
/*backtest
start: 2019-12-23 08:00:00
end: 2024-11-25 08:00:00
period: 1d
basePeriod: 1d
exchanges: [{"eid":"Futures_Binance","currency":"BTC_USDT"}]
*/

//@version=5
strategy(title="Demo GPT - Moving Average Convergence Divergence", shorttitle="MACD", commission_type=strategy.commission.percent, commission_value=0.1, slippage=3, default_qty_type=strategy.percent_of_equity, default_qty_value=100)

// Getting inputs
fast_length = input(title="Fast Length", defval=12)
slow_length = input(title="Slow Length", defval=26)
src = input(title="Source", defval=close)
signal_length = input.int(title="Signal Smoothing", minval=1, maxval=50, defval=2)  // Set smoothing line to 2
sma_source = input.string(title="Oscillator MA Type", defval="EMA", options=["SMA", "EMA"])
sma_signal = input.string(title="Signal Line MA Type", defval="EMA", options=["SMA", "EMA"])

// Date inputs
start_date = input(title="Start Date", defval=timestamp("2018-01-01T00:00:00"))
end_date = input(title="End Date", defval=timestamp("2069-12-31T23:59:59"))

// Calculating
fast_ma = sma_source == "SMA" ? ta.sma(src, fast_length) : ta.ema(src, fast_length)
slow_ma = sma_source == "SMA" ? ta.sma(src, slow_length) : ta.ema(src, slow_length)
macd = fast_ma - slow_ma
signal = sma_signal == "SMA" ? ta.sma(macd, signal_length) : ta.ema(macd, signal_length)
hist = macd - signal

// Strategy logic
isInDateRange = true

// Calculate the rate of change of the histogram
hist_change = hist - hist[1]

// Anticipate a bullish crossover: histogram is negative, increasing, and approaching zero
anticipate_long = isInDateRange and hist < 0 and hist_change > 0 and hist > hist[1] and hist > hist[2]

// Anticipate an exit (bearish crossover): histogram is positive, decreasing, and approaching zero
anticipate_exit = isInDateRange and hist > 0 and hist_change < 0 and hist < hist[1] and hist < hist[2]

if anticipate_long
    strategy.entry("Long", strategy.long)

if anticipate_exit
    strategy.close("Long")

// Plotting
hline(0, "Zero Line", color=color.new(#787B86, 50))
plot(hist, title="Histogram", style=plot.style_columns, color=(hist >= 0 ? (hist > hist[1] ? #26A69A : #B2DFDB) : (hist < hist[1] ? #FF5252 : #FFCDD2)))
plot(macd, title="MACD", color=#2962FF)
plot(signal, title="Signal", color=#FF6D00)

// Plotting arrows when anticipating the crossover
plotshape(anticipate_long, title="Long +1", location=location.belowbar, color=color.green, style=shape.arrowup, size=size.tiny, text="Long +1")
plotshape(anticipate_exit, title="Short -1", location=location.abovebar, color=color.red, style=shape.arrowdown, size=size.tiny, text="Short -1")
- K এর বিপরীত সূচক I
- সিএম এমএসিডি কাস্টম ইন্ডিকেটর - মাল্টিপল টাইম ফ্রেম - ভি২
- ডুয়াল এমএসিডি ট্রেন্ড কনফার্মেশন ট্রেডিং সিস্টেম
- ZeroLag MACD লং শর্ট স্ট্র্যাটেজি
- শূন্য বিলম্ব MACD ডুয়াল ক্রসওভার ট্রেডিং কৌশল - স্বল্পমেয়াদী ট্রেন্ড ক্যাপচারের উপর ভিত্তি করে উচ্চ-ফ্রিকোয়েন্সি ট্রেডিং
- মুভিং এভারেজ ক্রসওভার + এমএসিডি স্লো লাইন মম্পটম স্ট্র্যাটেজি
- MACD Multi-Interval Dynamic Stop-Loss এবং Take-Profit ট্রেডিং সিস্টেম
- অপ্টিমাইজড লং ট্রেডিংয়ের জন্য এমএসিডি এবং মার্টিনগেল সংমিশ্রণ কৌশল
- ডাবল মুভিং এভারেজ এমএসিডি ক্রসওভার তারিখ-সামঞ্জস্যযোগ্য পরিমাণগত ট্রেডিং কৌশল
- এমএসিডি বিবি ব্রেকআউট কৌশল
- ত্রিগুণ চলমান গড় প্রবণতা অনুসরণ এবং গতি একীকরণ পরিমাণগত ট্রেডিং কৌশল
- জেড-স্কোর এবং সুপারট্রেন্ড ভিত্তিক ডায়নামিক ট্রেডিং কৌশলঃ লং-কোর্ট সুইচিং সিস্টেম
- চলমান গড় পরিমাণগত কৌশল সিস্টেমের সাথে অভিযোজিত বোলিংজার ব্রেকআউট
- একাধিক প্রযুক্তিগত সূচক সংহতকরণের সাথে এআই-অপ্টিমাইজড অ্যাডাপ্টিভ স্টপ-লস ট্রেডিং সিস্টেম
- ভলিউম বিশ্লেষণ সিস্টেমের সাথে মাল্টি-পিরিয়ড মুভিং গড় ক্রসওভার
- ডাবল মুভিং গড় গতি ট্র্যাকিং পরিমাণগত কৌশল
- ডাবল মুভিং এভারেজ ক্রসওভার স্ট্র্যাটেজি
- ইম্পোমেন্টাম অ্যাসিললেটর ভিত্তিক কৌশল অনুসরণ করে অভিযোজনমূলক প্রবণতা
- PVT-EMA ট্রেন্ড ক্রসওভার ভলিউম-প্রাইস কৌশল
- MACD-EMA মাল্টি-পিরিয়ড ডায়নামিক ক্রসওভার কোন্টিটেটিভ ট্রেডিং সিস্টেম
- VWAP-ATR ডায়নামিক প্রাইস অ্যাকশন ট্রেডিং সিস্টেম
- বোলিংজার ব্যান্ড এবং আরএসআই ক্রস ভিত্তিক গতিশীল প্রবণতা পরিমাণগত কৌশল
- Bollinger Bands, RSI এবং ATR-ভিত্তিক ডায়নামিক স্টপ-লস সিস্টেমের সাথে গড় বিপরীতমুখী কৌশল
- প্যারাবলিক এসএআর সূচক ভিত্তিক গতিশীল ট্রেডিং কৌশল সিস্টেম
- অ্যাডাপ্টিভ ভোলটাইলিটি অ্যান্ড ইমপুটাম ক্যোন্টিটেটিভ ট্রেডিং সিস্টেম (AVMQTS)
- Bollinger Bands এবং Candlestick Patterns এর উপর ভিত্তি করে উন্নত ট্রেন্ড ট্রেডিং কৌশল
- এটিআর ভোল্টেবিলিটি এবং প্রান্তিক গড়ের উপর ভিত্তি করে অভিযোজনমূলক প্রবণতা
- পূর্ণ শরীরের মোমবাতি সংকেত সিস্টেমের সাথে দ্বৈত ইএমএ গতির ট্রেডিং কৌশল
- আরএসআই অপ্টিমাইজেশন সিস্টেমের সাথে ডুয়াল টাইমফ্রেম সুপারট্রেন্ড
- ডায়নামিক স্টপ-লস এবং টেক-প্রফিট সিস্টেমের সাথে কৌশল অনুসরণ করে ডাবল মুভিং গড় ক্রসওভার ট্রেন্ড