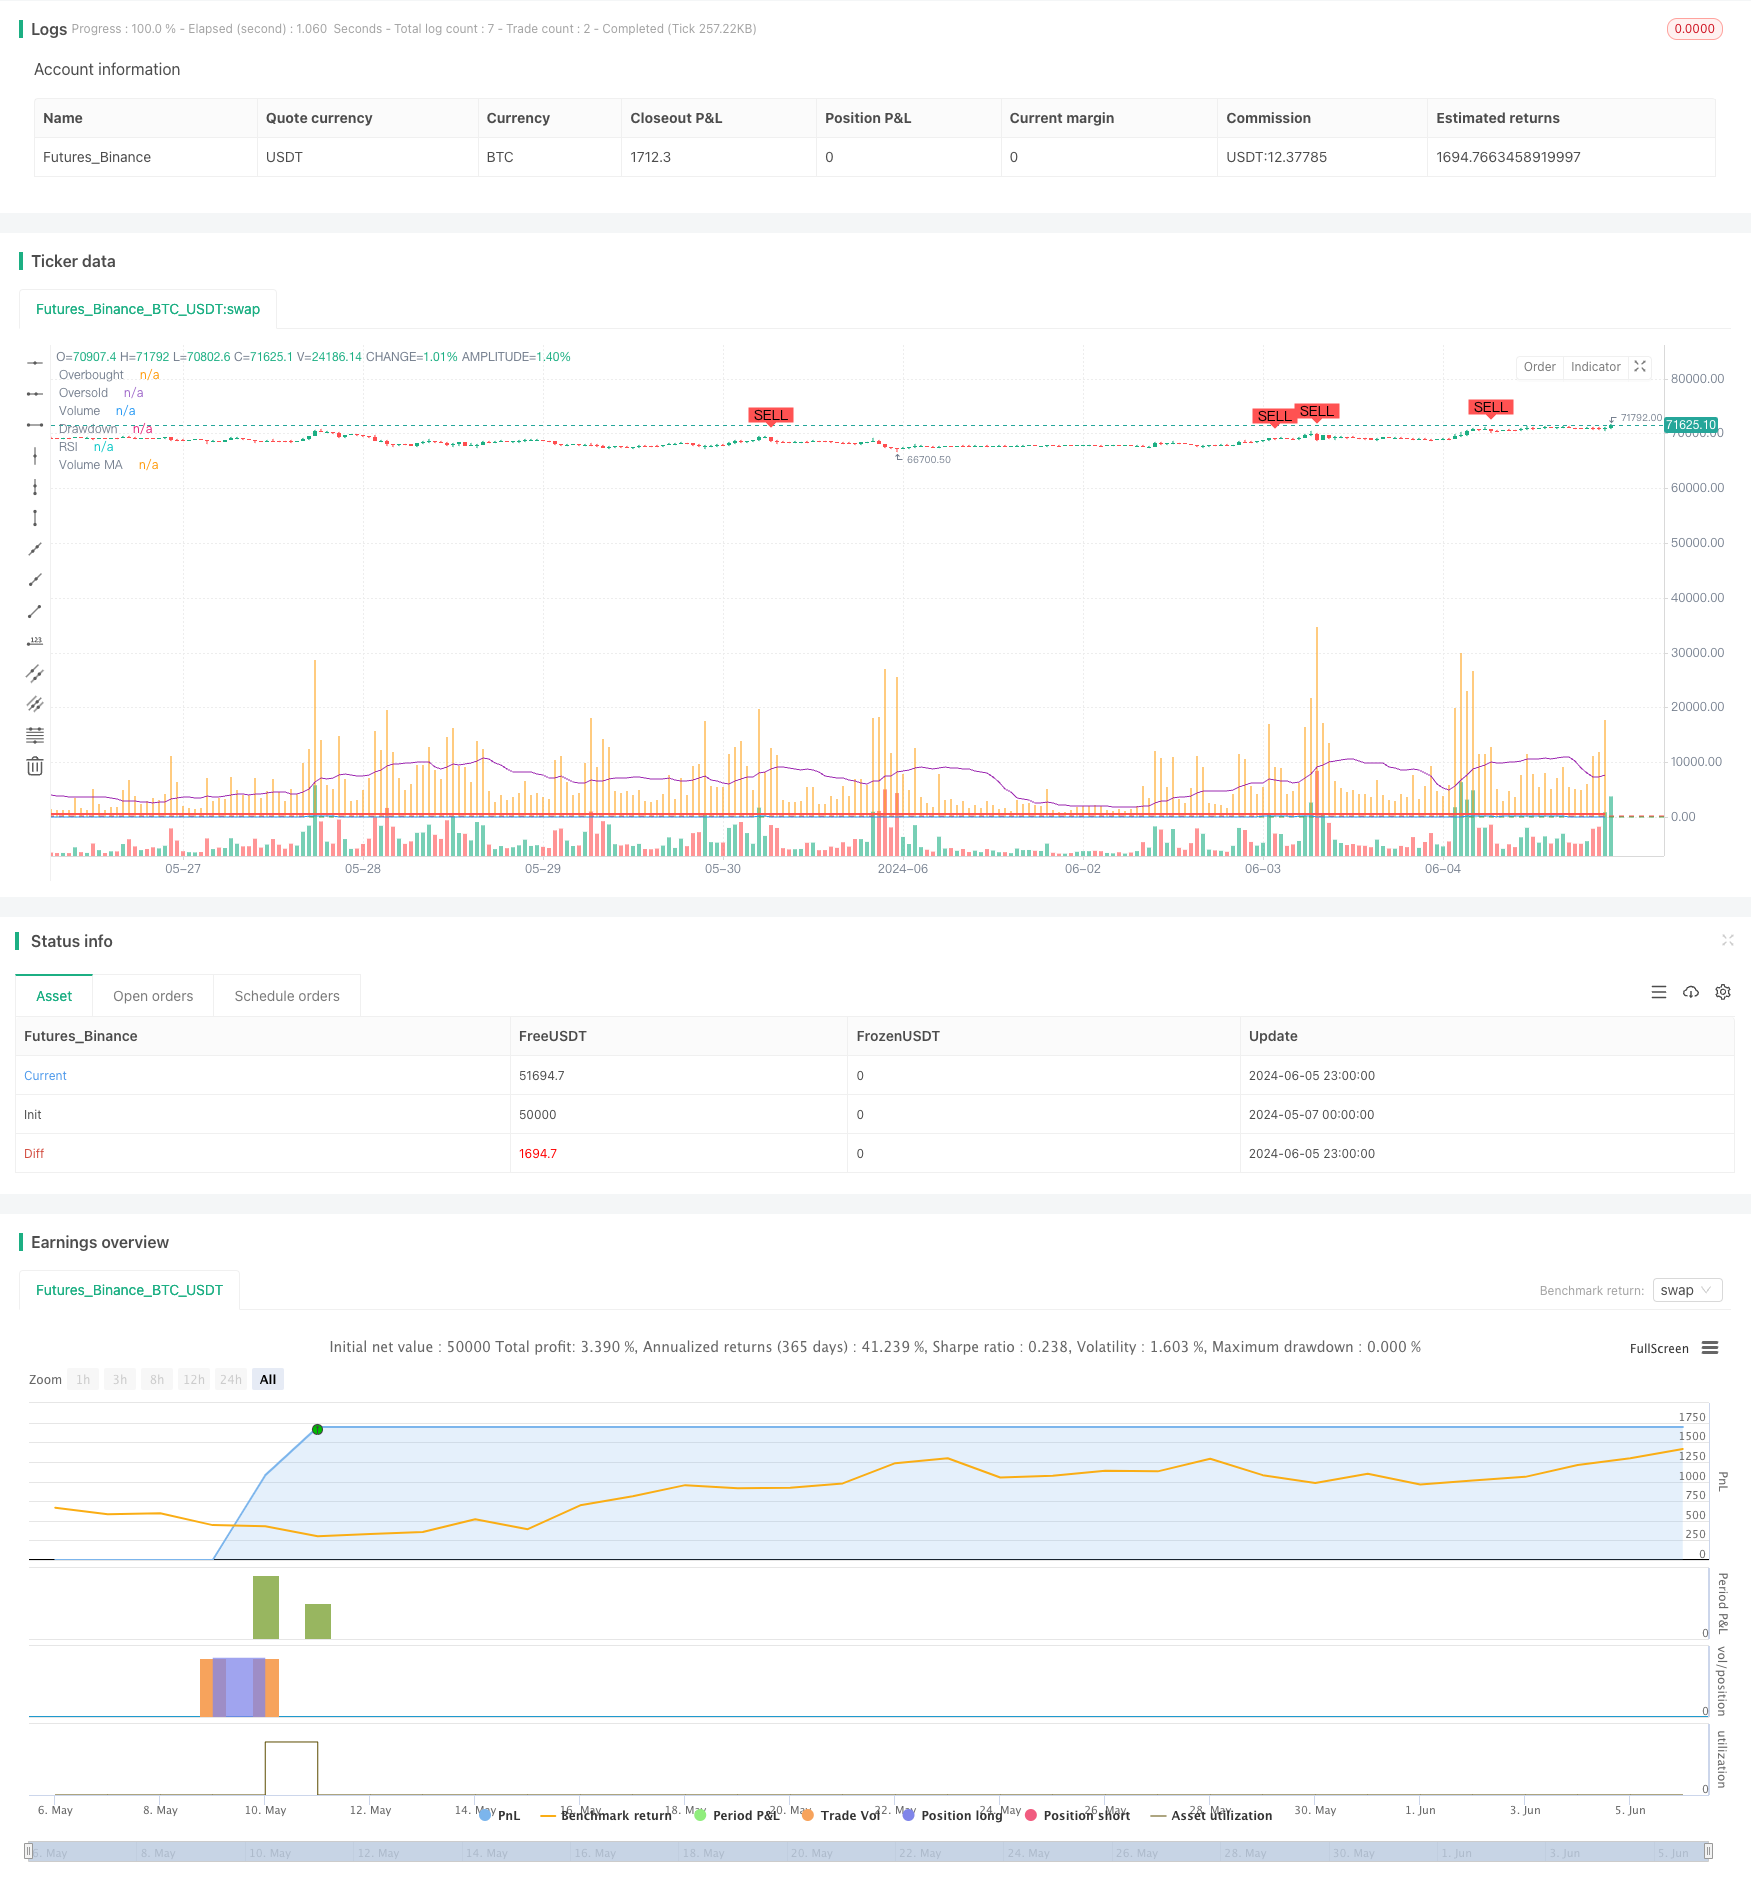
Die RSI-Dynamik ist eine dynamische Anziehungs-Stop-Loss-Strategie.
Schriftsteller:ChaoZhang, Datum: 2024-06-07Tags:RSI- Nein.

Übersicht
Diese Strategie basiert auf der Wyckoff-Methode und kombiniert den Relative Strength Index (RSI) und den Volumen Moving Average (Volume MA) zur Identifizierung der Akkumulations- und Verteilungsphasen des Marktes und generiert Kauf- und Verkaufssignale.
Strategieprinzip
- Berechnen Sie den RSI-Indikator und den Volume Moving Average.
- Wenn der RSI über das Überverkaufsgebiet überschreitet und das Volumen größer ist als das Volumen-MA, identifiziert er die Akkumulationsphase des Marktes und erzeugt ein Kaufsignal.
- Wenn der RSI unter den Überkaufbereich geht und das Volumen größer ist als das Volumen-MA, wird die Marktverteilungsphasen identifiziert und ein Verkaufssignal erzeugt.
- Die Strategie verfolgt gleichzeitig das maximale Eigenkapital des Kontos und die laufende Anziehung.
- Kaufpositionen werden während der Verteilungsphase oder wenn die Auslastung die maximale Auslastung übersteigt, während Verkaufspositionen während der Akkumulationsphase oder wenn die Auslastung die maximale Auslastung übersteigt, geschlossen.
Strategische Vorteile
- Durch die Kombination von RSI und Volumenindikatoren kann die Strategie die Akkumulations- und Verteilungsphasen des Marktes genauer erfassen.
- Der dynamische Drawdown-Stop-Loss-Mechanismus steuert effektiv die maximale Drawdown-Rate der Strategie und verringert damit das Gesamtrisiko der Strategie.
- Geeignet für 5-minütige Hochfrequenzdaten, die eine schnelle Reaktion auf Marktveränderungen und zeitnahe Positionsanpassungen ermöglichen.
Strategische Risiken
- Die RSI- und Volumenindikatoren können unter bestimmten Marktbedingungen irreführende Signale erzeugen, die zu falschen Handelsentscheidungen durch die Strategie führen.
- Die Festsetzung der Höchstgrenze für die Ausbeute muss an die Merkmale des Marktes und die persönlichen Risikopräferenzen angepasst werden; eine unsachgemäße Einstellung kann zu einem vorzeitigen Positionsschließen oder zu einer übermäßigen Risikobereitschaft führen.
- Die Strategie kann häufige Handelssignale in unruhigen Märkten erzeugen und die Handelskosten erhöhen.
Strategieoptimierungsrichtlinien
- Es sollte in Betracht gezogen werden, andere technische Indikatoren wie MACD, Bollinger-Bänder usw. einzuführen, um die Genauigkeit der Signalen der Strategie zu verbessern.
- Optimierung der Parameter des RSI und der Volumenindikatoren, z. B. Anpassung der Länge des RSI, Überkauf/Überverkaufsschwellen usw., um sich an unterschiedliche Marktbedingungen anzupassen.
- Zusätzlich zu der Einführung von Stop-Loss-Mechanismen sollten auch nachfolgende Stop-Loss-Mechanismen oder Gewinnschutzmechanismen eingesetzt werden, um das Risiko weiter zu kontrollieren und die Gewinne zu sichern.
Zusammenfassung
Die RSI Dynamic Drawdown Stop-Loss Strategie identifiziert die Akkumulations- und Verteilungsphasen des Marktes, indem sie RSI und Volumenindikatoren kombiniert und gleichzeitig einen dynamischen Drawdown Stop-Loss-Mechanismus zur Risikokontrolle verwendet. Die Strategie berücksichtigt sowohl den Markttrend als auch das Risikomanagement, was sie bis zu einem gewissen Grad praktisch macht. Die Leistung der Strategie hängt jedoch von der Wahl der Indikatorparameter und Marktmerkmale ab, was eine kontinuierliche Optimierung und Anpassung erfordert, um ihre Stabilität und Rentabilität zu verbessern.
/*backtest
start: 2024-05-07 00:00:00
end: 2024-06-06 00:00:00
period: 1h
basePeriod: 15m
exchanges: [{"eid":"Futures_Binance","currency":"BTC_USDT"}]
*/

//@version=5
strategy("Wyckoff Methodology Strategy with Max Drawdown", overlay=true)

// Define input parameters
length = input(14, title="RSI Length")
overbought = input(70, title="RSI Overbought Level")
oversold = input(30, title="RSI Oversold Level")
volume_length = input(20, title="Volume MA Length")
initial_capital = input(10000, title="Initial Capital")
max_drawdown = input(500, title="Max Drawdown")

// Calculate RSI
rsi = ta.rsi(close, length)

// Calculate Volume Moving Average
vol_ma = ta.sma(volume, volume_length)

// Identify Accumulation Phase
accumulation = ta.crossover(rsi, oversold) and volume > vol_ma

// Identify Distribution Phase
distribution = ta.crossunder(rsi, overbought) and volume > vol_ma

// Plot RSI
hline(overbought, "Overbought", color=color.red)
hline(oversold, "Oversold", color=color.green)
plot(rsi, title="RSI", color=color.blue)

// Plot Volume and Volume Moving Average
plot(volume, title="Volume", color=color.orange, style=plot.style_histogram)
plot(vol_ma, title="Volume MA", color=color.purple)

// Variables to track drawdown
var float max_equity = initial_capital
var float drawdown = 0.0

// Update max equity and drawdown
current_equity = strategy.equity
if (current_equity > max_equity)
    max_equity := current_equity
drawdown := max_equity - current_equity

// Generate Buy and Sell Signals
if (accumulation and drawdown < max_drawdown)
    strategy.entry("Buy", strategy.long)
if (distribution and drawdown < max_drawdown)
    strategy.entry("Sell", strategy.short)

// Plot Buy and Sell signals on chart
plotshape(series=accumulation, location=location.belowbar, color=color.green, style=shape.labelup, title="Buy Signal", text="BUY")
plotshape(series=distribution, location=location.abovebar, color=color.red, style=shape.labeldown, title="Sell Signal", text="SELL")

// Close positions if drawdown exceeds max drawdown
if (drawdown >= max_drawdown)
    strategy.close_all("Max Drawdown Exceeded")

// Set strategy exit conditions
strategy.close("Buy", when=distribution or drawdown >= max_drawdown)
strategy.close("Sell", when=accumulation or drawdown >= max_drawdown)

// Display drawdown on chart
plot(drawdown, title="Drawdown", color=color.red, linewidth=2, style=plot.style_stepline)
- Beste TradingView-Strategie
- Mehrfachbestätigung Umkehrung Kaufstrategie
- Bei der Berechnung der Vermögenswerte für die Berechnung der Vermögenswerte für die Berechnung der Vermögenswerte für die Berechnung der Vermögenswerte für die Berechnung der Vermögenswerte für die Berechnung der Vermögenswerte für die Berechnung der Vermögenswerte für die Berechnung der Vermögenswerte
- Kurzfristige Handelsstrategie auf Basis von Bollinger-Bändern, gleitenden Durchschnitten und RSI
- Mehrstufiges dynamisches Trendverfolgungssystem
- Strategie zur Umstellung am Dienstag (Wochenendfilter)
- Strategie für die Dynamik des RSI-Trendes mit doppelten gleitenden Durchschnitten
- Strategie für die Dynamik des doppelten gleitenden Durchschnitts des RSI auf Basis von EMA und Trendline-Breakouts
- Dynamische Unterstützungs-Widerstands-Break-out-Strategie für bewegliche Durchschnittsüberschreitungen
- Dreifach validierte RSI-Mittelumkehrung mit gleitender Durchschnittsfilterstrategie
- BB-Ausbruchstrategie
- VWAP und RSI Dynamic Bollinger Bands nehmen Gewinn und stoppen Verlust Strategie
- Chande-Kroll Stopp Dynamischer ATR-Trend nach Strategie
- Diese Strategie erzeugt Handelssignale auf der Grundlage des Chaikin-Geldflusses (CMF)
- Trendfilterte Umkehrstrategie für die Pinbar
- Quantitative Handelsstrategie auf der Grundlage von Umkehrmustern bei Unterstützungs- und Widerstandsniveaus
- Bei der Berechnung der Vermögenswerte für die Berechnung der Vermögenswerte für die Berechnung der Vermögenswerte für die Berechnung der Vermögenswerte für die Berechnung der Vermögenswerte für die Berechnung der Vermögenswerte für die Berechnung der Vermögenswerte für die Berechnung der Vermögenswerte
- Strategie für die TSI Crossover
- EMA-Doppel-Durchschnittsstrategie für gleitende Durchschnitte
- Williams %R Dynamische TP/SL-Anpassungsstrategie
- VWAP-Handelsstrategie mit Volumenanomalie-Erkennung
- Strategie zur Kombination von Supertrend und EMA
- TGT Fallende Kaufstrategie auf Basis des Preisrückgangs
- Doppelte Trendstrategie mit EMA-Crossover und RSI-Filter
- Strategie zur Kombination von EMA und Parabol SAR
- MACD- und RSI-Mehrfilter-Tradingstrategie für den Intraday-Handel
- Preisbeziehungsbasierte Handelsstrategie zwischen zwei Märkten
- Handelsstrategie auf Basis von RSI mit Prozentsatzbasierter Gewinn- und Stop-Loss-Strategie
- Strategie der Kombination von MACD und Martingale für einen optimierten Long-Trading
- Elliott Wave Stochastic EMA-Strategie