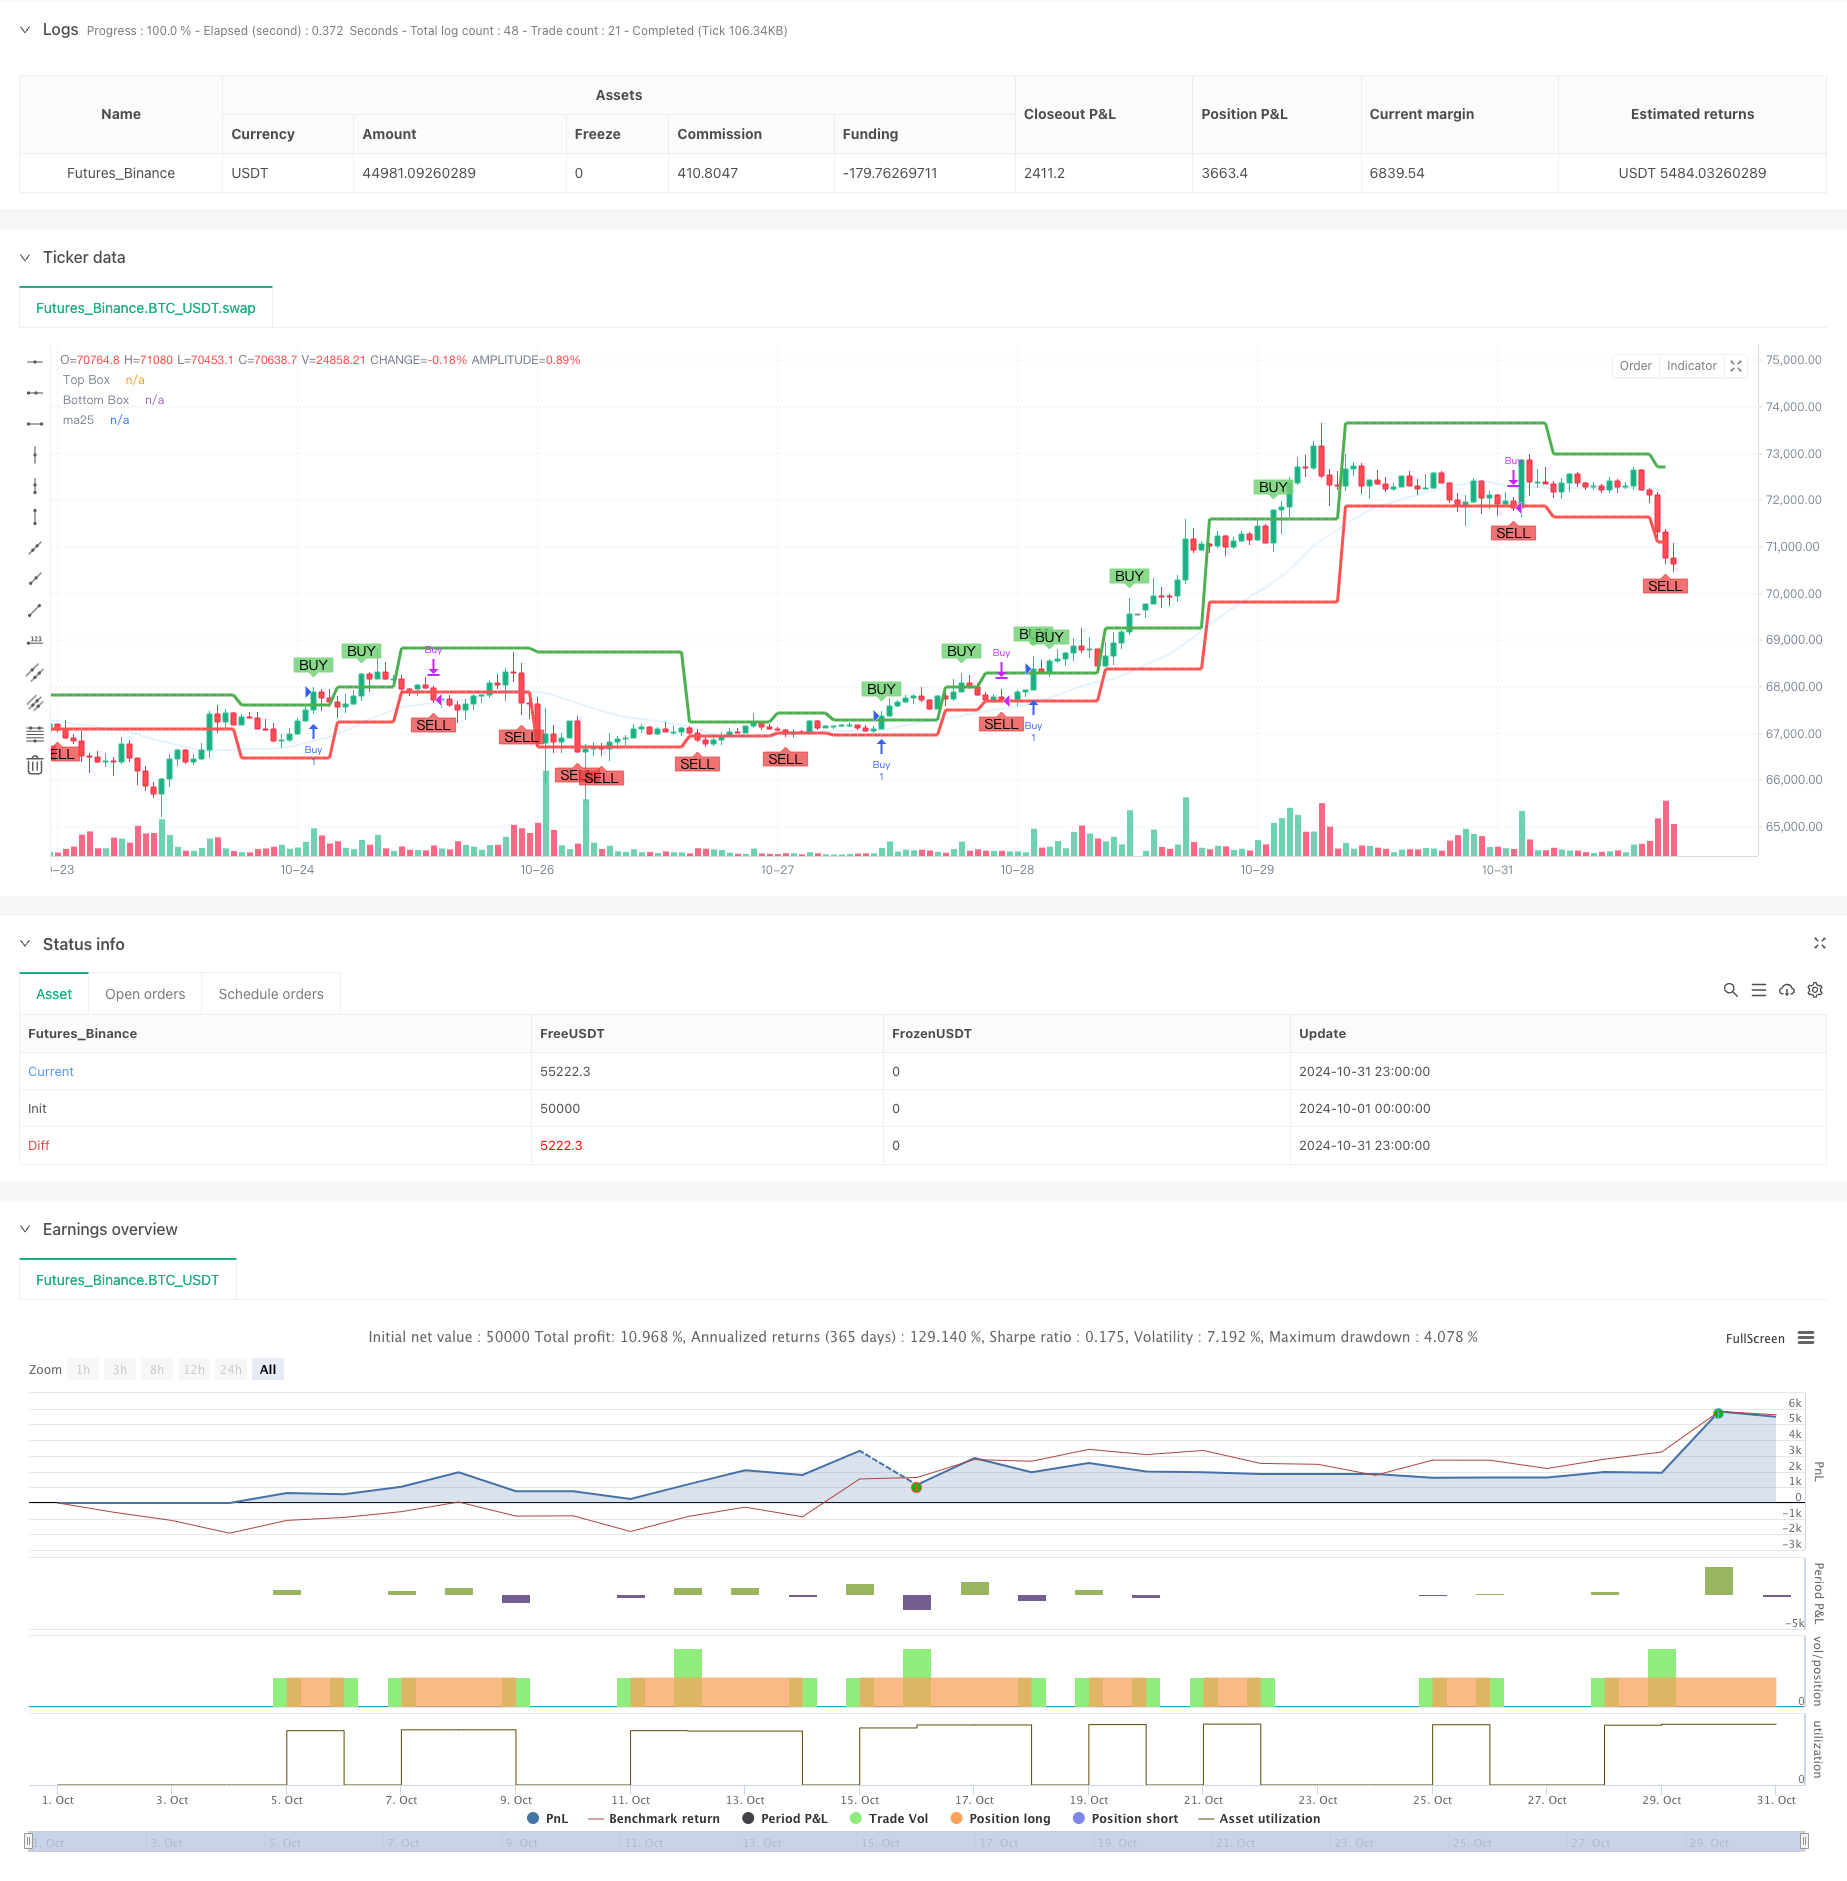
Dynamischer Darvas-Box-Breakout mit bewegtem Durchschnittstrend-Bestätigungssystem
Schriftsteller:ChaoZhang, Datum: 2024-11-18 16:00:53Tags:MA25SMA

Übersicht
Dieser Artikel stellt ein Trend-Folge-Handelssystem vor, das Darvas Box und den 25-Perioden-Beweglichen Durchschnitt (MA25) kombiniert. Die Strategie identifiziert Preiskonsolidierungszonen durch Boxbildung und bestätigt Trends mit gleitenden Durchschnitten, um starke Marktbewegungen während von Ausbrüchen zu erfassen.
Strategieprinzipien
Die Strategie besteht aus drei wesentlichen Bestandteilen:
- Darvas Box Construction: Das System bestimmt die Boxgrenzen, indem es die höchsten und niedrigsten Preise über 5 Perioden berechnet.
- Bewegliche Durchschnittstrendbestätigung: Als Trendfilter wird ein einfacher gleitender Durchschnitt über 25 Perioden eingeführt, der nur Positionen berücksichtigt, wenn der Preis über MA25 liegt.
- Erzeugung von Handelssignalen:
- Kaufsignal: Der Preis bricht über Boxtop und liegt über MA25
- Verkaufssignal: Preisbrüche unter dem Boxboden
Strategische Vorteile
- Ein starker Trend nach der Kapazität:
- Erfasst den Trendstart durch Box-Breakouts
- MA25-Filterung sorgt für den Handel in primärer Trendrichtung
- Optimierung der Signalqualität:
- Doppelbestätigungsmechanismus verringert das Risiko eines falschen Ausbruchs
- Klarer Ein- und Ausstiegsbedarf verhindert subjektives Urteilen
- Umfassende Risikokontrolle:
- Der Boxboden bildet natürlich die Stop-Loss-Ebene.
- MA25 bietet zusätzlichen Trendschutz
Strategische Risiken
- Schwankende Marktrisiken:
- Häufige Ausbrüche können zu aufeinanderfolgenden Stopps führen
- Empfohlen für den Einsatz in stark trendigen Märkten
- Verzögerungsrisiko:
- Die Boxbildung braucht Zeit, kann erste Bewegungen verpassen.
- MA25 als mittelfristiger Durchschnitt hat eine inhärente Verzögerung
- Geldmanagementrisiko:
- erfordert eine ordnungsgemäße Verteilung des Kapitals pro Geschäft
- Vorschlag zur dynamischen Anpassung der Positionsgröße an die Volatilität
Strategieoptimierungsrichtlinien
- Optimierung der Parameter:
- Anpassungsfähiger Rahmenzeitraum anhand der Merkmale des Marktes
- Die Zulassungsfrist kann an die Merkmale des Marktzyklus angepasst werden
- Signalverstärkung:
- Kann Volumenbestätigungsmechanismus hinzufügen
- Überlegen Sie, dynamische Stop-Loss-Verfahren einzuführen
- Verbesserung der Risikokontrolle:
- Fügen Sie einen Volatilitätsfilter hinzu
- Implementieren dynamischer Positionsgrößen
Zusammenfassung
Die Strategie baut ein robustes Handelssystem auf, indem sie die klassische Darvas-Box-Theorie mit einem gleitenden Durchschnittstrend kombiniert. Der Hauptvorteil liegt darin, die Trending-Märkte effektiv zu erfassen und gleichzeitig das Risiko durch mehrere Filtermechanismen zu kontrollieren. Obwohl es eine gewisse inhärente Verzögerung gibt, kann die Strategie durch eine angemessene Parameteroptimierung und Risikomanagement eine stabile Performance in den Trending-Märkten erzielen.
/*backtest
start: 2024-10-01 00:00:00
end: 2024-10-31 23:59:59
period: 1h
basePeriod: 1h
exchanges: [{"eid":"Futures_Binance","currency":"BTC_USDT"}]
*/

//@version=5
strategy("DARVAS BOX with MA25 Buy Condition", overlay=true, shorttitle="AEG DARVAS")

// Input for box length
boxp = input.int(5, "BOX LENGTH")

// Calculate 25-period moving average
ma25 = ta.sma(close, 25)

// Lowest low and highest high within the box period
LL = ta.lowest(low, boxp)
k1 = ta.highest(high, boxp)
k2 = ta.highest(high, boxp - 1)
k3 = ta.highest(high, boxp - 2)

// New high detection
NH = ta.valuewhen(high > k1[1], high, 0)

// Logic to detect top and bottom of Darvas Box
box1 = k3 < k2
TopBox = ta.valuewhen(ta.barssince(high > k1[1]) == boxp - 2 and box1, NH, 0)
BottomBox = ta.valuewhen(ta.barssince(high > k1[1]) == boxp - 2 and box1, LL, 0)

// Plot the top and bottom Darvas Box lines
plot(TopBox, linewidth=3, color=color.green, title="Top Box")
plot(BottomBox, linewidth=3, color=color.red, title="Bottom Box")
plot(ma25, color=#2195f31e, linewidth=2, title="ma25")

// --- Buy and Sell conditions ---

// Buy when price breaks above the Darvas Box AND MA15
buyCondition = ta.crossover(close, TopBox) and close > ma25

// Sell when price drops below the Darvas Box
sellCondition = ta.crossunder(close, BottomBox)

// --- Buy and Sell Signals ---

// Plot BUY+ and SELL labels
plotshape(series=buyCondition, title="Buy+ Signal", location=location.abovebar, color=#72d174d3, style=shape.labeldown, text="BUY")
plotshape(series=sellCondition, title="Sell Signal", location=location.belowbar, color=color.rgb(234, 62, 62, 28), style=shape.labelup, text="SELL")

// --- Strategy execution ---

if (buyCondition)
    strategy.entry("Buy", strategy.long)

if (sellCondition)
    strategy.close("Buy")
- Bollinger Bands Stochastischer Oszillator-Strategie
- Bollinger-Bänder Standardabweichungs-Breakout-Strategie
- Doppelzeitliche Dynamikstrategie
- Indikator für die Druckdynamik
- Doppel bewegliche Durchschnittsüberschreitende Bestätigungsstrategie mit dem Optimierungsmodell der Volumen-Preisintegration
- Nik Stoch
- TMA-Überlagerung
- Dynamische Stop-Loss- und Take-Profit-Strategie mit Bollinger Bands
- Strategie zur Ermittlung dynamischer Marktordnungen auf der Grundlage einer linearen Regressionsneigung
- Dynamische Gewinnstrategie für Bollinger Bands
- Zweifelhafter gleitender Durchschnitts-Kreuzungstrend nach Strategie mit dynamischem Stop-Loss- und Take-Profit-System
- Multi-Timeframe Trend Following Trading System mit ATR- und MACD-Integration
- Intelligente Handelsstrategie für den Dual Timeframe Supertrend RSI
- Zweifache MACD-Preisaktions-Break-Trailing-Strategie
- Multi-EMA-Trendmomentum-Erkennung und Stop-Loss-Handelssystem
- Strategie zur Bestätigung der Trendentwicklung der doppelten EMA-Volumenentwicklung für den quantitativen Handel
- Die Risikopositionen werden von den Risikopositionen in den einzelnen Sektoren erfasst, wobei die Risikopositionen in den einzelnen Sektoren berücksichtigt werden.
- Verstärkte dynamische mehrjährige Anpassungsentwicklung nach Handelssystem
- Zweiränge-Handelsstrategie für große Volatilitätsbrechungen: punktbasiertes Schwellenwert-Eintrittssystem
- Erweiterte quantitative Strategie zur Umkehrung der Bollinger-Mittelwerte
- Dynamische EMA-Quantitative Handelsstrategie für Crossover mit Gewinn-Stop-Loss
- Multi-EMA-Crossover-Trend nach Strategie mit dynamischer Stop-Loss- und Take-Profit-Optimierung
- Zweifelhafte Querschnittstrategie für gleitende Durchschnitte mit dynamischem Risikomanagement
- Strategie zur Absicherung von zwei Plattformen
- Zweifelhafte Kreuzung von gleitenden Durchschnitten mit einer dynamischen Risikomanagementstrategie
- Multi-MA-Strength-Trend-Erfassung mit Momentum-Gewinnstrategie
- Multi-Strategy Adaptive Trend Following und Breakout Handelssystem
- Mehrstufiger gleitender Durchschnitt mit Kerzenmustererkennungs-Handelssystem
- Handelsstrategie für den Trendmomentum der EMA über mehrere Zeitrahmen
- Intelligente zeitbasierte, lang-kurzlaufende, ausgewogene Handelsstrategie