EMA Momentum Trading Strategy
Author: ChaoZhang, Date: 2024-05-28 17:28:30Tags: EMAMA

Overview
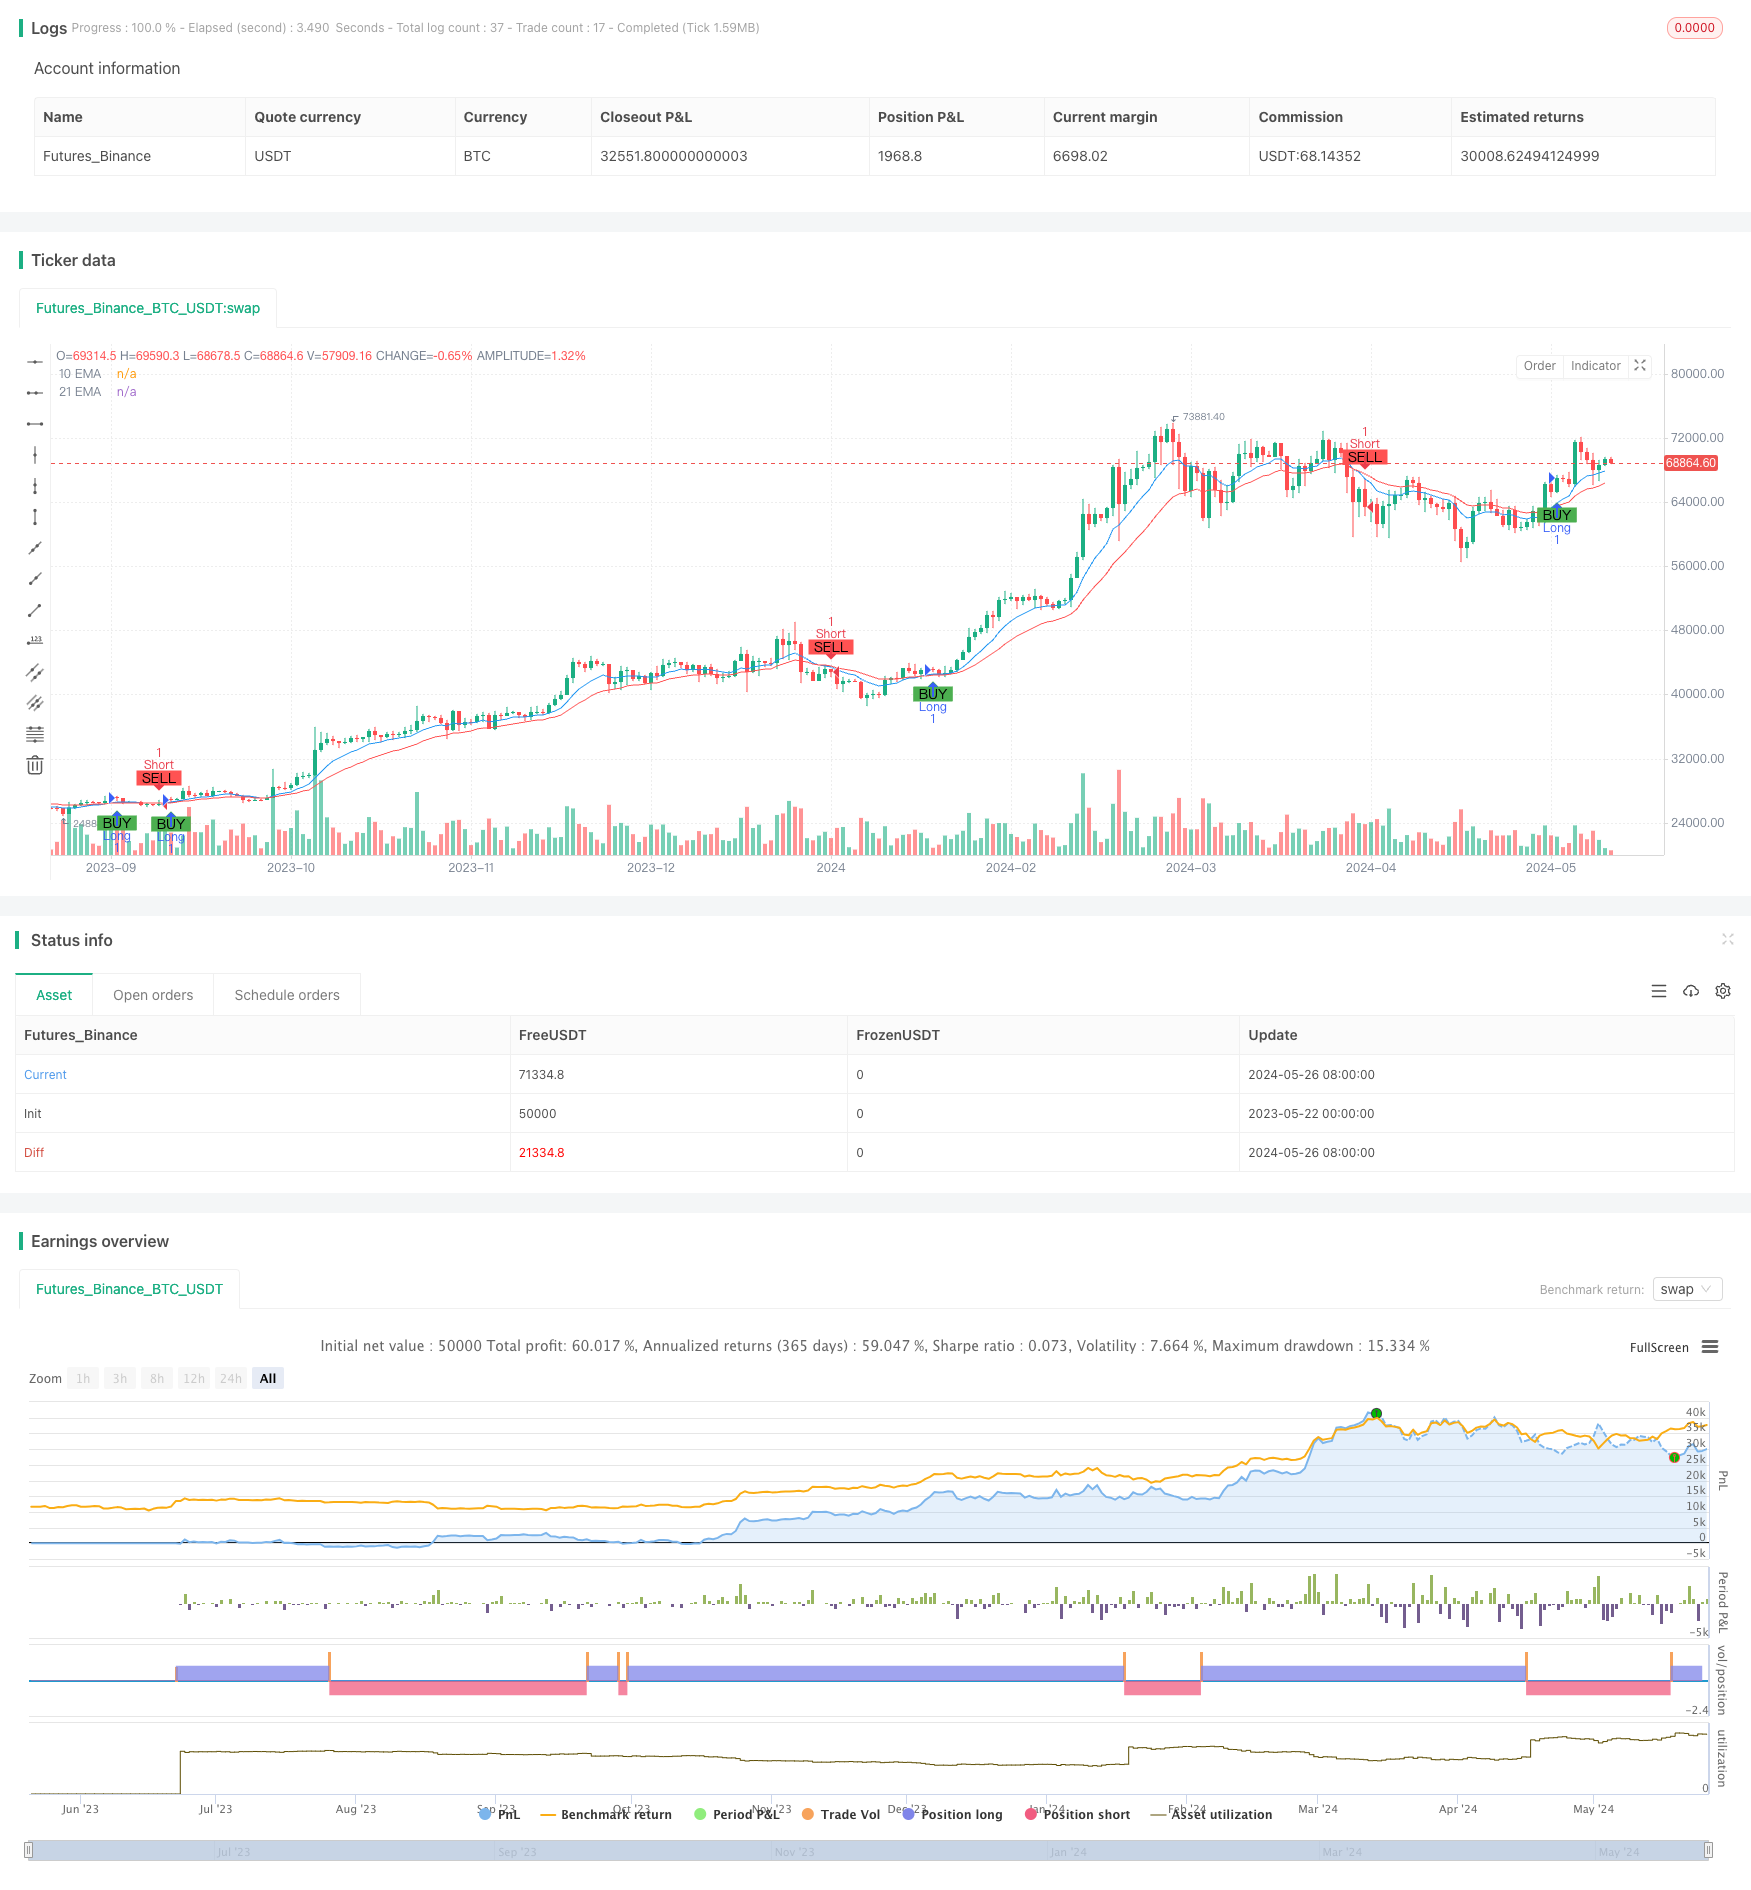
This strategy utilizes the crossover signals of Exponential Moving Averages (EMAs) to capture momentum changes in price. By comparing a short-term EMA with a long-term EMA, a buy signal is generated when the short-term EMA crosses above the long-term EMA, and a sell signal is generated when the opposite occurs. The strategy introduces a delayed confirmation mechanism for trading signals to ensure that the crossover signal is confirmed before executing trades, thereby improving the reliability of signals.
Strategy Principle
The core of this strategy is to use EMAs of different periods to capture momentum changes in price. EMA is a trend-following indicator that is more sensitive to price changes. When the short-term EMA crosses above the long-term EMA, it indicates an upward momentum in price, generating a buy signal; when the short-term EMA crosses below the long-term EMA, it indicates a downward momentum in price, generating a sell signal.
The strategy introduces a delayed confirmation mechanism for trading signals, using the closing price of the candle where the signal is generated as the trigger price for the trade, and delaying the execution of the trade until the next candle. This ensures that the crossover signal is confirmed, improves the reliability of signals, and avoids frequent false signal trades.
Strategy Advantages
- Simple and effective: The strategy logic is simple and clear, easy to understand and implement, while effectively capturing momentum changes in price.
- Trend following: The EMA indicator has good trend-tracking capabilities, able to detect turning points in price in a timely manner, allowing the strategy to trade in line with trends.
- Signal confirmation: By introducing a delayed confirmation mechanism for trading signals, the reliability of signals is improved, reducing the occurrence of false signal trades.
- Strong adaptability: The strategy can adapt to different market environments and trading instruments by adjusting the period parameters of the EMAs.
Strategy Risks
- Parameter sensitivity: The performance of the strategy depends on the choice of EMA periods, and different period parameters may lead to large differences in strategy performance.
- Oscillating markets: In oscillating markets, frequent crossover signals may lead to more trades, increasing trading costs and risks.
- Trend reversal: At trend reversal points, the strategy may experience larger drawdowns, as the EMA indicator has a certain lag.
Strategy Optimization Directions
- Parameter optimization: Optimize the period parameters of the EMAs to find the optimal parameter combination suitable for different market environments and trading instruments.
- Filtering mechanisms: Introduce other technical indicators or filtering conditions, such as trading volume and volatility, to filter out some low-quality trading signals.
- Stop-loss and take-profit: Set reasonable stop-loss and take-profit rules to control the risk exposure of a single trade and improve the risk-reward ratio of the strategy.
- Position management: Dynamically adjust position sizes based on market volatility and account risk tolerance to control overall risk.
Summary
This strategy is based on EMA crossover signals and a delayed confirmation mechanism to capture momentum changes in price in a simple and effective way. The strategy logic is clear, easy to implement and optimize. However, it also faces risks such as parameter sensitivity, oscillating markets, and trend reversals. Through parameter optimization, signal filtering, stop-loss and take-profit, and position management, the robustness and profitability of the strategy can be further enhanced.
/*backtest
start: 2023-05-22 00:00:00
end: 2024-05-27 00:00:00
period: 1d
basePeriod: 1h
exchanges: [{"eid":"Futures_Binance","currency":"BTC_USDT"}]
*/

// This Pine Script™ code is subject to the terms of the Mozilla Public License 2.0 at https://mozilla.org/MPL/2.0/
// © anshchaubey1373

//@version=5
strategy("EMA Crossover Strategy", overlay=true)

// Define the EMA lengths
shortEmaLength = 10
longEmaLength = 21

// Calculate the EMAs
shortEma = ta.ema(close, shortEmaLength)
longEma = ta.ema(close, longEmaLength)

// Plot the EMAs
plot(shortEma, title="10 EMA", color=color.blue)
plot(longEma, title="21 EMA", color=color.red)

// Generate buy and sell signals
longCondition = ta.crossover(shortEma, longEma)
shortCondition = ta.crossunder(shortEma, longEma)

// Delay the signal by one bar
longSignal = ta.valuewhen(longCondition, close, 1)
shortSignal = ta.valuewhen(shortCondition, close, 1)

// Plot buy and sell signals
plotshape(series=longCondition[1], location=location.belowbar, color=color.green, style=shape.labelup, text="BUY")
plotshape(series=shortCondition[1], location=location.abovebar, color=color.red, style=shape.labeldown, text="SELL")

// Strategy logic for entering positions
if (longCondition[1])
    strategy.entry("Long", strategy.long)

if (shortCondition[1])
    strategy.entry("Short", strategy.short)
- Triple EMA Crossover Trading Strategy with Dynamic Stop-Loss and Take-Profit
- Intraday Breakout Strategy Based on 3-Minute Candle High Low Points
- MACD Crossover Strategy
- Cross-Market Overnight Position Strategy with EMA Filter
- Multi-EMA Crossover Trend Following Strategy
- Multi-EMA Crossover Momentum Trend Following Strategy
- Dual Chain Hybrid Momentum EMA Tracking Trading System
- Multi-Timeframe EMA Trend Strategy with Daily High-Low Breakout System
- Triple EMA Trend Following Quantitative Trading Strategy
- Multi-EMA Crossover Trend Following Quantitative Trading Strategy
- Dynamic ATR Stop Loss and Take Profit Moving Average Crossover Strategy
- EMA Trend Momentum Candlestick Pattern Strategy
- G-Channel Trend Detection Strategy
- Moving Average Crossover with Trailing Stop Loss Strategy
- EMA Crossover Trading Strategy with Dynamic Take Profit and Stop Loss
- Bollinger Bands and EMA Trend Following Strategy
- WaveTrend Oscillator Divergence Strategy
- Volatility and Linear Regression-based Long-Short Market Regime Optimization Strategy
- Hybrid Binomial Z-Score Quantitative Strategy
- RSI and MA Combination Strategy
- FVG Momentum Scalping Strategy
- ATR and EMA-based Dynamic Take Profit and Stop Loss Adaptive Strategy
- Trend Following with Breakout and Frequency Filter (Long Only)
- Fibonacci Golden Harmony Breakout Strategy
- Dynamic Market Regime Identification Strategy Based on Linear Regression Slope
- Trend Reversal Trading Strategy Based on RSI Divergence
- Dual Moving Average RSI Momentum Strategy Based on EMA and Trendline Breakouts
- Dynamic Position Management Daily Trading Strategy
- Technical Trading Strategy for BTC 15-minute Chart
- Dynamic Position Sizing Short-Term Forex Trading Strategy