VWAP and Super Trend Buy/Sell Strategy
Author: ChaoZhang, Date: 2024-06-03 10:45:14Tags: VWAPATR
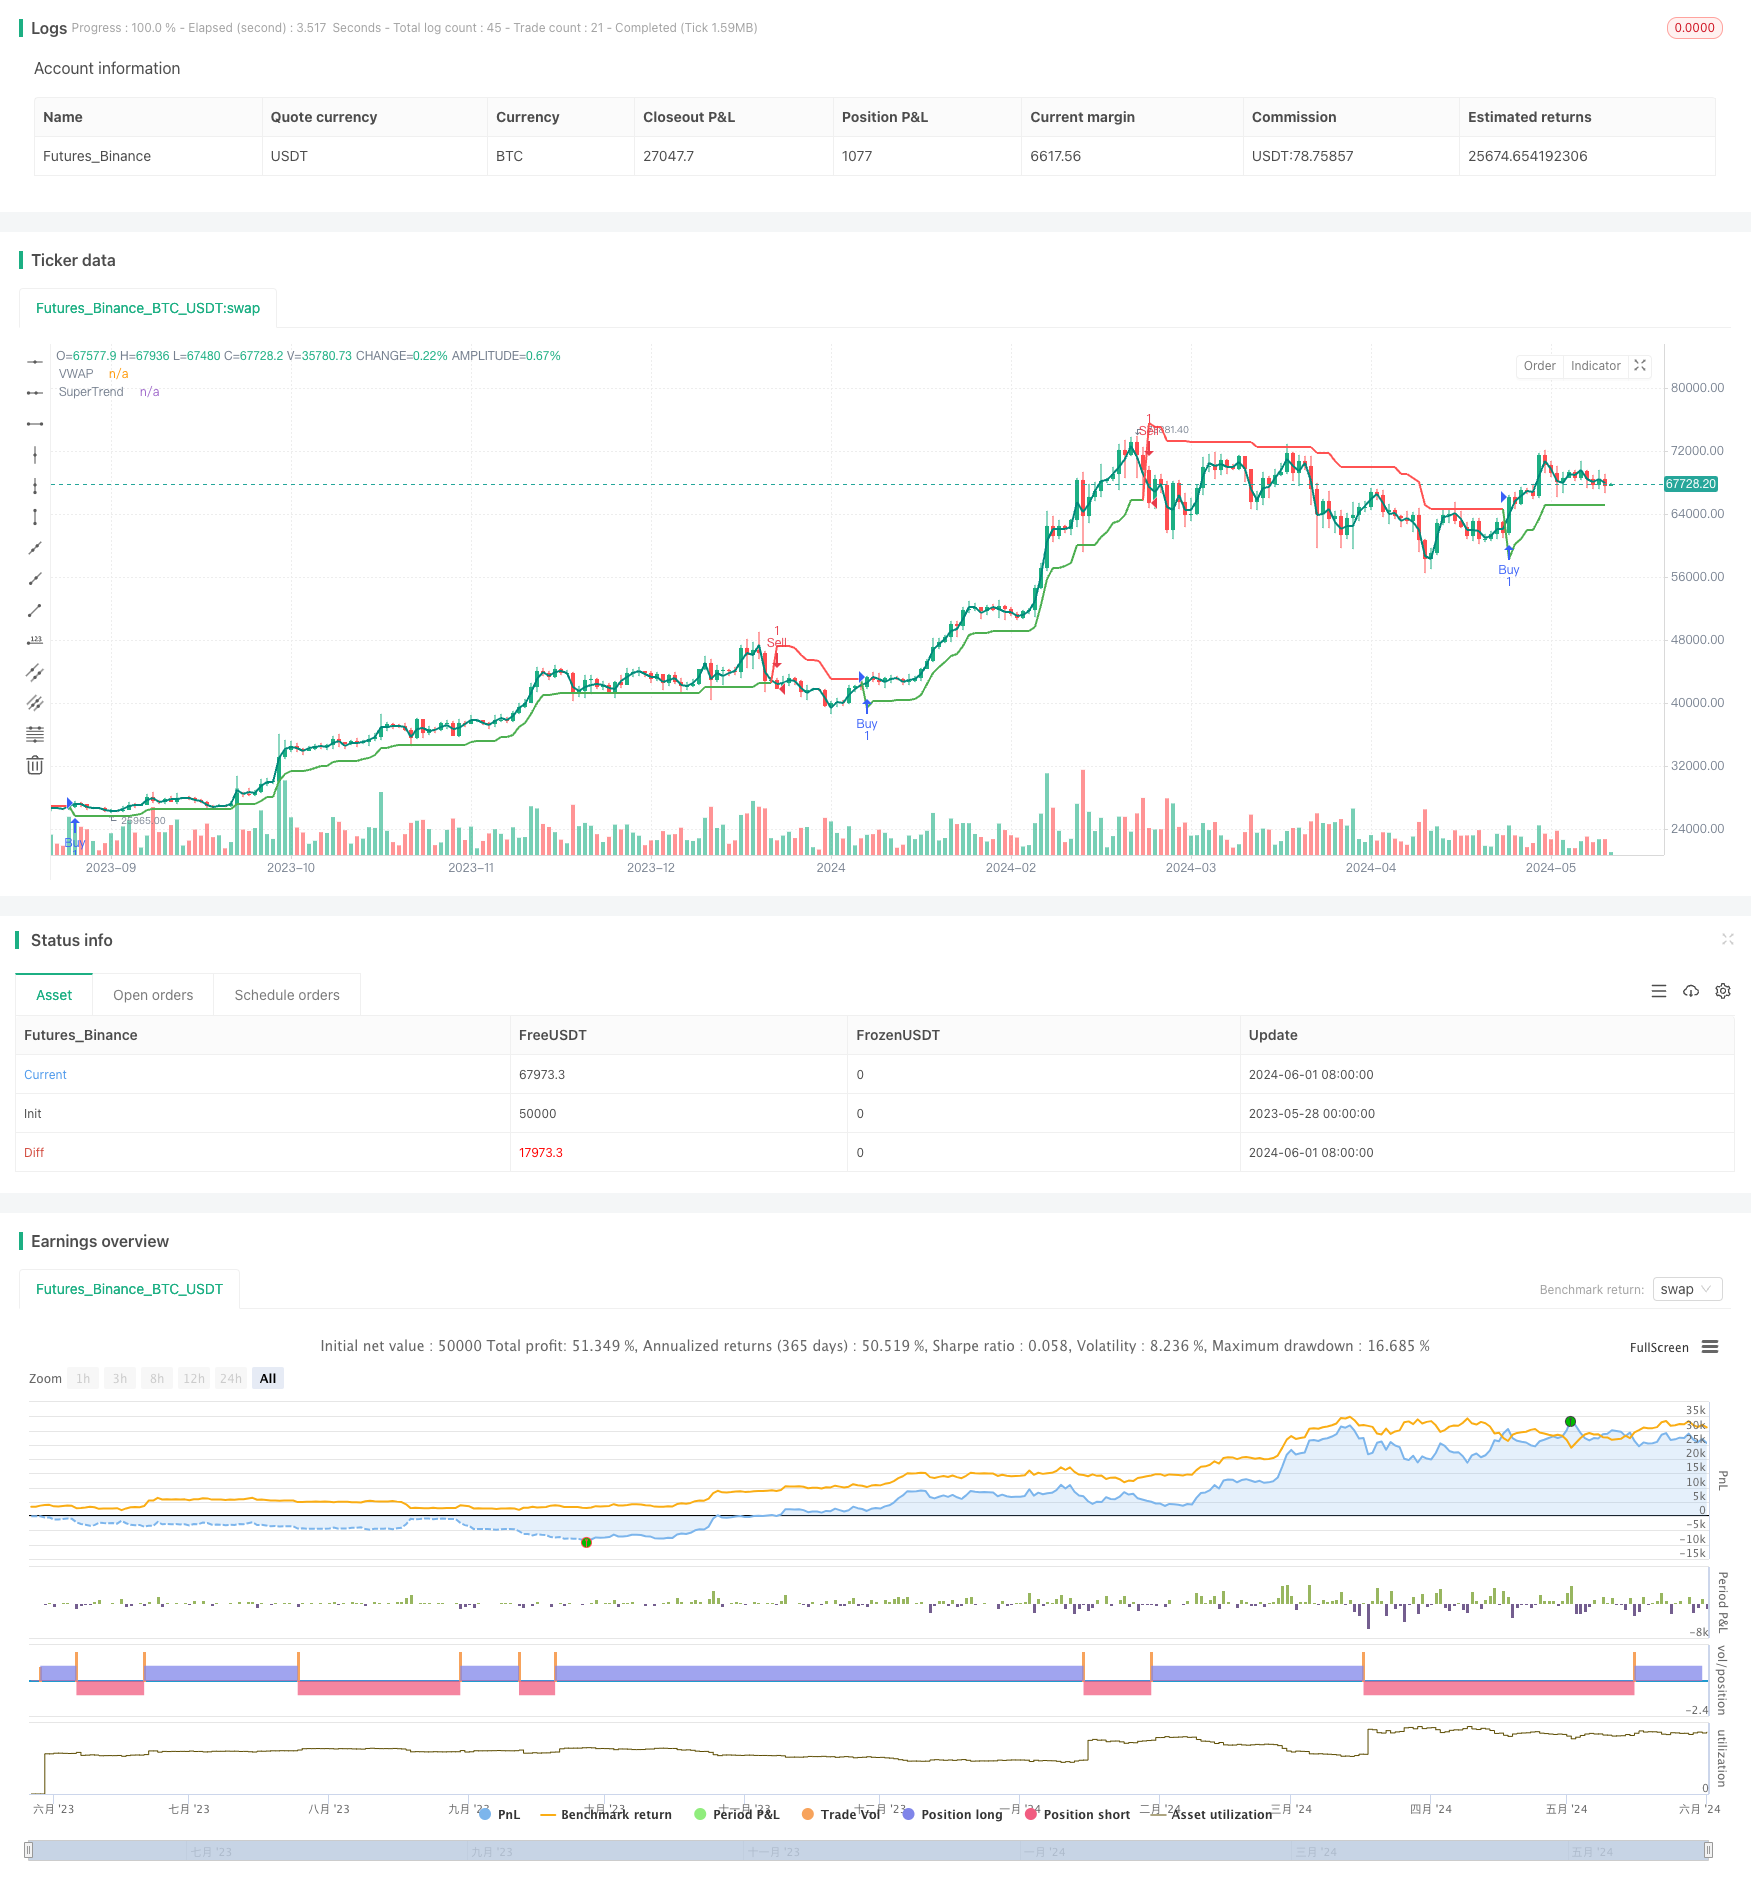
Overview
This strategy combines the VWAP (Volume Weighted Average Price) and Supertrend indicators. It determines buy and sell signals by comparing the price’s position relative to the VWAP and the direction of the Supertrend indicator. A buy signal is generated when the price crosses above the VWAP and the Supertrend is positive, while a sell signal is generated when the price crosses below the VWAP and the Supertrend is negative. The strategy also avoids generating duplicate signals by recording the previous signal state until an opposite signal appears.
Strategy Principle
- Calculate the VWAP indicator using the ta.vwap function, with customizable VWAP length.
- Calculate the Supertrend indicator using the ta.supertrend function, with customizable ATR period and multiplier.
- Determine buy condition: current price crosses above VWAP and Supertrend direction is positive.
- Determine sell condition: current price crosses below VWAP and Supertrend direction is negative.
- Record the previous signal state to avoid consecutive signals in the same direction. A new trading signal is generated only when the current signal differs from the previous one.
Strategy Advantages
- Combines VWAP and Supertrend indicators for a more comprehensive assessment of market trends and potential turning points.
- The VWAP indicator considers volume, better reflecting the market’s true movement.
- The Supertrend indicator has trend-following and oscillation-filtering characteristics, helping to capture major trends.
- The mechanism to avoid duplicate signals reduces trading frequency and lowers transaction costs.
Strategy Risks
- During periods of high market volatility or unclear trends, the strategy may generate more false signals.
- The strategy’s performance depends on the choice of VWAP and Supertrend parameters; different settings may lead to different results.
- The strategy does not incorporate risk management and position sizing, which need to be combined with other measures to control risk in practical applications.
Strategy Optimization Directions
- Introduce a trend confirmation mechanism, such as using moving averages or other trend indicators, to further filter signals.
- Optimize parameter selection by backtesting historical data to find the best combination of VWAP length, ATR period, and multiplier.
- Implement risk management measures, such as stop-loss and take-profit, to control individual trade risk.
- Consider incorporating money management strategies, such as fixed fraction or Kelly Criterion, to optimize position sizing.
Summary
The VWAP and Supertrend Buy/Sell Strategy aims to comprehensively capture market trends and potential turning points by combining two different types of indicators. The strategy logic is clear and easy to implement and optimize. However, the strategy’s performance depends on parameter selection and lacks risk management measures. In practical applications, further optimization and refinement are needed to adapt to different market conditions and trading requirements.
/*backtest
start: 2023-05-28 00:00:00
end: 2024-06-02 00:00:00
period: 1d
basePeriod: 1h
exchanges: [{"eid":"Futures_Binance","currency":"BTC_USDT"}]
*/

//@version=5
strategy(title="VWAP and Super Trend Buy/Sell Strategy", shorttitle="VWAPST", overlay=true)


//===== VWAP =====
showVWAP = input.bool(title="Show VWAP", defval=true, group="VWAP")
VWAPSource = input.source(title="VWAP Source", defval=hl2, group="VWAP")
VWAPrice = ta.vwap(VWAPSource)
plot(showVWAP ? VWAPrice : na, color=color.teal, title="VWAP", linewidth=2)


//===== Super Trend =====
showST = input.bool(true, "Show SuperTrend Indicator", group="Super Trend")
Period = input.int(title="ATR Period", defval=10, group="Super Trend")
Multiplier = input.float(title="ATR Multiplier", defval=2.0, group="Super Trend")


// Super Trend ATR
Up = hl2 - (Multiplier * ta.atr(Period))
Dn = hl2 + (Multiplier * ta.atr(Period))
var float TUp = na
var float TDown = na
TUp := na(TUp[1]) ? Up : close[1] > TUp[1] ? math.max(Up, TUp[1]) : Up
TDown := na(TDown[1]) ? Dn : close[1] < TDown[1] ? math.min(Dn, TDown[1]) : Dn
var int Trend = na
Trend := na(Trend[1]) ? 1 : close > TDown[1] ? 1 : close < TUp[1] ? -1 : Trend[1]


Tsl = Trend == 1 ? TUp : TDown
linecolor = Trend == 1 ? color.green : color.red
plot(showST ? Tsl : na, color=linecolor, style=plot.style_line, linewidth=2, title="SuperTrend")


// Buy/Sell Conditions
var bool previousBuysignal = false
var bool previousSellsignal = false


buysignal = not previousBuysignal and Trend == 1 and close > VWAPrice
sellsignal = not previousSellsignal and Trend == -1 and close < VWAPrice


// Ensure the signals are not repetitive
if (buysignal)
    previousBuysignal := true
    previousSellsignal := false
else if (sellsignal)
    previousBuysignal := false
    previousSellsignal := true


// Execute buy and sell orders
if (buysignal)
    strategy.entry("Buy", strategy.long)
if (sellsignal)
    strategy.entry("Sell", strategy.short)


// Plot Buy/Sell Labels
//plotshape(buysignal, title="Buy Signal", location=location.belowbar, color=color.green, style=shape.labelup, text="BUY", textcolor=color.white, size=size.normal)
//plotshape(sellsignal, title="Sell Signal", location=location.abovebar, color=color.red, style=shape.labeldown, text="SELL", textcolor=color.white, size=size.normal)
- VWAP-ATR Dynamic Price Action Trading System
- VWAP and RSI Dynamic Bollinger Bands Take Profit and Stop Loss Strategy
- VWAP-ATR Trend Following and Price Reversal Strategy
- Big Red Candle Breakout Buy Strategy
- Technical Trading Strategy for BTC 15-minute Chart
- High-Frequency Dynamic Multi-Indicator Moving Average Crossover Strategy
- Multi-Filter Trend Breakthrough Smart Moving Average Trading Strategy
- Multi-Indicator Composite Trend Following Strategy
- Chandelier Exit
- Volatility Range Trading Strategy Based on Stochastic Oscillator
- RSI and Linear Regression Channel Trading Strategy
- Double Vegas Channel Volatility-Adjusted SuperTrend Quantitative Trading Strategy
- EMA RSI Crossover Strategy
- Moving Average Convergence Momentum Cloud Strategy
- Dual Moving Average Crossover Stop Loss and Take Profit Strategy
- TEMA Dual Moving Average Crossover Strategy
- Multi-Timeframe SMA Trend Following Strategy with Dynamic Stop Loss
- Bollinger Bands Accurate Entry And Risk Control Strategy
- Bollinger Bands + RSI + Stochastic RSI Strategy Based on Volatility and Momentum Indicators
- TURTLE-ATR Bollinger Bands Breakout Strategy
- Advanced MACD Strategy with Limited Martingale
- Keltner Channels EMA ATR Strategy
- MA MACD BB Multi-Indicator Trading Strategy Backtesting Tool
- RSI+Supertrend Trend-Following Trading Strategy
- Ichimoku Kumo Trading Strategy
- Dynamic ATR Stop Loss and Take Profit Moving Average Crossover Strategy
- EMA Trend Momentum Candlestick Pattern Strategy
- G-Channel Trend Detection Strategy
- Moving Average Crossover with Trailing Stop Loss Strategy
- EMA Crossover Trading Strategy with Dynamic Take Profit and Stop Loss