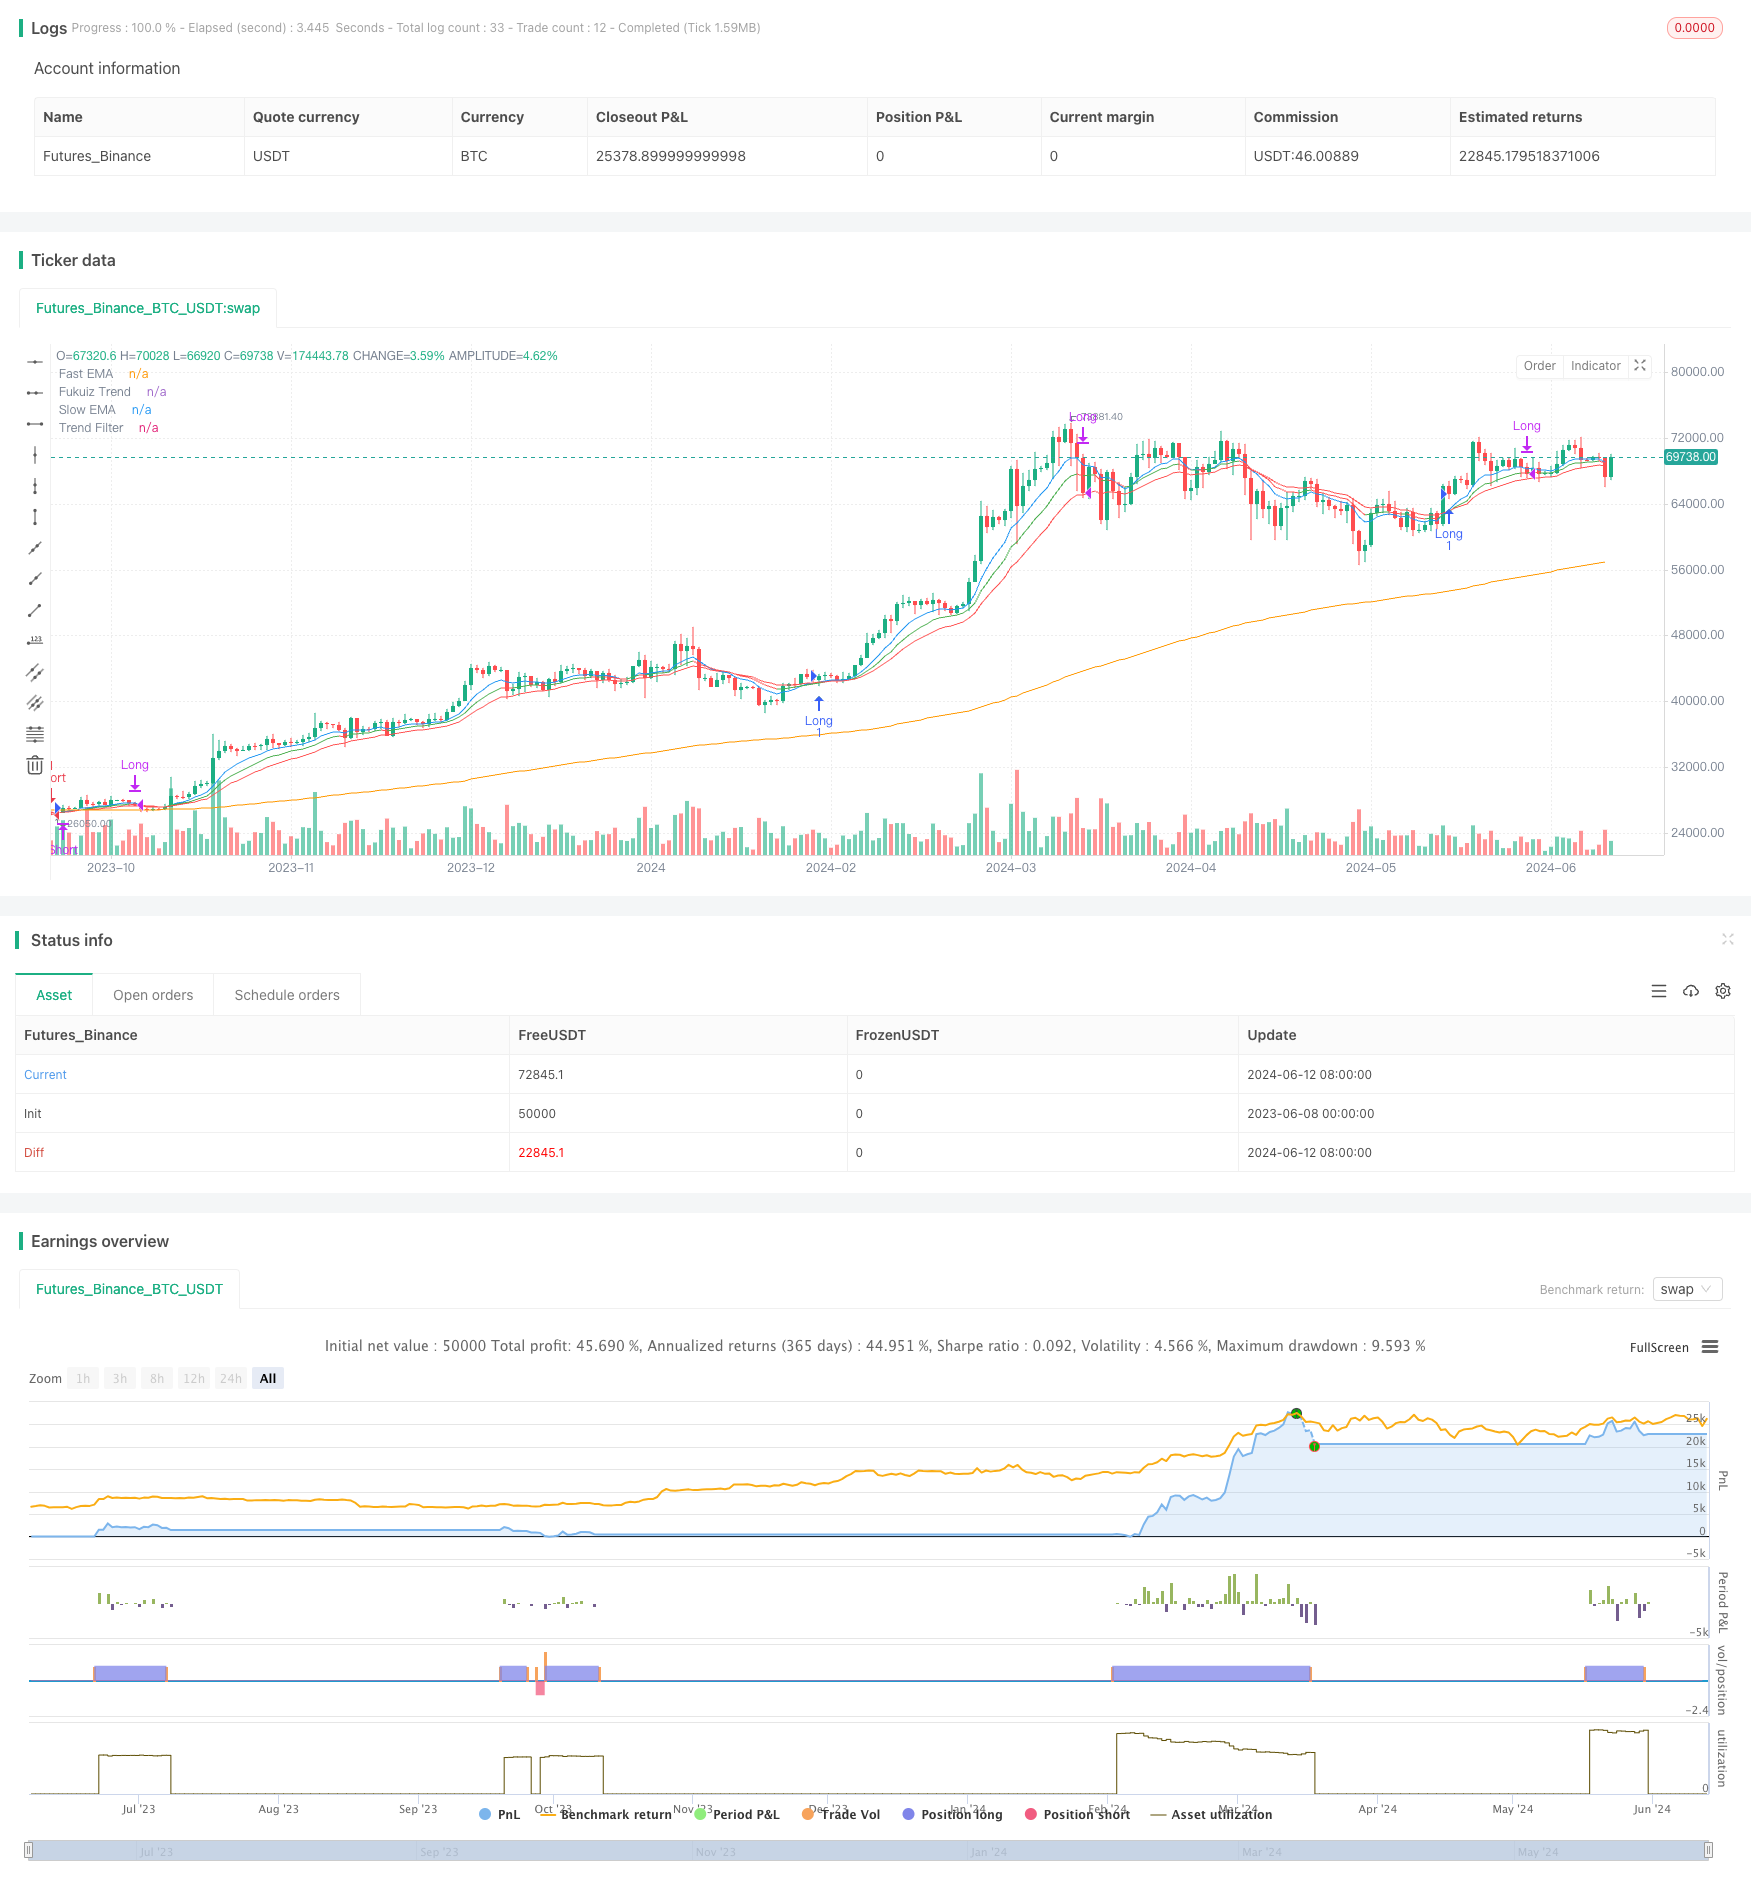
EMA Trend Filter Strategy
Author: ChaoZhang, Date: 2024-06-14 15:51:05Tags: EMAstdevTrend

Overview
This strategy uses three exponential moving averages (EMAs) with different periods to determine market trends and generate buy/sell signals. The crossovers between the fast EMA, slow EMA, and trend filter EMA, along with the price position relative to the trend filter EMA, form the core logic of this strategy. Additionally, the Fukuiz trend indicator is introduced as an auxiliary judgment, which triggers position closing under certain conditions.
Strategy Principle
- Calculate three EMAs with different periods: fast EMA (default 9 periods), slow EMA (default 21 periods), and trend filter EMA (default 200 periods).
- Calculate the 20-period standard deviation of price to measure market volatility.
- Introduce the Fukuiz trend indicator (default 14-period EMA) and determine its color based on its relationship with the previous period (green for upward, red for downward).
- Generate a buy signal when the fast EMA crosses above the slow EMA, the fast EMA is higher than the slow EMA, and the price is above the trend filter EMA.
- Generate a sell signal when the fast EMA crosses below the slow EMA, the fast EMA is lower than the slow EMA, and the price is below the trend filter EMA.
- When holding a long position, if the Fukuiz trend indicator turns red, close the long position.
- When holding a short position, if the Fukuiz trend indicator turns green, close the short position.
Advantage Analysis
- The combination of multiple-period EMAs can effectively capture market trends.
- The introduction of the Fukuiz trend indicator provides an additional basis for trend judgment and acts as a stop-loss in certain situations.
- The parameters are adjustable, making the strategy highly adaptable and optimizable for different markets and timeframes.
Risk Analysis
- EMAs are inherently lagging indicators, which may result in delayed signals during rapid market reversals.
- The long period of the trend filter EMA may cause the strategy to miss some short-term trends.
- The position closing logic based on the Fukuiz trend indicator may lead to premature stop-losses, missing out on subsequent trends.
Optimization Direction
- Optimize the period parameters of each EMA to find the most suitable combination for the current market.
- Introduce other auxiliary indicators, such as RSI and MACD, to provide more entry and exit bases.
- Optimize the stop-loss logic of the Fukuiz trend indicator, such as adding a buffer zone to avoid premature stop-losses.
- Consider incorporating position management and risk control modules to improve the strategy’s stability and risk resistance.
Summary
This strategy constructs a relatively complete trend judgment and trading framework by combining multiple-period EMAs and the Fukuiz trend indicator. The strategy logic is clear, the parameters are adjustable, and the adaptability is strong. However, it also has some potential risks, such as signal lag and trend judgment deviation. In the future, the strategy can be further refined in terms of parameter optimization, indicator combination, and risk management.
/*backtest
start: 2023-06-08 00:00:00
end: 2024-06-13 00:00:00
period: 1d
basePeriod: 1h
exchanges: [{"eid":"Futures_Binance","currency":"BTC_USDT"}]
*/

//@version=5
strategy("EvilRed Trading Indicator Trend Filter", overlay=true)

// Parameters Definition
fastLength = input(9, title="Fast EMA Length")
slowLength = input(21, title="Slow EMA Length")
trendFilterLength = input(200, title="Trend Filter EMA Length")

// Moving Averages Calculation
fastEMA = ta.ema(close, fastLength)
slowEMA = ta.ema(close, slowLength)
trendEMA = ta.ema(close, trendFilterLength)

// Volatility Calculation
volatility = ta.stdev(close, 20)

// Add Fukuiz Trend Indicator
fukuizTrend = ta.ema(close, 14)
fukuizColor = fukuizTrend > fukuizTrend[1] ? color.green : color.red
plot(fukuizTrend, color=fukuizColor, title="Fukuiz Trend")

// Plotting Moving Averages
plot(fastEMA, color=color.blue, title="Fast EMA")
plot(slowEMA, color=color.red, title="Slow EMA")
plot(trendEMA, color=color.orange, title="Trend Filter")

// Plotting Buy and Sell Signals
buySignal = ta.crossover(fastEMA, slowEMA) and fastEMA > slowEMA and close > trendEMA
sellSignal = ta.crossunder(fastEMA, slowEMA) and fastEMA < slowEMA and close < trendEMA

// Entry and Exit Conditions
if (strategy.position_size > 0 and fukuizColor == color.red)
    strategy.close("Long", comment="Fukuiz Trend is Red")

if (strategy.position_size < 0 and fukuizColor == color.green)
    strategy.close("Short", comment="Fukuiz Trend is Green")

if (buySignal)
    strategy.entry("Long", strategy.long)

if (sellSignal)
    strategy.entry("Short", strategy.short)


plotshape(buySignal, style=shape.triangleup, location=location.belowbar, color=color.green, size=size.small, title="Buy Signal")
plotshape(sellSignal, style=shape.triangledown, location=location.abovebar, color=color.red, size=size.small, title="Sell Signal")
- Multi-Level Quantitative Trading Strategy Based on Bollinger Bands Trend Divergence
- SuperB
- Multi-EMA Crossover Trend Following Strategy
- Dynamic Filtering EMA Cross Strategy for Daily Trend Analysis
- Enhanced Bollinger Mean Reversion Quantitative Strategy
- Liquidity-Weighted Moving Average Momentum Crossover Strategy
- Multi-Period Trend Following Trading System Based on EMA Volatility Bands
- Bollinger Bands Momentum Breakout Adaptive Trend Following Strategy
- Dual EMA Momentum Trend Trading Strategy with Full Body Candle Signal System
- EMA Crossover with Short-term Signals Strategy
- EMA Dynamic Stop-Loss Trading Strategy
- RSI, MACD, Bollinger Bands and Volume-Based Hybrid Trading Strategy
- ZLSMA-Enhanced Chandelier Exit Strategy with Volume Spike Detection
- Short-term Quantitative Trading Strategy Based on Dual Moving Average Crossover, RSI, and Stochastic Indicators
- RSI Low Point Reversal Strategy
- Fisher Transform Dynamic Threshold Trend Following Strategy
- Mean Reversion Strategy
- EMA100 and NUPL Relative Unrealized Profit Quantitative Trading Strategy
- Volatility Range Trading Strategy Based on Stochastic Oscillator
- Simple Combined Strategy: Pivot Point SuperTrend and DEMA
- Moving Average Crossover Strategy
- Intraday Breakout Strategy Based on 3-Minute Candle High Low Points
- Advanced Entry Strategy based on Moving Average, Support/Resistance, and Volume
- EMA RSI MACD Dynamic Take Profit and Stop Loss Trading Strategy
- G-Trend EMA ATR Intelligent Trading Strategy
- Trend Following Strategy Based on 200-Day Moving Average and Stochastic Oscillator
- RSI Trend Strategy
- EMA Crossover Momentum Scalping Strategy
- BB Breakout Strategy
- VWAP and RSI Dynamic Bollinger Bands Take Profit and Stop Loss Strategy