Multi-Indicator Intelligent Pyramiding Strategy
Author: ChaoZhang, Date: 2024-07-30 17:25:13Tags: RSIATRRSI
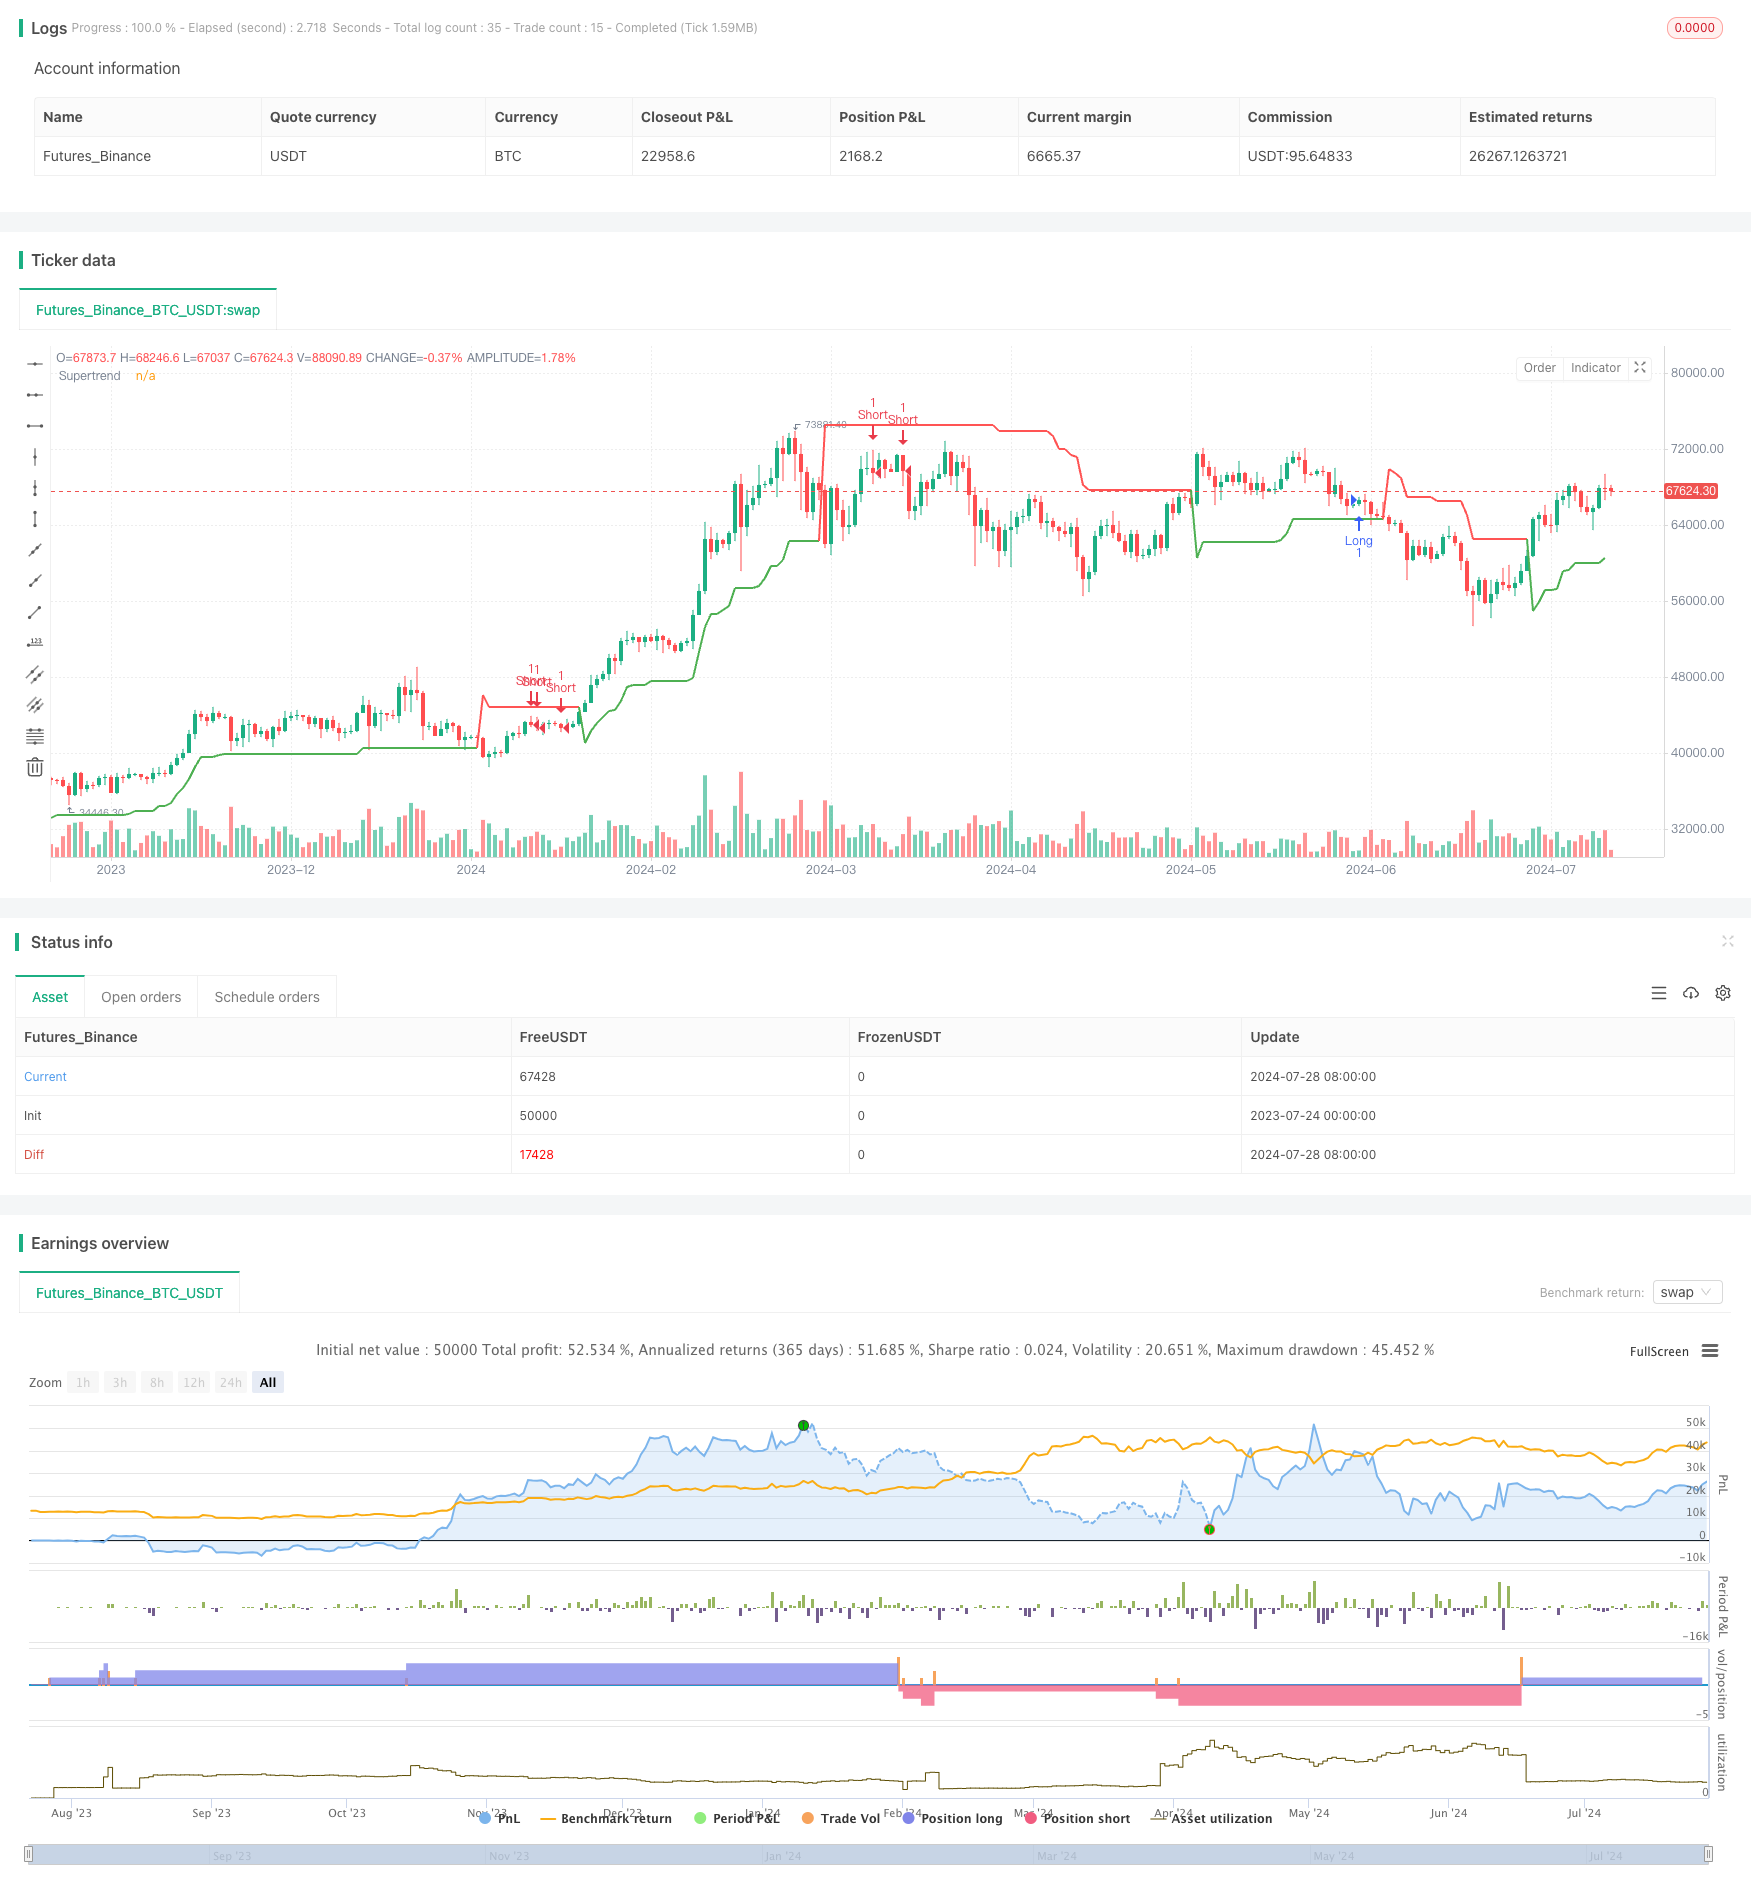
Overview
This strategy is a multi-indicator intelligent pyramiding trading system that combines multiple technical indicators including Supertrend, RSI, and volume to optimize trading performance through pyramiding and a 1:2 take profit ratio. The strategy primarily identifies potential trading opportunities through Supertrend trend determination, RSI overbought/oversold signals, and volume changes, while utilizing pyramiding to increase profit potential and implementing dynamic stop-loss and a 1:2 take profit ratio for risk control. This multi-dimensional analysis approach aims to improve trading accuracy and profitability while optimizing overall trading performance through intelligent position management.
Strategy Principles
Supertrend Indicator: Used to determine overall market trends, serving as the main trade signal generator.
RSI Indicator: Used to identify overbought and oversold conditions, acting as an auxiliary trade signal.
Volume Analysis: Confirms signal strength by comparing current volume with the previous period’s volume and price trends (bullish or bearish).
Entry Conditions:
- Long: Supertrend direction is down (direction == -1), RSI below oversold level, bullish volume (close > open), and volume greater than previous period.
- Short: Supertrend direction is up (direction == 1), RSI above overbought level, bearish volume (close < open), and volume greater than previous period.
Stop Loss: Uses the Supertrend line as a dynamic stop loss point.
Take Profit Strategy: Employs a 1:2 risk-reward ratio, setting the take profit point at twice the distance from entry to stop loss.
Pyramiding: Allows up to 3 additional entries (pyramiding=3) to capture more profit in strong trends.
Strategy Advantages
Multi-dimensional Analysis: Combines trend, momentum, and volume indicators to increase trade signal reliability.
Dynamic Risk Management: Uses Supertrend as a dynamic stop loss, adjusting protection levels with market fluctuations.
Optimized Risk-Reward Ratio: Adopts a 1:2 take profit ratio, favorable for long-term profitability.
Flexible Position Management: Expands profit potential in strong trends through pyramiding.
High Adaptability: Can be adjusted to suit different market environments and trading instruments through parameter tuning.
Comprehensive Market Perspective: Captures market dynamics holistically by analyzing trends, overbought/oversold conditions, and volume.
Strategy Risks
Overtrading Risk: Multiple indicators may lead to frequent trading, increasing transaction costs.
False Breakout Risk: Frequent false signals may occur in ranging markets.
Pyramiding Risk: Additional entries during trend reversals may result in larger losses.
Parameter Sensitivity: Multiple indicator parameters require fine-tuning; improper settings may affect strategy performance.
Market Environment Dependency: May underperform in low volatility or trendless markets.
Slippage Risk: Frequent trading and stop loss/take profit orders may be affected by slippage.
Strategy Optimization Directions
Introduce Trend Strength Filtering: Consider adding ADX indicator to open positions only in strong trends, reducing false breakouts.
Optimize Pyramiding Logic: Set dynamic conditions for additional entries, such as requiring more extreme RSI values for each entry.
Add Time Filtering: Consider market time characteristics to avoid high volatility periods at market open and close.
Incorporate Volatility Adaptation: Dynamically adjust stop loss and take profit levels based on ATR to adapt to different volatility environments.
Enhance Volume Conditions: Consider using moving average volume as a reference instead of simply comparing to the previous period.
Implement Market Regime Recognition: Apply different trading logic under various market states (trending, ranging).
Introduce Machine Learning: Use machine learning algorithms to dynamically optimize indicator parameters, improving strategy adaptability.
Conclusion
The Multi-Indicator Intelligent Pyramiding Strategy is a comprehensive and logically rigorous trading system. By combining Supertrend, RSI, and volume analysis, it thoroughly assesses market conditions and effectively identifies potential trading opportunities. The strategy’s pyramiding mechanism and 1:2 take profit ratio design both increase profit potential and ensure reasonable risk control. While the strategy does have certain risks, such as overtrading and parameter sensitivity, these issues can be effectively mitigated through ongoing optimization and risk management measures. In the future, by introducing more intelligent filtering mechanisms, dynamic parameter adjustments, and machine learning technologies, this strategy has the potential to further enhance its adaptability and profitability. Overall, this is a quantitative trading strategy with a solid foundation and broad development potential, suitable for traders seeking to build complex trading systems based on technical analysis.
/*backtest
start: 2023-07-24 00:00:00
end: 2024-07-29 00:00:00
period: 1d
basePeriod: 1h
exchanges: [{"eid":"Futures_Binance","currency":"BTC_USDT"}]
*/

//@version=5
strategy("Supertrend RSI Volume Strategy with Pyramiding and 1:2 Take Profit", overlay=true, pyramiding=3)

// Supertrend Parameters
atrPeriod = input(10, title="ATR Period")
factor = input(3.0, title="Factor")
[supertrend, direction] = ta.supertrend(factor, atrPeriod)

// RSI Parameters
rsiPeriod = input(14, title="RSI Period")
overbought = input(50, title="RSI Overbought Level")
oversold = input(50, title="RSI Oversold Level")
rsi = ta.rsi(close, rsiPeriod)

// Volume Parameters
volumeGreaterThanPrevious = volume > volume[1]
bearishVolume = close < open
bullishVolume = close > open

// Entry Conditions
longCondition = direction == -1 and rsi < oversold and bullishVolume and volumeGreaterThanPrevious
shortCondition = direction == 1 and rsi > overbought and bearishVolume and volumeGreaterThanPrevious

// Calculate Stop Loss and Take Profit
longStopLoss = supertrend
shortStopLoss = supertrend
longTakeProfit = close + (close - longStopLoss)
shortTakeProfit = close - (shortStopLoss - close)

// Plotting Supertrend
plot(supertrend, color=color.new(direction == -1 ? color.green : color.red, 1), linewidth=2, title="Supertrend")

// Entry and Exit Signals with Pyramiding
if (longCondition)
    strategy.entry("Long", strategy.long)
    strategy.exit("Take Profit", "Long", limit=longTakeProfit, stop=longStopLoss)

if (shortCondition)
    strategy.entry("Short", strategy.short)
    strategy.exit("Take Profit", "Short", limit=shortTakeProfit, stop=shortStopLoss)
- RSI Trend Reversal Strategy
- Dual Timeframe Supertrend with RSI Optimization System
- RSI Trend Reversal Trading Strategy with ATR Stop Loss and Trading Zone Control
- Dual Timeframe Supertrend RSI Intelligent Trading Strategy
- Multi-Level Dynamic Trend Following System
- Turnaround Tuesday Strategy (Weekend Filter)
- RSI-ATR Momentum Volatility Combined Trading Strategy
- RSI-Bollinger Bands Integration Strategy: A Dynamic Self-Adaptive Multi-Indicator Trading System
- Han Yue - Trend Following Trading Strategy Based on Multiple EMAs, ATR and RSI
- Multi-Timeframe Quantitative Trading Strategy Based on EMA-Smoothed RSI and ATR Dynamic Stop-Loss/Take-Profit
- Optimized Multi-Timeframe HMA Quantitative Trading Strategy with Dynamic Stop-Loss
- Bollinger Band Crossover with Slippage and Price Impact Combined Strategy
- Trend Structure Break with Order Block and Fair Value Gap Strategy
- Adaptive Dynamic Stop-Loss and Take-Profit Strategy with SMA Crossover and Volume Filter
- Dual MACD Trend Confirmation Trading System
- High/Low Breakout Strategy with Alpha Trend and Moving Average Filter
- Multi-Candlestick Pattern Recognition and Trading Strategy
- Multi-EMA Crossover Strategy with Trend Confirmation
- Momentum-Driven EMA-RSI Crossover Strategy
- Multi-Indicator Dynamic Trading Strategy
- Multi-EMA Crossover Momentum Strategy
- Multi-Order Breakout Trend Following Strategy
- Multi-EMA Crossover with Time Interval Integration Strategy
- Dual Moving Average Crossover Confirmation Strategy with Volume-Price Integration Optimization Model
- Dual Dynamic Indicator Optimization Strategy
- VWAP Crossover Dynamic Profit Target Trading Strategy
- Bollinger Bands Breakout Quantitative Trading Strategy
- Fibonacci Extension and Retracement Channel Breakout Strategy
- Multi-Dimensional Order Flow Analysis and Trading Strategy
- Multi-Moving Average Trend Following and Reversal Pattern Recognition Strategy