Multi-Timeframe Unified Strategy Based on Quantitative Momentum and Convergence-Divergence
Author: ChaoZhang, Date: 2024-07-31 11:33:59Tags: EMASMAMACDBBKC
Overview
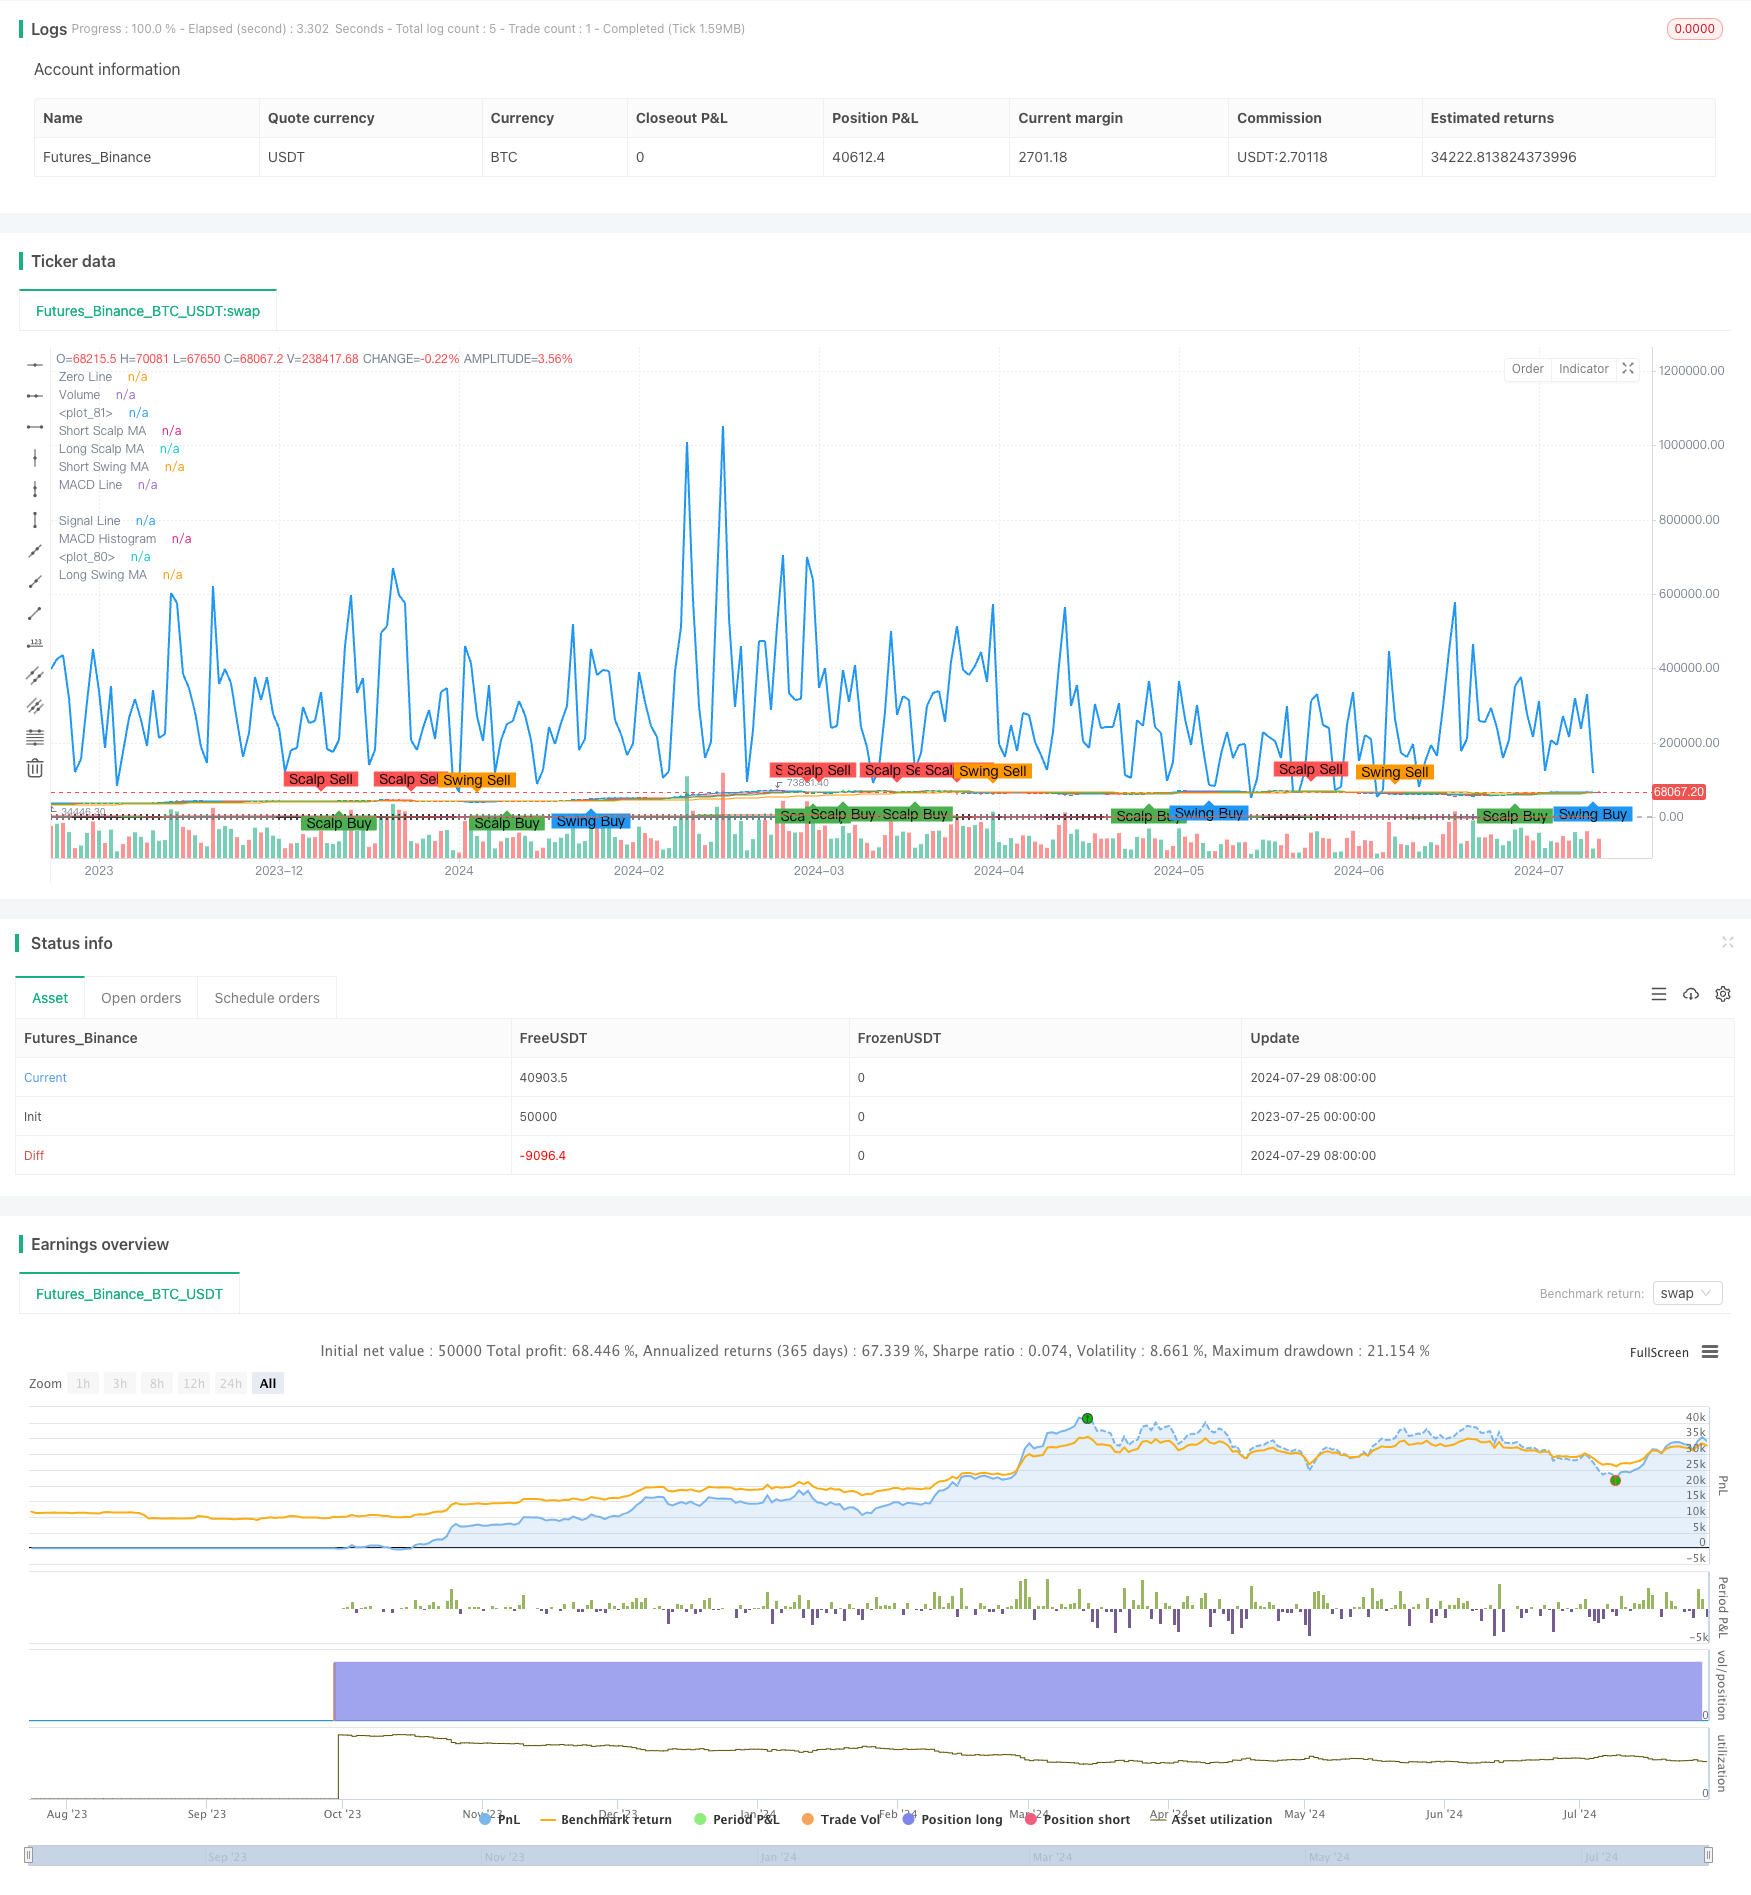
This unified strategy combines short-term and long-term trading methods, utilizing multiple technical indicators to capture market momentum and volatility. The core of the strategy is to identify potential trading opportunities by analyzing moving average crossovers across different timeframes, a squeeze momentum indicator, and the MACD oscillator. It aims to adapt to various market conditions, providing traders with a flexible approach to trading.
Strategy Principles
The fundamental principle of this strategy is to identify favorable trading conditions by integrating multiple technical analysis tools:
Moving Average Crossovers:
- Short-term trading uses 5-period and 15-period Exponential Moving Averages (EMA)
- Long-term trading uses 20-period and 50-period Simple Moving Averages (SMA) Buy signals are generated when the short-term MA crosses above the long-term MA, and sell signals when it crosses below.
Squeeze Momentum Indicator:
- Combines Bollinger Bands and Keltner Channels to identify periods of low volatility (squeeze) and high volatility (release)
- Uses momentum values with color-coded bars to indicate increasing or decreasing momentum
- Squeeze conditions are displayed with blue (no squeeze), black (squeeze on), and gray (squeeze off) colors
MACD Oscillator:
- Plots MACD Line, Signal Line, and MACD Histogram for additional momentum analysis
Volume Indicator:
- Plots volume bars to help identify trading volume trends
The strategy logic combines these indicators: - Enters a long position for short-term trading when the short-term EMA crosses above the long-term EMA and the Squeeze Momentum Indicator shows positive momentum - Closes the short-term position when the short-term EMA crosses below the long-term EMA - Enters a long position for long-term trading when the short-term SMA crosses above the long-term SMA and the Squeeze Momentum Indicator shows positive momentum - Closes the long-term position when the short-term SMA crosses below the long-term SMA
Strategy Advantages
Multi-timeframe Analysis: By combining short-term and long-term moving averages, the strategy can capture market trends across different time scales, increasing trading flexibility and adaptability.
Volatility and Momentum Integration: The Squeeze Momentum Indicator provides valuable insights into market volatility and momentum, helping traders identify potential breakouts and trend initiations.
Confirmation Signals: The strategy uses multiple indicators (moving averages, squeeze momentum, MACD) to confirm trading signals, potentially reducing false signals.
Customizability: Strategy parameters (such as moving average periods, Bollinger Bands and Keltner Channel lengths and multipliers) can be adjusted to suit individual preferences and different market conditions.
Risk Management: By exiting trades on moving average crossovers, the strategy provides clear exit rules, helping to manage risk.
Comprehensive Market View: The combination of price action, volatility, momentum, and volume analysis provides a comprehensive view of the market for trading decisions.
Strategy Risks
Overtrading: In highly volatile markets, frequent moving average crossovers may lead to overtrading, increasing transaction costs.
Lagging Nature: Indicators like moving averages and MACD are inherently lagging and may miss important turning points in rapidly changing markets.
False Breakouts: The strategy may be susceptible to false breakouts in ranging markets, leading to unnecessary trades.
Parameter Sensitivity: The strategy’s performance is highly dependent on the chosen parameters, which may need to be different for various market conditions.
Directional Bias: The current strategy only focuses on long trades, potentially missing out on short opportunities.
Lack of Fundamental Considerations: The strategy is entirely based on technical analysis, ignoring fundamental factors that may influence the market.
To mitigate these risks, consider the following approaches: - Implement additional filters to reduce false signals, such as requiring moving average crossovers to persist for a specific number of periods - Incorporate other technical indicators or fundamental analysis to confirm trading signals - Use adaptive parameters to adjust to different market conditions - Add short trading logic to balance the strategy - Implement strict risk management rules, such as stop-losses and profit targets
Strategy Optimization Directions
Dynamic Parameter Adjustment: Implement adaptive moving average periods and squeeze momentum indicator parameters to better suit different market conditions. This can be achieved by using volatility indicators like ATR to dynamically adjust parameters.
Market Regime Integration: Develop a market regime classification system to adjust strategy behavior based on the current market state (trending, ranging, or high volatility). This can help the strategy maintain robustness across different market environments.
Improved Entry Timing: Use price action patterns or additional indicators (such as Relative Strength Index - RSI) to optimize entry timing, potentially reducing false signals.
Implement Dynamic Position Sizing: Adjust position sizes based on market volatility and the strength of the current trading signal to optimize risk-reward ratios.
Add Short Trading Logic: Expand the strategy to include short trades, capitalizing on more market opportunities.
Multi-instrument Correlation Analysis: If trading across multiple instruments, consider implementing correlation analysis to diversify risk and identify potential arbitrage opportunities.
Machine Learning Integration: Use machine learning algorithms to optimize parameter selection or predict signal reliability, enhancing overall strategy performance.
Backtesting and Forward Testing: Conduct extensive backtesting and forward testing to evaluate strategy performance under different market conditions and identify potential overfitting.
Risk Management Enhancements: Implement more sophisticated risk management techniques such as dynamic stop-losses, trailing stops, or volatility-based exit strategies.
Time Filters: Add time-based filters to avoid trading during low liquidity or high volatility periods.
By implementing these optimizations, the strategy can improve its adaptability, robustness, and overall performance. However, it’s important to approach each improvement cautiously and validate its effectiveness through thorough testing.
Summary
The Multi-Timeframe Unified Strategy Based on Quantitative Momentum and Convergence-Divergence is a comprehensive trading system that combines short-term and long-term trading techniques. By integrating moving average crossovers, squeeze momentum indicators, and MACD analysis, the strategy aims to capture trading opportunities across various market conditions. Its main strengths lie in its multi-timeframe analysis, integration of momentum and volatility, and customizability. However, traders should be aware of potential risks such as overtrading, false signals, and parameter sensitivity.
To further enhance the strategy, considerations can be made for implementing dynamic parameter adjustments, market regime recognition, and improved risk management techniques. Additionally, expanding to short trading and integrating machine learning techniques may provide additional optimization opportunities.
Ultimately, this unified strategy offers traders a powerful framework that can be customized according to individual risk tolerance and market views. However, as with all trading strategies, thorough backtesting and ongoing monitoring are crucial before deploying in live trading. With continuous optimization and risk management, the strategy has the potential to produce consistent results across various market environments.
/*backtest
start: 2023-07-25 00:00:00
end: 2024-07-30 00:00:00
period: 1d
basePeriod: 1h
exchanges: [{"eid":"Futures_Binance","currency":"BTC_USDT"}]
*/

//@version=5
strategy("Combined Scalping and Swing Trading Strategy with Squeeze Momentum", overlay=true)

// Shorter Moving Averages for Scalping
shortScalpMA = ta.ema(close, 5)
longScalpMA = ta.ema(close, 15)

// Longer Moving Averages for Swing Trading
shortSwingMA = ta.sma(close, 20)
longSwingMA = ta.sma(close, 50)

// Plot Moving Averages
plot(shortScalpMA, color=color.blue, title="Short Scalp MA")
plot(longScalpMA, color=color.red, title="Long Scalp MA")
plot(shortSwingMA, color=color.green, title="Short Swing MA")
plot(longSwingMA, color=color.orange, title="Long Swing MA")

// Buy and Sell Signals for Scalping
scalpBuySignal = ta.crossover(shortScalpMA, longScalpMA)
scalpSellSignal = ta.crossunder(shortScalpMA, longScalpMA)

// Buy and Sell Signals for Swing Trading
swingBuySignal = ta.crossover(shortSwingMA, longSwingMA)
swingSellSignal = ta.crossunder(shortSwingMA, longSwingMA)

// Plot Buy and Sell Signals
plotshape(series=scalpBuySignal, location=location.belowbar, color=color.green, style=shape.labelup, text="Scalp Buy")
plotshape(series=scalpSellSignal, location=location.abovebar, color=color.red, style=shape.labeldown, text="Scalp Sell")
plotshape(series=swingBuySignal, location=location.belowbar, color=color.blue, style=shape.labelup, text="Swing Buy")
plotshape(series=swingSellSignal, location=location.abovebar, color=color.orange, style=shape.labeldown, text="Swing Sell")

// Custom Oscillator (using MACD)
[macdLine, signalLine, _] = ta.macd(close, 12, 26, 9)
macdHist = macdLine - signalLine

// Plot MACD
hline(0, "Zero Line", color=color.gray)
plot(macdLine, color=color.green, title="MACD Line")
plot(signalLine, color=color.red, title="Signal Line")
plot(macdHist, color=color.blue, style=plot.style_histogram, title="MACD Histogram")

// Volume
plot(volume, color=color.blue, title="Volume", linewidth=2)

// Squeeze Momentum Indicator [LazyBear]
// BB and KC Length and Multipliers
lengthBB = input.int(20, title="BB Length")
multBB = input.float(2.0, title="BB MultFactor")
lengthKC = input.int(20, title="KC Length")
multKC = input.float(1.5, title="KC MultFactor")
useTrueRange = input.bool(true, title="Use TrueRange (KC)")

// Calculate Bollinger Bands
basis = ta.sma(close, lengthBB)
dev = multBB * ta.stdev(close, lengthBB)
upperBB = basis + dev
lowerBB = basis - dev

// Calculate Keltner Channels
maKC = ta.sma(close, lengthKC)
rangeKC = useTrueRange ? ta.tr(true) : (high - low)
rangeKCMA = ta.sma(rangeKC, lengthKC)
upperKC = maKC + rangeKCMA * multKC
lowerKC = maKC - rangeKCMA * multKC

// Squeeze Conditions
sqzOn = (lowerBB > lowerKC) and (upperBB < upperKC)
sqzOff = (lowerBB < lowerKC) and (upperBB > upperKC)
noSqz = not sqzOn and not sqzOff

// Momentum Value
avgPrice = (ta.highest(high, lengthKC) + ta.lowest(low, lengthKC)) / 2
val = ta.linreg(close - avgPrice, lengthKC, 0)

// Bar Colors
bcolor = val > 0 ? (val > nz(val[1]) ? color.lime : color.green) : (val < nz(val[1]) ? color.red : color.maroon)
scolor = noSqz ? color.blue : sqzOn ? color.black : color.gray

// Plot Squeeze Momentum
plot(val, color=bcolor, style=plot.style_histogram, linewidth=4)
plot(0, color=scolor, style=plot.style_cross, linewidth=2)

// Strategy Logic
if (scalpBuySignal and not noSqz and val > 0)
    strategy.entry("Scalp Buy", strategy.long)
if (scalpSellSignal and not noSqz and val < 0)
    strategy.close("Scalp Buy")

if (swingBuySignal and not noSqz and val > 0)
    strategy.entry("Swing Buy", strategy.long)
if (swingSellSignal and not noSqz and val < 0)
    strategy.close("Swing Buy")
- MACD BB Breakout Strategy
- Multi-Indicator Comprehensive Trading Strategy: Perfect Combination of Momentum, Overbought/Oversold, and Volatility
- Multi-Technical Indicator Synergistic Trading System
- No Upper Wick Bullish Candle Breakout Strategy
- Multi-Indicator Dynamic Stop-Loss Momentum Trend Trading Strategy
- Enhanced Mean Reversion Strategy with MACD-ATR Implementation
- Multi-Indicator Trend Momentum Trading Strategy: An Optimized Quantitative Trading System Based on Bollinger Bands, Fibonacci and ATR
- Multi-Indicator Synergistic Trading Strategy with Bollinger Bands, Fibonacci, MACD and RSI
- Multi-Indicator Adaptive Trading Strategy Based on RSI, MACD and Volume
- Bollinger Bands and Exponential Moving Average Crossover Trading Strategy
- Multi-Layer Volatility Band Trading Strategy
- Multi-Period Moving Average Crossover Strategy with Dynamic Volatility Filter
- Multi-Indicator Comprehensive Momentum Trading Strategy
- Triple EMA with Dynamic Support/Resistance Trading Strategy
- Dual RSI Strategy: Advanced Trend Capture System Combining Divergence and Crossover
- Lorenzian Classification Multi-Timeframe Target Strategy
- Dual Moving Average Trend Capture Strategy with Dynamic Stop-Loss and Filter
- Multi-Indicator Trend Following with Volume Confirmation Strategy
- Adaptive Quantitative Trading Strategy with Dual Moving Average Crossover and Take Profit/Stop Loss
- Elliott Wave and Tom DeMark Trend-Following Trading Strategy
- RSI Oversold Periodic Investment Strategy with Cooldown Optimization
- Optimized Multi-Timeframe HMA Quantitative Trading Strategy with Dynamic Stop-Loss
- Bollinger Band Crossover with Slippage and Price Impact Combined Strategy
- Trend Structure Break with Order Block and Fair Value Gap Strategy
- Adaptive Dynamic Stop-Loss and Take-Profit Strategy with SMA Crossover and Volume Filter
- Dual MACD Trend Confirmation Trading System
- High/Low Breakout Strategy with Alpha Trend and Moving Average Filter
- Multi-Candlestick Pattern Recognition and Trading Strategy
- Multi-EMA Crossover Strategy with Trend Confirmation
- Momentum-Driven EMA-RSI Crossover Strategy