Multi-Zone RSI Trading Strategy
Author: ChaoZhang, Date: 2024-09-26 15:27:00Tags: RSITPSL
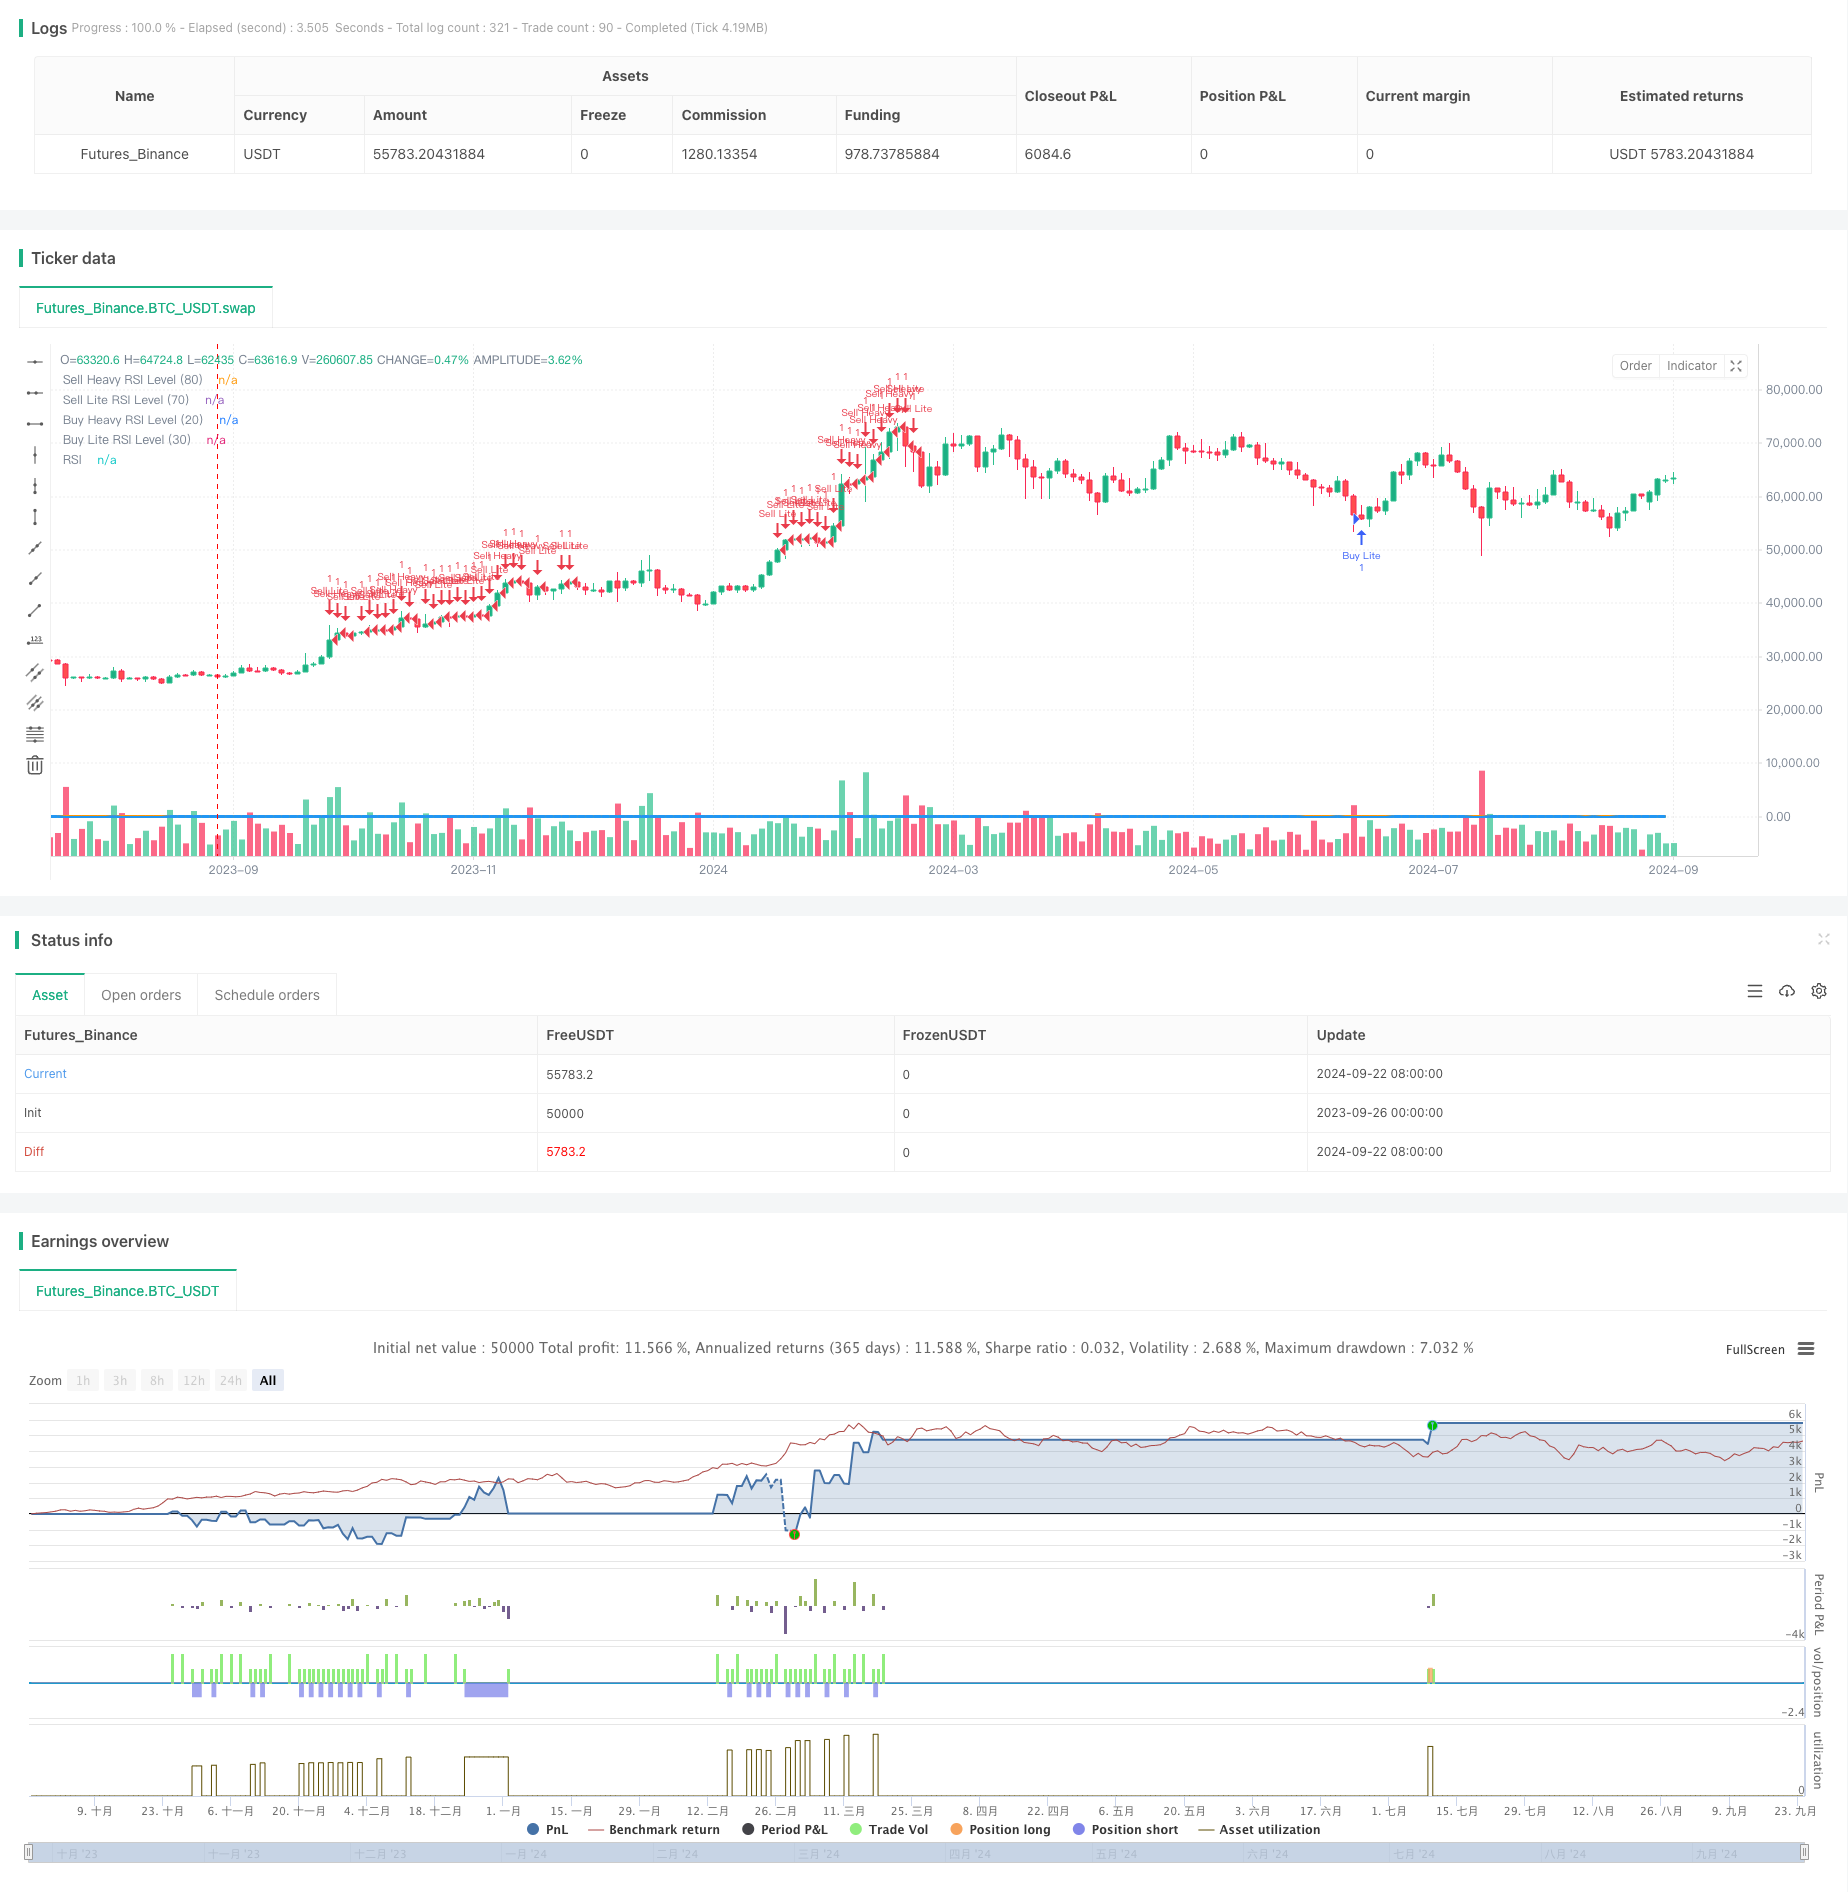
#### Overview
The Multi-Zone RSI Trading Strategy is an automated trading system based on the Relative Strength Index (RSI), designed for the 5-minute chart. This strategy triggers buy and sell signals of varying intensities by dividing the RSI into multiple zones, while incorporating take profit and stop loss mechanisms for risk management. This approach allows traders to flexibly adjust positions based on market overbought and oversold conditions, with the potential to capture short-term price movements in volatile markets.
Strategy Principles
The core of this strategy is to use the RSI indicator to trigger trading signals at different levels:
Buy Signals:
- RSI < 20: Triggers a “Heavy Buy”
- RSI between 20-30: Triggers a “Lite Buy”
Sell Signals:
- RSI > 80: Triggers a “Heavy Sell”
- RSI between 70-80: Triggers a “Lite Sell”
Each trade is set with fixed take profit and stop loss levels to protect profits and limit potential losses. The strategy also includes alert functions to notify traders when RSI reaches critical levels.
Strategy Advantages
Multi-level Entry: By distinguishing between “Heavy” and “Lite” trading signals, the strategy can adjust position sizes based on the strength of market overbought/oversold conditions.
Risk Management: Built-in take profit and stop loss mechanisms help automate risk control, preventing excessive losses from single trades.
Highly Customizable: Traders can adjust RSI levels, take profit and stop loss points, and other parameters according to personal risk preferences and market conditions.
Real-time Alerts: The strategy sets multiple alert trigger points, helping traders stay informed of market movements, providing valuable market insights even when not actually executing automated trades.
High Adaptability: The strategy is applicable to various financial instruments, particularly suitable for markets with higher volatility.
Strategy Risks
False Breakout Risk: In range-bound markets, RSI may frequently cross the set thresholds, leading to excessive trading and potential losses.
Performance in Trending Markets: In strong trends, the strategy may close positions too early or miss significant moves, as RSI may remain in overbought or oversold territories for extended periods.
Parameter Sensitivity: The strategy’s performance is highly dependent on RSI parameters and entry thresholds; improper settings may lead to poor performance.
Slippage Risk: In fast-moving markets, actual execution prices may significantly differ from expected, affecting the effectiveness of take profit and stop loss orders.
Overtrading: Frequent trading signals may result in high transaction costs, eroding potential profits.
Strategy Optimization Directions
Introduce Trend Filters: Incorporate moving averages or other trend indicators to avoid counter-trend trading in strong trends.
Dynamic Take Profit and Stop Loss: Automatically adjust take profit and stop loss levels based on market volatility to adapt to different market environments.
Time Filtering: Add trading time window restrictions to avoid low liquidity periods or important news release times.
Quantitative Analysis Optimization: Use backtesting data for Monte Carlo simulations to find optimal parameter combinations.
Combine with Other Technical Indicators: Such as MACD or Bollinger Bands, to increase confirmation mechanisms for trading signals.
Position Management Optimization: Implement dynamic position sizing based on account balance and market volatility.
Conclusion
The Multi-Zone RSI Trading Strategy provides traders with a systematic trading method based on market momentum. By subdividing RSI levels and introducing multi-level trading signals, the strategy aims to capture short-term market fluctuations while managing risk through take profit and stop loss mechanisms. While the strategy offers high customizability and potential profitability, traders need to be aware of the challenges in parameter optimization and market adaptability. By introducing additional filtering mechanisms and dynamic risk management, this strategy has the potential to become a powerful automated trading tool. However, as with all trading strategies, it should be used cautiously in live trading and subjected to thorough backtesting and forward testing.
/*backtest
start: 2023-09-26 00:00:00
end: 2024-09-24 08:00:00
period: 2d
basePeriod: 2d
exchanges: [{"eid":"Futures_Binance","currency":"BTC_USDT"}]
*/

//@version=5
strategy("M5 Trading Rule", overlay=true)

// Copyright © 2024 TRADINGWITHKAY. All rights reserved.
// Unauthorized use, distribution, and modification of this code are strictly prohibited.

// Input parameters
rsiLength = input(14, title="RSI Length")
rsiOverboughtHeavy = input(80, title="RSI Sell Heavy Level")
rsiOverboughtLite = input(70, title="RSI Sell Lite Level")
rsiOversoldHeavy = input(20, title="RSI Buy Heavy Level")
rsiOversoldLite = input(30, title="RSI Buy Lite Level")
takeProfitPips = input(50, title="Take Profit (Pips)")
stopLossPips = input(50, title="Stop Loss (Pips)")
pipValue = syminfo.mintick * 10 // Assuming 1 pip = 0.0001 for Forex

// Calculate RSI
rsi = ta.rsi(close, rsiLength)

// Convert pips to price distance
takeProfitPrice = takeProfitPips * pipValue
stopLossPrice = stopLossPips * pipValue

// Conditions for entries
buyHeavyCondition = rsi < rsiOversoldHeavy
buyLiteCondition = rsi < rsiOversoldLite and not buyHeavyCondition
sellHeavyCondition = rsi > rsiOverboughtHeavy
sellLiteCondition = rsi > rsiOverboughtLite and not sellHeavyCondition

// Plot the RSI levels for overbought and oversold zones
plot(rsiOverboughtHeavy, title="Sell Heavy RSI Level (80)", color=color.red, linewidth=2, style=plot.style_line)
plot(rsiOverboughtLite, title="Sell Lite RSI Level (70)", color=color.orange, linewidth=2, style=plot.style_line)
plot(rsiOversoldHeavy, title="Buy Heavy RSI Level (20)", color=color.green, linewidth=2, style=plot.style_line)
plot(rsiOversoldLite, title="Buy Lite RSI Level (30)", color=color.blue, linewidth=2, style=plot.style_line)

// Execute Buy Heavy
if (buyHeavyCondition)
    strategy.entry("Buy Heavy", strategy.long)
    // Separate Take Profit and Stop Loss
    strategy.exit("Take Profit", "Buy Heavy", limit=close + takeProfitPrice)
    strategy.exit("Stop Loss", "Buy Heavy", stop=close - stopLossPrice)
    alert("RSI is below 20! Buy Heavy Condition Triggered!", alert.freq_once_per_bar)

// Execute Buy Lite
if (buyLiteCondition)
    strategy.entry("Buy Lite", strategy.long)
    // Separate Take Profit and Stop Loss
    strategy.exit("Take Profit", "Buy Lite", limit=close + takeProfitPrice)
    strategy.exit("Stop Loss", "Buy Lite", stop=close - stopLossPrice)
    alert("RSI is below 30! Buy Lite Condition Triggered!", alert.freq_once_per_bar)

// Execute Sell Heavy
if (sellHeavyCondition)
    strategy.entry("Sell Heavy", strategy.short)
    // Separate Take Profit and Stop Loss
    strategy.exit("Take Profit", "Sell Heavy", limit=close - takeProfitPrice)
    strategy.exit("Stop Loss", "Sell Heavy", stop=close + stopLossPrice)
    alert("RSI is above 80! Sell Heavy Condition Triggered!", alert.freq_once_per_bar)

// Execute Sell Lite
if (sellLiteCondition)
    strategy.entry("Sell Lite", strategy.short)
    // Separate Take Profit and Stop Loss
    strategy.exit("Take Profit", "Sell Lite", limit=close - takeProfitPrice)
    strategy.exit("Stop Loss", "Sell Lite", stop=close + stopLossPrice)
    alert("RSI is above 70! Sell Lite Condition Triggered!", alert.freq_once_per_bar)

// Plot RSI on a separate chart for easier visibility
plot(rsi, title="RSI", color=color.blue, linewidth=2)

// Alert when price hits the high or low RSI levels
if (rsi <= rsiOversoldHeavy)
    alert("Price has reached the Buy Heavy RSI Level (20)!", alert.freq_once_per_bar)

if (rsi <= rsiOversoldLite and rsi > rsiOversoldHeavy)
    alert("Price has reached the Buy Lite RSI Level (30)!", alert.freq_once_per_bar)

if (rsi >= rsiOverboughtHeavy)
    alert("Price has reached the Sell Heavy RSI Level (80)!", alert.freq_once_per_bar)

if (rsi >= rsiOverboughtLite and rsi < rsiOverboughtHeavy)
    alert("Price has reached the Sell Lite RSI Level (70)!", alert.freq_once_per_bar)
- RSI-based Trading Strategy with Percentage-based Take Profit and Stop Loss
- RSI Low Point Reversal Strategy
- Dynamic RSI-Price Divergence Detection and Adaptive Trading Strategy System
- Dual Timeframe Stochastic Momentum Trading Strategy
- RSI and AO Synergistic Trend Following Quantitative Trading Strategy
- Multi-RSI-EMA Momentum Hedging Strategy with Position Scaling
- Multi-Target Intelligent Volume Momentum Trading Strategy
- Multi-Timeframe RSI Oversold Reversal Strategy
- Dual EMA Crossover with RSI Momentum Enhanced Trading Strategy
- Weighted Moving Average and Relative Strength Index Crossover Strategy with Risk Management Optimization System
- EMA, SMA, CCI, ATR, Perfect Order Moving Average Strategy with Trend Magic Indicator Auto-Trading System
- 52-Week High-Low/Average Volume/Volume Breakout Strategy
- Multi-EMA and CCI Crossover Trend Following Strategy
- Dynamic Trend-Following EMA Crossover Strategy
- Multi-Factor Dynamic Adaptive Trend Following Strategy
- Multi-Timeframe RSI Oversold Reversal Strategy
- Intelligent Institutional Trading Structure Momentum Strategy
- Gaussian Cross EMA Trend Retracement Strategy
- EMA MACD Momentum Tracking Strategy
- Dynamic Position Management RSI Overbought Reversal Strategy
- Dynamic Trend Following Strategy with Machine Learning Enhanced Risk Management
- Crossover Moving Average with Smoothed Candlestick Momentum Strategy
- Dual Moving Average Crossover Strategy with Daily Profit Target
- Dynamic Stop-Loss Moving Average Crossover Strategy
- MACD-ATR-EMA Multi-Indicator Dynamic Trend Following Strategy
- RSI Momentum Divergence Breakout Strategy
- Multi-Indicator Synergy Long-Term Trading Strategy
- Golden Momentum Capture Strategy: Multi-Timeframe Exponential Moving Average Crossover System
- Triple Supertrend Crossover Strategy
- Advanced Multi-Timeframe Ichimoku Cloud Trading Strategy with Dynamic Multidimensional Analysis