Mean Reversion Strategy with Bollinger Bands, RSI and ATR-Based Dynamic Stop-Loss System
Author: ChaoZhang, Date: 2024-11-27 14:28:17Tags: BBRSIATRMR

Overview
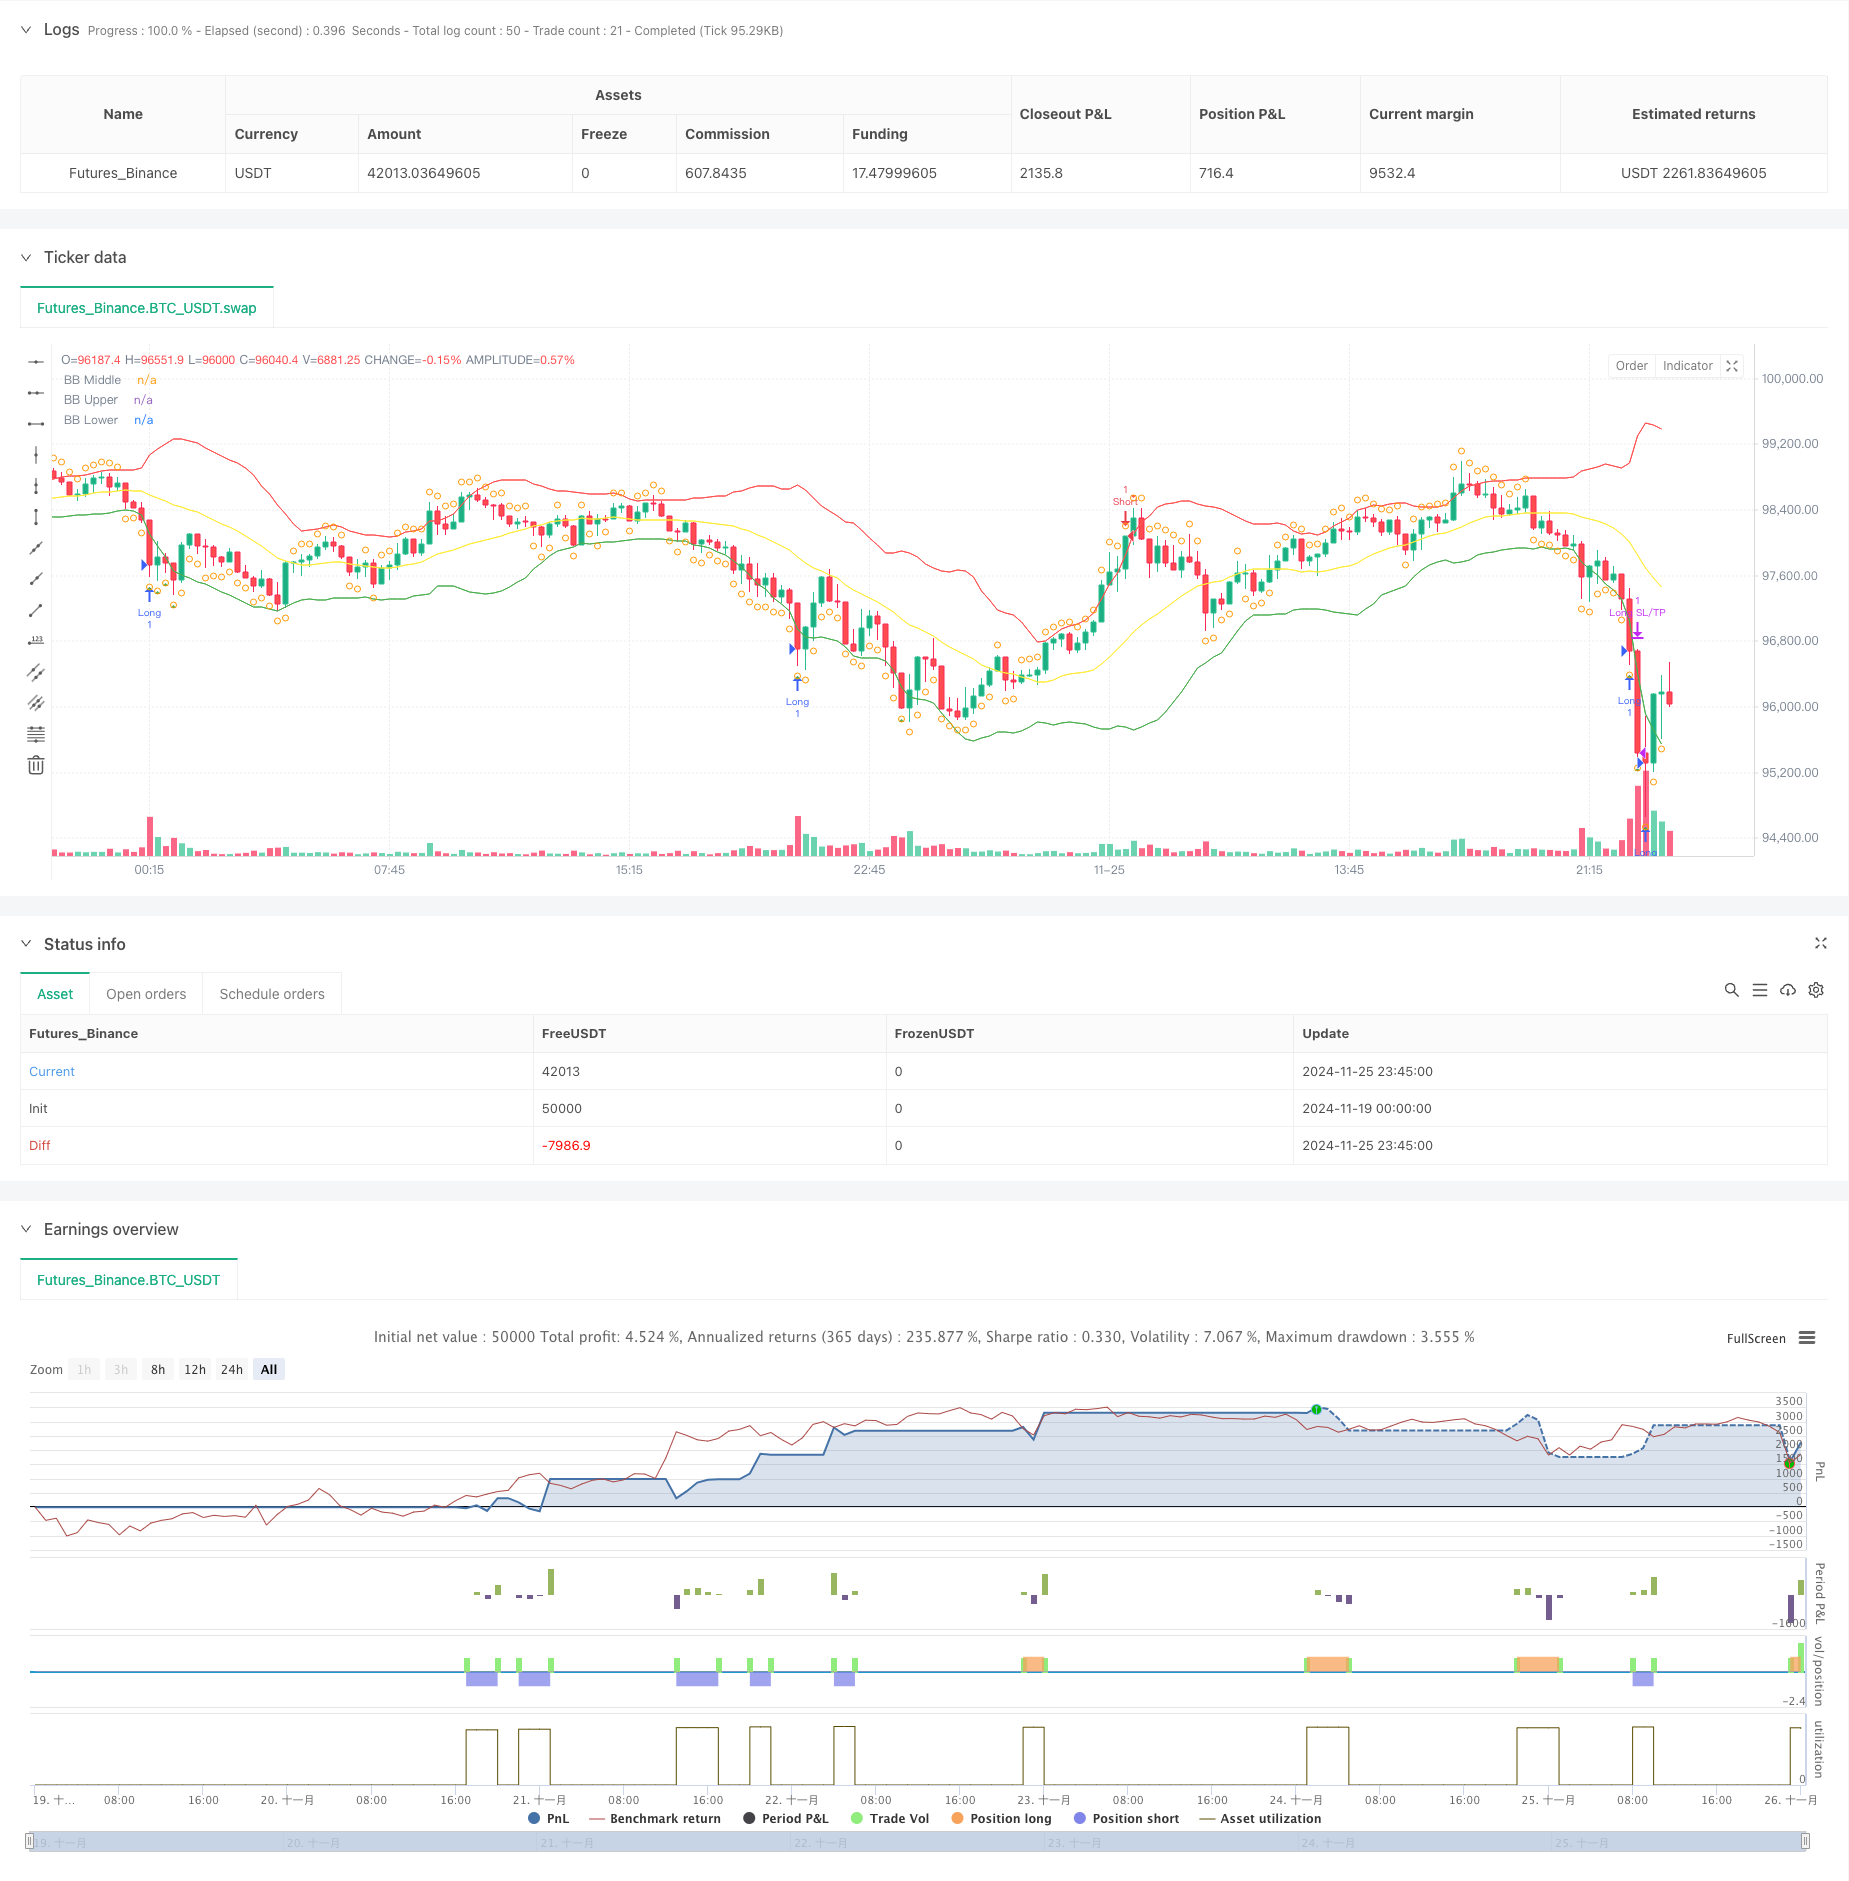
This strategy is a quantitative trading system based on mean reversion theory, combining Bollinger Bands, RSI indicators, and ATR-based dynamic stop-loss mechanism. The strategy trades by identifying extreme price deviations from the mean, going long when price touches the lower Bollinger Band and RSI is in oversold territory, and going short when price touches the upper Bollinger Band and RSI is in overbought territory, while using ATR to dynamically set stop-loss and take-profit levels for effective risk-reward management.
Strategy Principles
The strategy employs 20-period Bollinger Bands as the primary trend indicator, with a standard deviation multiplier of 2.0 to determine price movement boundaries. A 14-period RSI is incorporated as a supplementary indicator, with readings below 30 considered oversold and above 70 considered overbought. Long positions are initiated when price breaks below the lower band and RSI is below 30, indicating potential oversold conditions, while short positions are taken when price breaks above the upper band and RSI is above 70, indicating potential overbought conditions. The middle band serves as the profit-taking level, combined with RSI reversal signals for position management. Additionally, a 14-period ATR-based dynamic stop-loss mechanism is implemented, with stops set at 2x ATR and profit targets at 3x ATR for precise risk control.
Strategy Advantages
- Multi-indicator cross-validation: The combination of Bollinger Bands and RSI effectively filters false signals and improves trading accuracy.
- Dynamic stop-loss mechanism: ATR-based adjustment of stop-loss and take-profit levels adapts to market volatility.
- Complete trading loop: Includes clear entry, exit conditions, and risk management mechanisms with coherent logic.
- High adaptability: Strategy parameters can be optimized for different market characteristics.
Strategy Risks
- Trend market risk: Mean reversion strategies may experience frequent stops in strong trend markets.
- Parameter sensitivity: Settings for Bollinger Bands period and RSI thresholds significantly impact strategy performance.
- Exit timing: Middle band exits may result in premature position closure during favorable conditions.
- Stop-loss magnitude: Fixed ATR multiplier stops may be excessive during high volatility periods.
Optimization Directions
- Add trend filters: Consider incorporating longer-period moving averages to avoid counter-trend trades in strong trends.
- Integrate volume indicators: Use volume as a trade signal confirmation indicator to improve trade quality.
- Optimize profit-taking: Consider implementing trailing stops or scaled exit methods to enhance profitability.
- Dynamic parameter adjustment: Implement adaptive adjustment of Bollinger Bands and RSI parameters based on market volatility.
Summary
The strategy constructs a comprehensive mean reversion trading system through the combined application of Bollinger Bands and RSI. The introduction of ATR-based dynamic stops effectively controls risk, providing favorable risk-reward characteristics. While there is room for optimization, the overall design concept is clear and practical. Traders are advised to adjust parameters according to specific market characteristics and continuously monitor strategy performance when implementing in live trading.
/*backtest
start: 2024-11-19 00:00:00
end: 2024-11-26 00:00:00
period: 15m
basePeriod: 15m
exchanges: [{"eid":"Futures_Binance","currency":"BTC_USDT"}]
*/

//@version=5
strategy("SOL/USDT Mean Reversion Strategy", overlay=true)

// Input parameters
length = input(20, "Bollinger Band Length")
std_dev = input(2.0, "Standard Deviation")
rsi_length = input(14, "RSI Length")
rsi_oversold = input(30, "RSI Oversold")
rsi_overbought = input(70, "RSI Overbought")

// Calculate indicators
[middle, upper, lower] = ta.bb(close, length, std_dev)
rsi = ta.rsi(close, rsi_length)

// Entry conditions
long_entry = close < lower and rsi < rsi_oversold
short_entry = close > upper and rsi > rsi_overbought

// Exit conditions
long_exit = close > middle or rsi > rsi_overbought
short_exit = close < middle or rsi < rsi_oversold

// Strategy execution
if (long_entry)
    strategy.entry("Long", strategy.long)

if (short_entry)
    strategy.entry("Short", strategy.short)

if (long_exit)
    strategy.close("Long")

if (short_exit)
    strategy.close("Short")

// Stop loss and take profit
atr = ta.atr(14)
strategy.exit("Long SL/TP", "Long", stop=strategy.position_avg_price - 2*atr, limit=strategy.position_avg_price + 3*atr)
strategy.exit("Short SL/TP", "Short", stop=strategy.position_avg_price + 2*atr, limit=strategy.position_avg_price - 3*atr)

// Plot indicators
plot(middle, color=color.yellow, title="BB Middle")
plot(upper, color=color.red, title="BB Upper")
plot(lower, color=color.green, title="BB Lower")

// Plot entry and exit points
plotshape(long_entry, title="Long Entry", location=location.belowbar, color=color.green, style=shape.triangleup, size=size.small)
plotshape(short_entry, title="Short Entry", location=location.abovebar, color=color.red, style=shape.triangledown, size=size.small)
plotshape(long_exit, title="Long Exit", location=location.abovebar, color=color.orange, style=shape.circle, size=size.small)
plotshape(short_exit, title="Short Exit", location=location.belowbar, color=color.orange, style=shape.circle, size=size.small)
- RSI-Bollinger Bands Integration Strategy: A Dynamic Self-Adaptive Multi-Indicator Trading System
- Multi-Indicator Intelligent Pyramiding Strategy
- Dynamic Mean Reversion and Momentum Strategy
- High-Precision RSI and Bollinger Bands Breakout Strategy with Optimized Risk-Reward Ratio
- Reverse Volatility Breakout Strategy
- VWAP and RSI Dynamic Bollinger Bands Take Profit and Stop Loss Strategy
- AI-Optimized Adaptive Stop-Loss Trading System with Multiple Technical Indicator Integration
- Intelligent Time-Based Long-Short Rotation Balanced Trading Strategy
- Enhanced Bollinger Breakout Quantitative Strategy with Momentum Filter Integration System
- Big Red Candle Breakout Buy Strategy
- AI-Optimized Adaptive Stop-Loss Trading System with Multiple Technical Indicator Integration
- Multi-Period Moving Average Crossover with Volume Analysis System
- Dual Moving Average Momentum Tracking Quantitative Strategy
- Dual Moving Average Crossover Strategy with Adaptive Stop-Loss and Take-Profit
- Adaptive Trend Following Strategy Based on Momentum Oscillator
- PVT-EMA Trend Crossover Volume-Price Strategy
- MACD-EMA Multi-Period Dynamic Crossover Quantitative Trading System
- MACD Dynamic Oscillation Cross-Prediction Strategy
- VWAP-ATR Dynamic Price Action Trading System
- Dynamic Trend Quantitative Strategy Based on Bollinger Bands and RSI Cross
- Dynamic Trading Strategy System Based on Parabolic SAR Indicator
- Adaptive Volatility and Momentum Quantitative Trading System (AVMQTS)
- Advanced Trend Trading Strategy Based on Bollinger Bands and Candlestick Patterns
- ATR Volatility and Moving Average Based Adaptive Trend Following Exit Strategy
- Dual EMA Momentum Trend Trading Strategy with Full Body Candle Signal System
- Dual Timeframe Supertrend with RSI Optimization System
- Dual Moving Average Crossover Trend Following Strategy with Dynamic Stop-Loss and Take-Profit System
- Multi-Timeframe Trend Following Trading System with ATR and MACD Integration
- Dual Timeframe Supertrend RSI Intelligent Trading Strategy
- Dual MACD Price Action Breakout Trailing Strategy