MACD-EMA Multi-Period Dynamic Crossover Quantitative Trading System
Author: ChaoZhang, Date: 2024-11-27 14:58:04Tags: MACDEMAMARSI

Overview
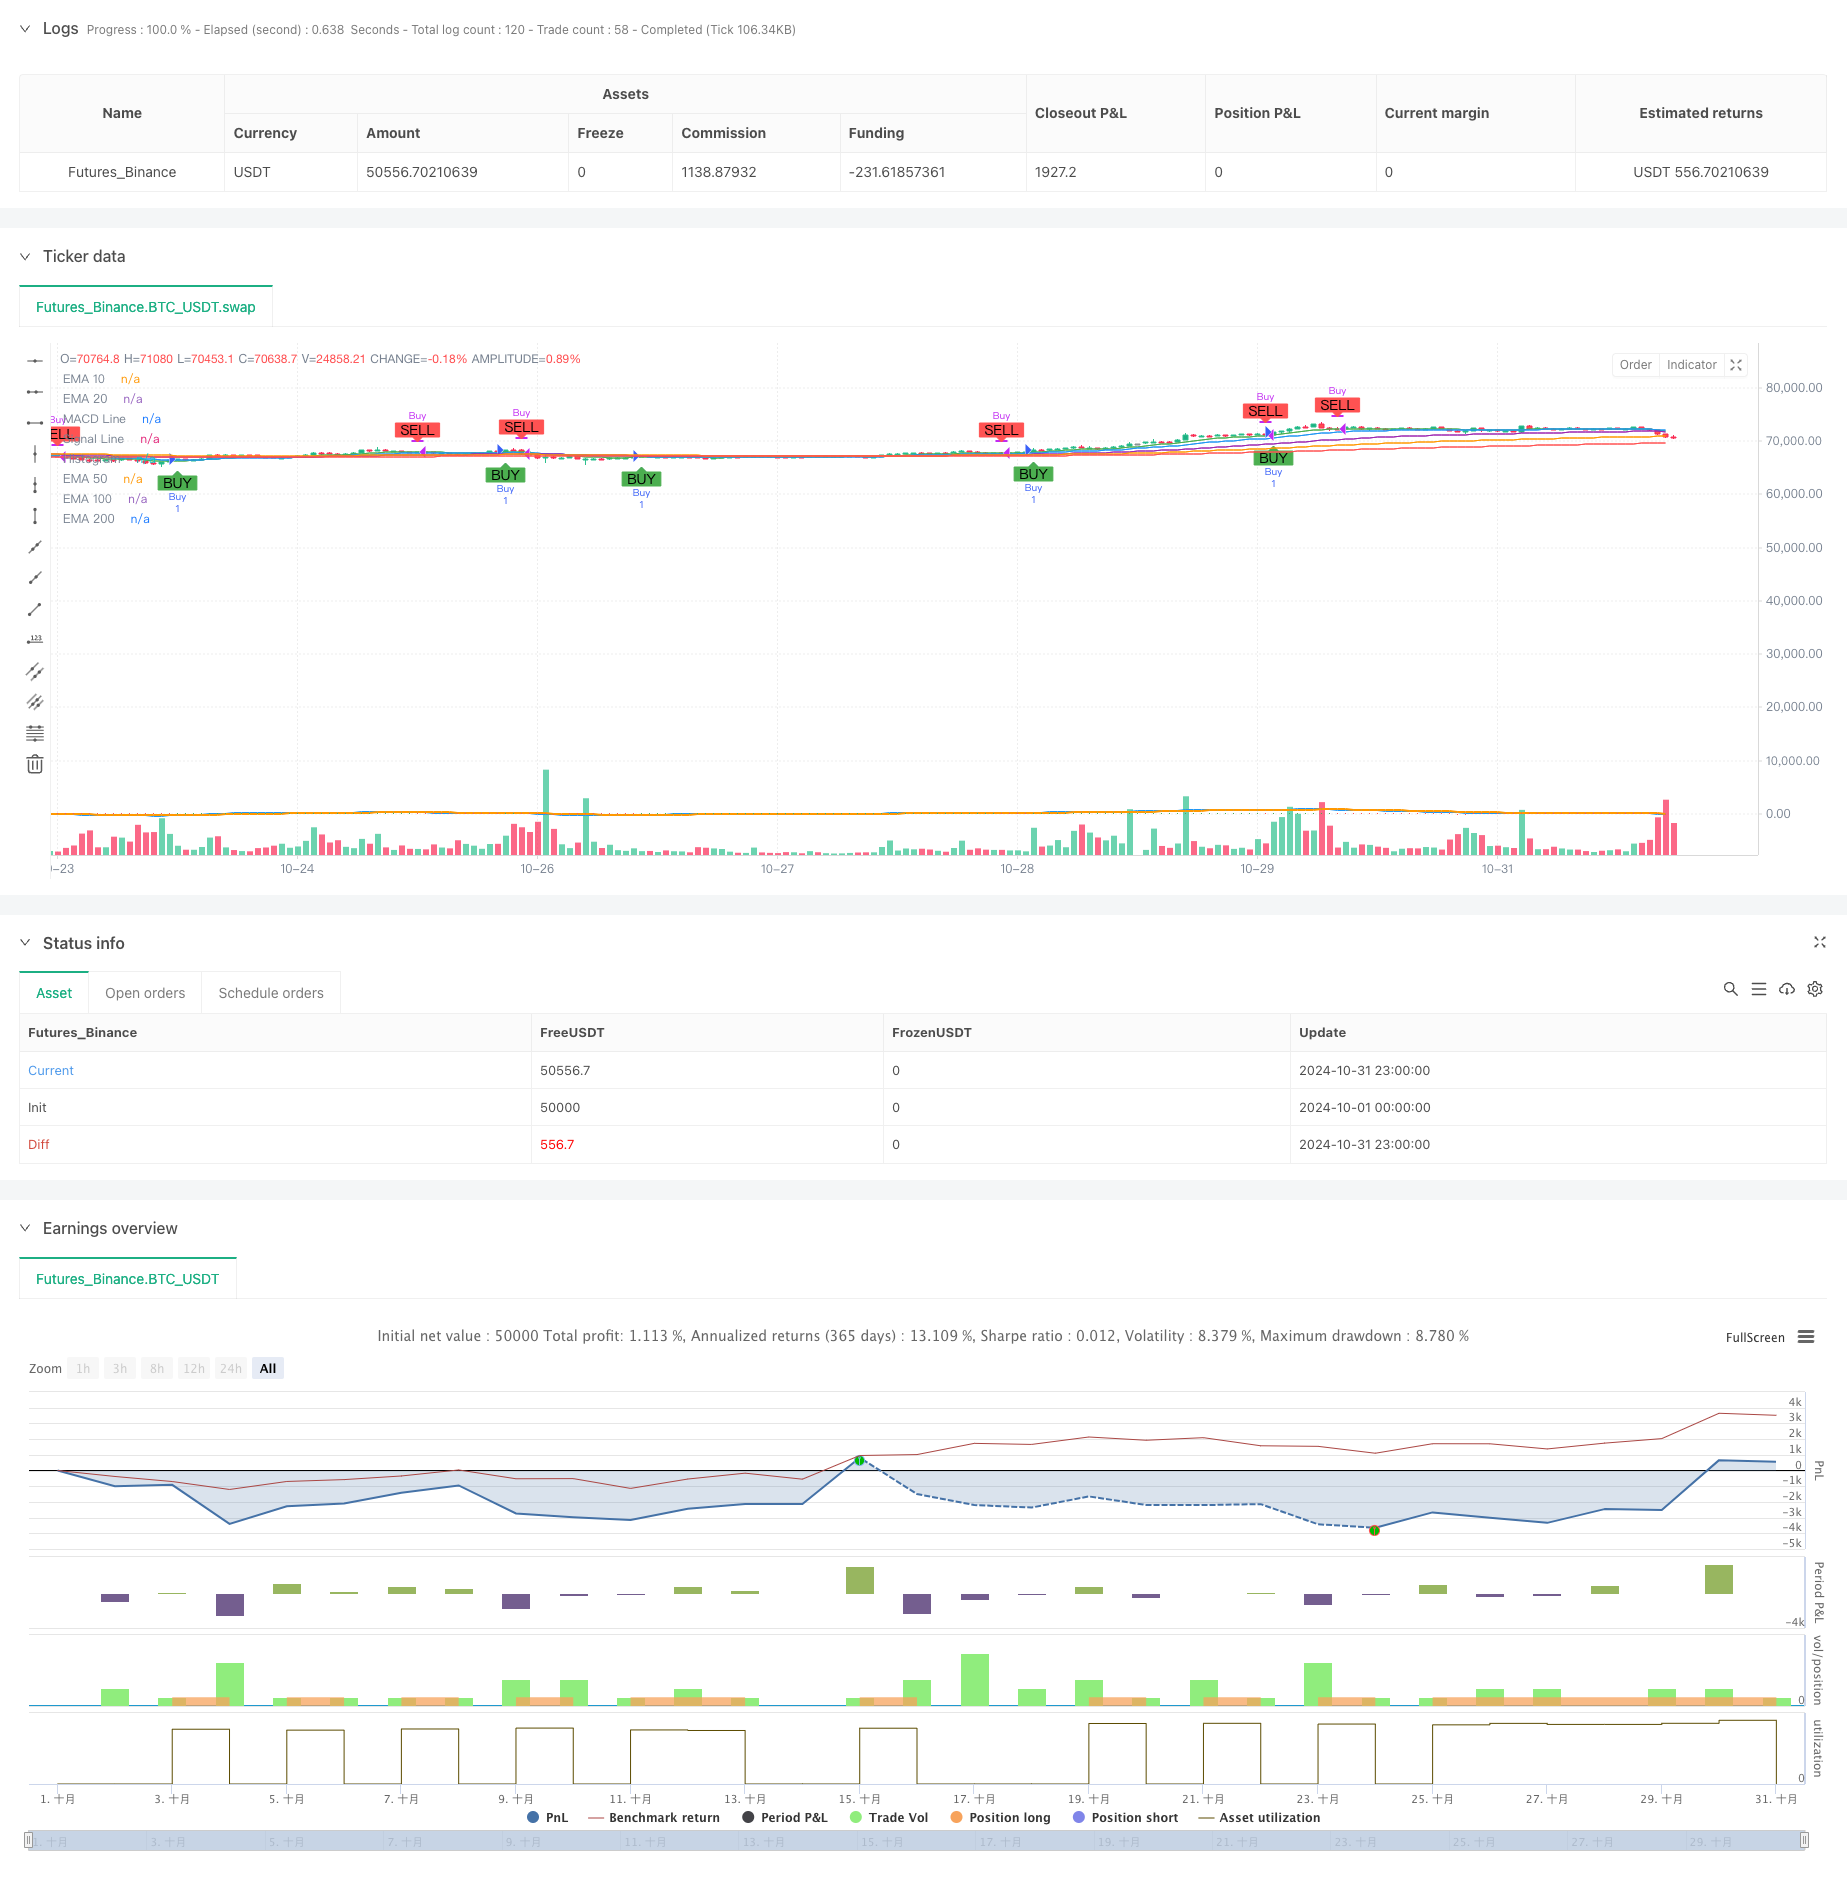
This strategy is a quantitative trading system based on MACD and multiple-period EMA indicators. It combines the trend-following characteristics of MACD with the support and resistance features of multiple EMA lines to create a complete trading decision system. The system includes not only signal generation but also real-time alerts to help traders capture market opportunities timely.
Strategy Principle
The core logic is built on two main technical indicators. First is the MACD indicator, composed of fast line (12 periods) and slow line (26 periods), generating trading signals through their crossovers. Buy signals are generated when the MACD line crosses above the signal line, and sell signals when it crosses below. Second, the strategy incorporates five different period EMAs (10/20/50/100/200) as references for trend confirmation and support/resistance levels. This multi-period EMA design helps traders better understand the current market trend environment.
Strategy Advantages
- Complete Signal System: Combines MACD’s trend-following characteristics with multiple EMA trend confirmation functions.
- Multi-dimensional Analysis: Provides multi-level market structure reference through different period EMAs.
- Real-time Alert Mechanism: Integrates real-time alerts for buy/sell signals to help traders identify trading opportunities promptly.
- Strong Visualization: Strategy clearly displays buy/sell signals on charts for intuitive market trend understanding.
- Adjustable Parameters: Core parameters are customizable for optimization in different market environments.
Strategy Risks
- Lag Risk: Both MACD and EMA are lagging indicators, possibly resulting in delayed signals in volatile markets.
- False Breakout Risk: Frequent false breakout signals may occur during consolidation phases.
- Trend Reversal Risk: Strategy may lack adaptability at major trend turning points.
- Parameter Sensitivity: Fixed parameters may lead to unstable strategy performance in different market environments.
Strategy Optimization Directions
- Introduce Volatility Filtering: Suggest adding ATR or Bollinger Bands to filter false signals in low volatility environments.
- Add Volume Confirmation: Can combine volume indicators to improve signal reliability.
- Optimize Stop Loss Mechanism: Suggest adding dynamic stop loss functionality, such as trailing stops or ATR-based stop loss settings.
- Increase Market Environment Classification: Can dynamically adjust strategy parameters based on different market environments (trend/oscillation).
- Add Risk Control Module: Suggest adding position management and risk control functions.
Summary
This strategy constructs a relatively complete trading system by combining MACD and multi-period EMA indicators. Its strengths lie in clear signals, rich analytical dimensions, and good visualization. However, it also has inherent risks such as lag and false signals. Through optimization measures like adding volatility filtering and volume confirmation, the strategy’s stability and reliability can be further enhanced. This strategy is suitable for medium to long-term traders, particularly excelling in clear trend market environments.
/*backtest
start: 2024-10-01 00:00:00
end: 2024-10-31 23:59:59
period: 1h
basePeriod: 1h
exchanges: [{"eid":"Futures_Binance","currency":"BTC_USDT"}]
*/

//@version=5
strategy("REEL TIME MACD Strategy with Alerts and EMAs", overlay=true)

// --- Custom Indicator: MACD ---
fastLength = input(12, title="MACD Fast Length")
slowLength = input(26, title="MACD Slow Length")
signalSmoothing = input(9, title="MACD Signal Smoothing")
src = close

[macdLine, signalLine, _] = ta.macd(src, fastLength, slowLength, signalSmoothing)
histogram = macdLine - signalLine

// Plot MACD components
plot(macdLine, color=color.blue, linewidth=2, title="MACD Line")
plot(signalLine, color=color.orange, linewidth=2, title="Signal Line")
plot(histogram, style=plot.style_histogram, color=(histogram >= 0 ? color.green : color.red), title="Histogram")

// --- Custom Indicator: EMAs ---
ema10 = ta.ema(src, 10)
ema20 = ta.ema(src, 20)
ema50 = ta.ema(src, 50)
ema100 = ta.ema(src, 100)
ema200 = ta.ema(src, 200)

// Plot EMAs on the chart
plot(ema10, color=color.green, linewidth=1, title="EMA 10")
plot(ema20, color=color.blue, linewidth=1, title="EMA 20")
plot(ema50, color=color.purple, linewidth=1, title="EMA 50")
plot(ema100, color=color.orange, linewidth=1, title="EMA 100")
plot(ema200, color=color.red, linewidth=1, title="EMA 200")

// --- Strategy: Buy and Sell conditions (MACD) ---
buyCondition = ta.crossover(macdLine, signalLine) // Buy when MACD crosses above signal line
sellCondition = ta.crossunder(macdLine, signalLine) // Sell when MACD crosses below signal line

// Execute strategy based on buy/sell conditions
if (buyCondition)
    strategy.entry("Buy", strategy.long)

if (sellCondition)
    strategy.close("Buy")

// --- Alerts ---
alertcondition(buyCondition, title="MACD Buy Alert", message="MACD XUP - Buy")
alertcondition(sellCondition, title="MACD Sell Alert", message="MACD XDN - Sell")

// Optional: Visualization for Buy/Sell signals
plotshape(series=buyCondition, location=location.belowbar, color=color.green, style=shape.labelup, title="Buy Signal", text="BUY")
plotshape(series=sellCondition, location=location.abovebar, color=color.red, style=shape.labeldown, title="Sell Signal", text="SELL")
- Advanced MACD Dynamic Trend Quantitative Trading Strategy
- Dual EMA Trend Momentum Trading Strategy
- Multi-Level Dynamic MACD Trend Following Strategy with 52-Week High/Low Extension Analysis System
- Multi-EMA Dynamic Trend Capture Quantitative Trading Strategy
- Multi-Strategy Technical Analysis Trading System
- Dynamic Dual Moving Average Crossover Quantitative Trading Strategy
- Quantitative Long-Short Switching Strategy Based on G-Channel and EMA
- Multi-Timeframe EMA Cross High-Win Rate Trend Following Strategy (Advanced)
- Multi-Technical Indicator Synergistic Trading System
- No Upper Wick Bullish Candle Breakout Strategy
- VWAP-MACD-RSI Multi-Factor Quantitative Trading Strategy
- Triple Moving Average Trend Following and Momentum Integration Quantitative Trading Strategy
- Z-Score and Supertrend Based Dynamic Trading Strategy: Long-Short Switching System
- Adaptive Bollinger Breakout with Moving Average Quantitative Strategy System
- AI-Optimized Adaptive Stop-Loss Trading System with Multiple Technical Indicator Integration
- Multi-Period Moving Average Crossover with Volume Analysis System
- Dual Moving Average Momentum Tracking Quantitative Strategy
- Dual Moving Average Crossover Strategy with Adaptive Stop-Loss and Take-Profit
- Adaptive Trend Following Strategy Based on Momentum Oscillator
- PVT-EMA Trend Crossover Volume-Price Strategy
- MACD Dynamic Oscillation Cross-Prediction Strategy
- VWAP-ATR Dynamic Price Action Trading System
- Dynamic Trend Quantitative Strategy Based on Bollinger Bands and RSI Cross
- Mean Reversion Strategy with Bollinger Bands, RSI and ATR-Based Dynamic Stop-Loss System
- Dynamic Trading Strategy System Based on Parabolic SAR Indicator
- Adaptive Volatility and Momentum Quantitative Trading System (AVMQTS)
- Advanced Trend Trading Strategy Based on Bollinger Bands and Candlestick Patterns
- ATR Volatility and Moving Average Based Adaptive Trend Following Exit Strategy
- Dual EMA Momentum Trend Trading Strategy with Full Body Candle Signal System
- Dual Timeframe Supertrend with RSI Optimization System