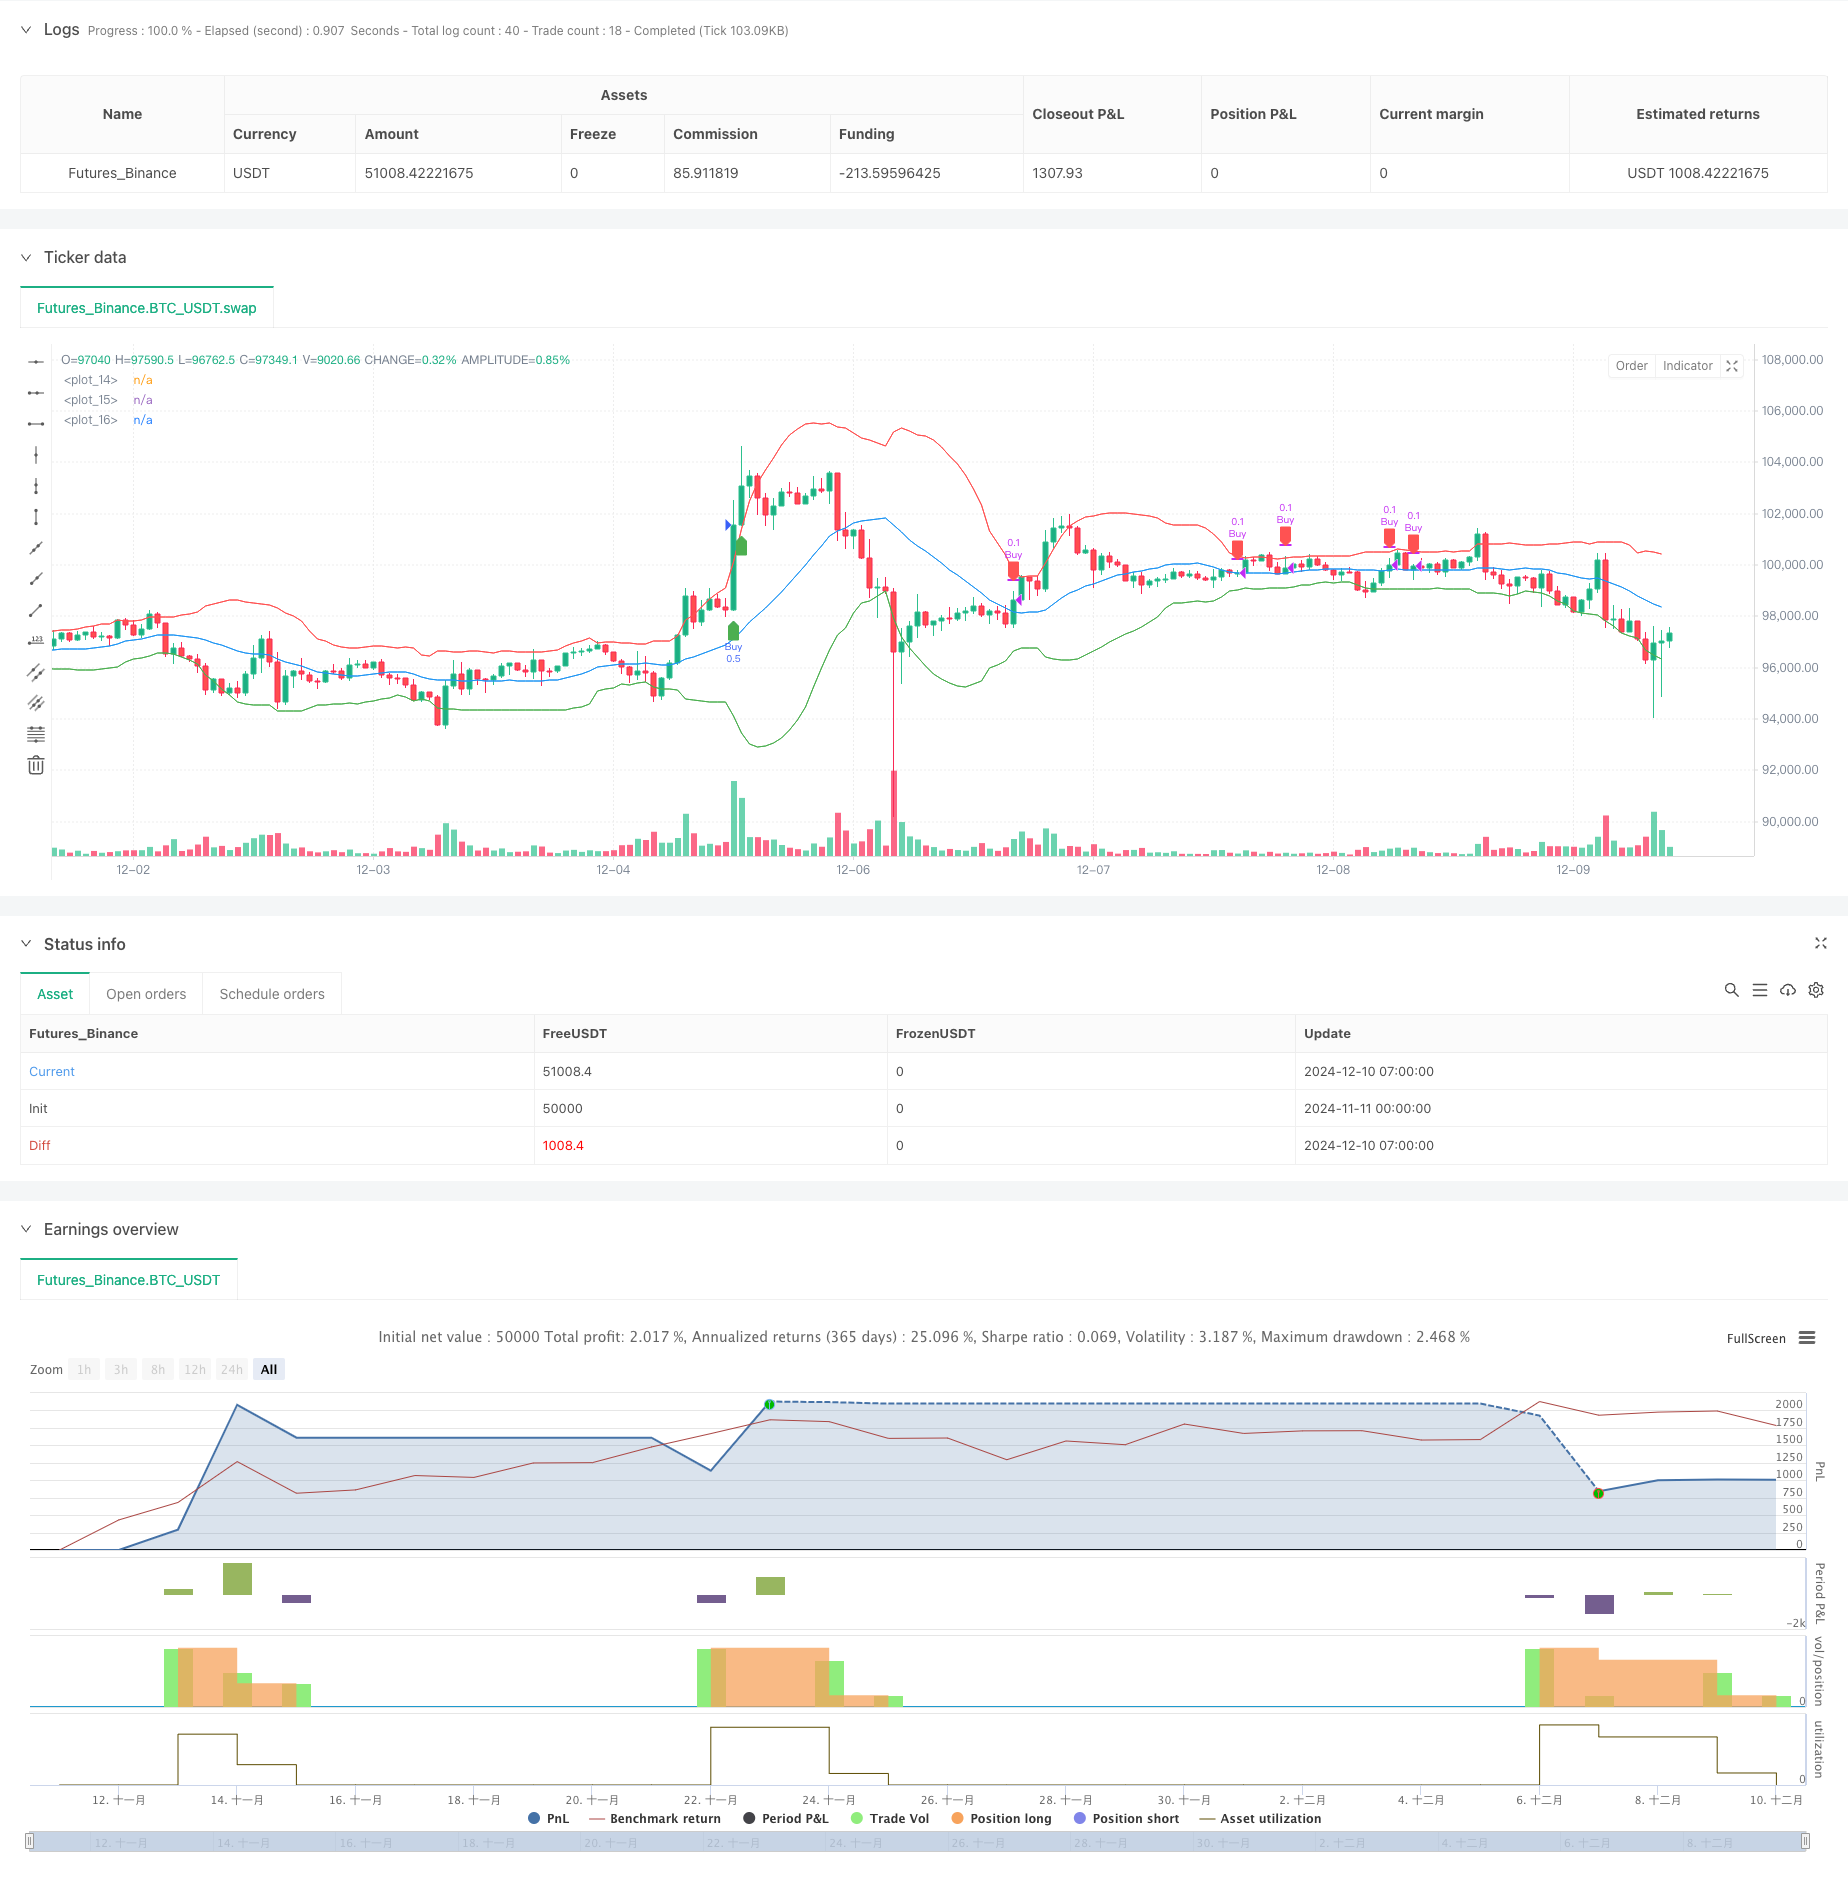
Overview
This strategy is an adaptive trading system based on Bollinger Bands, managing positions by dynamically monitoring the relationship between price and the bands. It uses a 20-day moving average as the middle band, 2 standard deviations for channel width, and combines breakout confirmation with time period analysis to trigger trading signals for optimized capital allocation.
Strategy Principle
The strategy applies the statistical principles of Bollinger Bands, controlling price fluctuations within a normal distribution range. Specifically: 1. Uses 20-day Simple Moving Average (SMA) to construct the middle band 2. Sets upper and lower bands using 2 standard deviations to form price fluctuation range 3. Buys 50% position when price breaks above upper band by 5% or stays above it for 1 hour 4. Reduces position by 10% on first return to middle band, 50% when price falls below lower band by 5% 5. Controls risk and optimizes returns through phased position building and reduction
Strategy Advantages
- Combines trend following and mean reversion, maintaining stability in different market environments
- Employs dynamic position management to avoid risks from excessive holdings
- Uses time confirmation to filter false breakout signals, improving trading reliability
- Phased position reduction strategy locks in partial profits while maintaining upside potential
- Strategy logic is simple and clear, easy to understand and execute
Strategy Risks
- May trigger frequent trading in volatile markets, increasing transaction costs
- Fixed Bollinger Bands parameters may not adapt to all market conditions
- Breakout confirmation time period settings might miss important trading opportunities
- Phased position reduction may exit positions too early in strong trends
- Aggressive capital management requires sufficient funding reserves
Strategy Optimization Directions
- Introduce adaptive Bollinger Bands parameters that adjust dynamically based on market volatility
- Add volume indicators as auxiliary confirmation for trading signals
- Optimize position management system by adjusting position sizes based on trend strength
- Incorporate stop-loss mechanisms for effective downside risk control
- Consider combining with other technical indicators to improve signal accuracy
Summary
The strategy establishes a complete trading system through Bollinger Bands and time period analysis, striking a balance between trend following and risk control. While there is room for optimization, the overall design philosophy aligns with core quantitative trading principles and has practical application value. Investors are advised to make appropriate adjustments based on their risk tolerance and capital size in live trading.
/*backtest
start: 2024-11-11 00:00:00
end: 2024-12-10 08:00:00
period: 1h
basePeriod: 1h
exchanges: [{"eid":"Futures_Binance","currency":"BTC_USDT"}]
*/

//@version=5
strategy("Bollinger Bands Strategy", overlay=true)

// 設定布林通道
length = 20
source = close
mult = 2.0
basis = ta.sma(source, length)
dev = mult * ta.stdev(source, length)
upper = basis + dev
lower = basis - dev

// 畫出布林通道
plot(upper, color=color.red, linewidth=1)
plot(basis, color=color.blue, linewidth=1)
plot(lower, color=color.green, linewidth=1)

// 設定買入條件:突破布林通道高點5%或持續1小時在高點上方
breakout_level = upper * 1.01

hour_breakout = ta.change(time("60")) == 1 and close > upper

buy_condition = (close > breakout_level or hour_breakout)
if (buy_condition)
    strategy.entry("Buy", strategy.long, qty=0.5)

// 設定賣出條件:第一次回測中線、跌破低點5%或回升中線
sell_10_condition = ta.crossover(close, basis) and strategy.opentrades > 0
sell_50_condition = close < lower * 0.95

// 賣出10%現貨
if (sell_10_condition)
    strategy.close("Buy", qty=0.1)

// 賣出50%現貨
if (sell_50_condition)
    strategy.close("Buy", qty=0.5)

// 監控買入與賣出信號
plotshape(series=buy_condition, location=location.belowbar, color=color.green, style=shape.labelup, title="Buy Signal")
plotshape(series=sell_10_condition, location=location.abovebar, color=color.red, style=shape.labeldown, title="Sell 10% Signal")
plotshape(series=sell_50_condition, location=location.abovebar, color=color.blue, style=shape.labeldown, title="Sell 50% Signal")