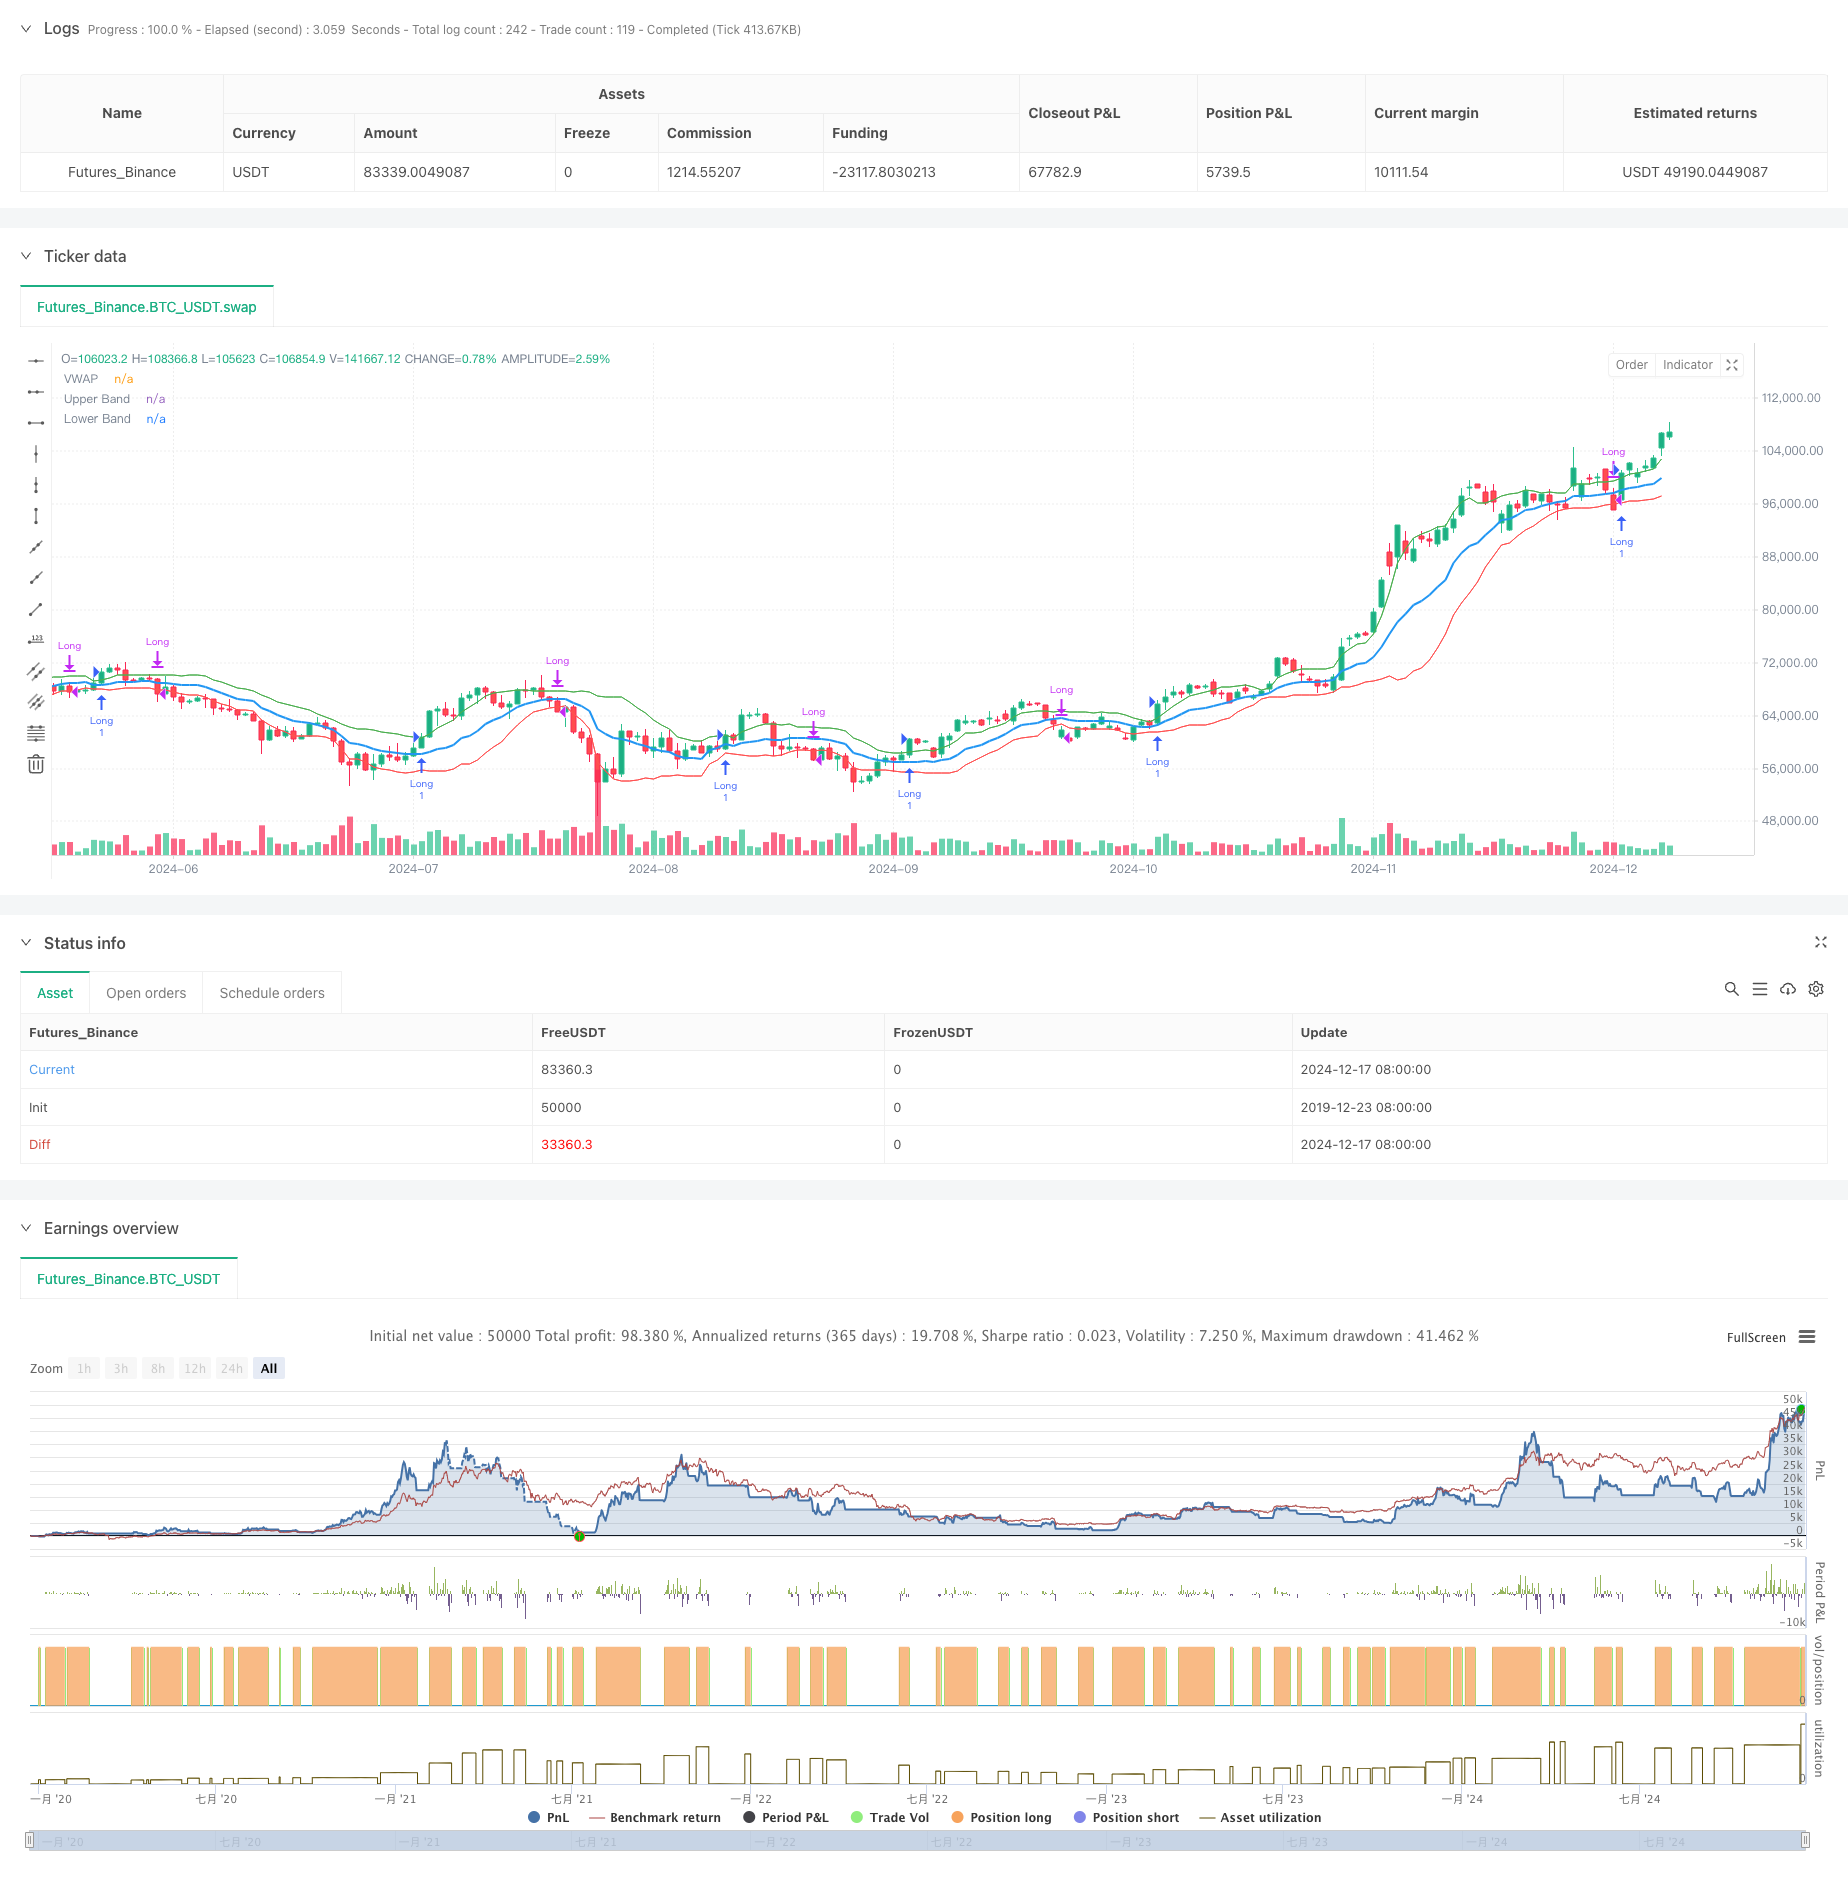
Adaptive VWAP Bands with Garman-Klass Volatility Dynamic Tracking Strategy
Author: ChaoZhang, Date: 2024-12-20 14:51:00Tags: VWAPGKVSTDMAVWMA

Overview
This is an adaptive trading strategy based on Volume Weighted Average Price (VWAP) and Garman-Klass Volatility (GKV). The strategy dynamically adjusts the standard deviation bands of VWAP through volatility to achieve intelligent market trend tracking. It opens long positions when price breaks above the upper band and closes positions when breaking below the lower band, with higher volatility leading to higher breakout thresholds and lower volatility leading to lower thresholds.
Strategy Principle
The core of the strategy combines VWAP with GKV volatility. It first calculates VWAP as the price pivot, then builds bands using the standard deviation of closing prices. The key is using the GKV formula for volatility calculation, which considers four price points (open, high, low, close) and is more accurate than traditional volatility measures. Volatility dynamically adjusts band width - when volatility increases, bands widen, raising breakout thresholds; when volatility decreases, bands narrow, lowering breakout thresholds. This adaptive mechanism effectively avoids false breakouts.
Strategy Advantages
- Combines volume-price relationship and volatility characteristics for more reliable signals
- Adaptive adjustment of band width reduces noise interference
- Uses GKV volatility for more accurate market microstructure capture
- Simple and clear calculation logic, easy to implement and maintain
- Suitable for different market environments with strong universality
Strategy Risks
- May trade frequently in ranging markets, increasing costs
- Sensitive to VWAP length and volatility period
- May respond slowly to rapid trend reversals
- Requires real-time market data with high quality requirements Risk control suggestions:
- Set reasonable stop-loss levels
- Optimize parameters for different markets
- Add trend confirmation indicators
- Control position sizing
Strategy Optimization Directions
- Introduce multi-timeframe analysis to improve signal reliability
- Add volume analysis dimension to confirm breakout validity
- Optimize volatility calculation method, consider introducing EWMA
- Add trend strength filters
- Consider adding dynamic stop-loss mechanisms These optimizations can improve strategy stability and return quality.
Summary
The strategy achieves dynamic market tracking through innovative combination of VWAP and GKV volatility. Its adaptive nature enables stable performance across different market environments. While there are some potential risks, the strategy shows good application prospects through proper risk control and continuous optimization.
/*backtest
start: 2019-12-23 08:00:00
end: 2024-12-18 08:00:00
period: 1d
basePeriod: 1d
exchanges: [{"eid":"Futures_Binance","currency":"BTC_USDT"}]
*/

//@version=5
strategy("Adaptive VWAP Bands with Garman Klass Volatility", overlay=true)

// Inputs
length = input.int(25, title="Volatility Length")
vwapLength = input.int(14, title="VWAP Length")
vol_multiplier = input.float(1,title="Volatility Multiplier")

// Function to calculate Garman-Klass Volatility
var float sum_gkv = na
if na(sum_gkv)
    sum_gkv := 0.0

sum_gkv := 0.0
for i = 0 to length - 1
    sum_gkv := sum_gkv + 0.5 * math.pow(math.log(high[i]/low[i]), 2) - (2*math.log(2)-1) * math.pow(math.log(close[i]/open[i]), 2)

gcv = math.sqrt(sum_gkv / length)

// VWAP calculation
vwap = ta.vwma(close, vwapLength)

// Standard deviation for VWAP bands
vwapStdDev = ta.stdev(close, vwapLength)

// Adaptive multiplier based on GCV
multiplier = (gcv / ta.sma(gcv, length)) * vol_multiplier

// Upper and lower bands
upperBand = vwap + (vwapStdDev * multiplier)
lowerBand = vwap - (vwapStdDev * multiplier)

// Plotting VWAP and bands
plot(vwap, title="VWAP", color=color.blue, linewidth=2)
plot(upperBand, title="Upper Band", color=color.green, linewidth=1)
plot(lowerBand, title="Lower Band", color=color.red, linewidth=1)

var barColor = color.black

// Strategy: Enter long above upper band, go to cash below lower band
if (close > upperBand)
    barColor := color.green
    strategy.entry("Long", strategy.long)
else if (close < lowerBand)
    barColor := color.fuchsia
    strategy.close("Long")

barcolor(barColor)
- MA, SMA, MA Slope, Trailing Stop Loss, Re-Entry
- Triple Standard Deviation Momentum Reversal Trading Strategy
- Statistical Deviation-Based Market Extreme Drawdown Strategy
- Multi-Period Moving Average Trend Following with VWAP Cross Strategy
- Adaptive Standard Deviation Breakout Trading Strategy: Multi-Period Optimization System Based on Dynamic Volatility
- Big Red Candle Breakout Buy Strategy
- Advanced 15-Minute Chart Trading Signal Strategy
- Historical Breakout Trend System with Moving Average Filter (HBTS)
- Multi Moving Average Trading System with Momentum and Volume Confirmation Quantitative Trend Strategy
- Quantitative Trend Capture Strategy Based on Candlestick Wick Length Analysis
- Multi-SMA Zone Breakout with Dynamic Profit Lock Quantitative Trading Strategy
- Dynamic Wave-Trend Tracking Strategy
- Break of Structure with Volume Confirmation Multi-Condition Intelligent Trading Strategy
- Multi-Indicator Dynamic Stop-Loss Momentum Trend Trading Strategy
- Multi-Condition Trend Following Quantitative Trading Strategy Based on Fibonacci Retracement Levels
- Multi-Moving Average Trend Following Trading Strategy
- Multi-Filter Trend Breakthrough Smart Moving Average Trading Strategy
- Dynamic EMA Breakthrough and Reversal Strategy
- Dynamic Trend Momentum Optimization Strategy with G-Channel Indicator
- Multi-level ATH Dynamic Tracking Triple-Entry Strategy
- Multi-Indicator Trend Following Options Trading EMA Cross Strategy
- Multi-Indicator Volatility Trading RSI-EMA-ATR Strategy
- Quantitative Long-Short Switching Strategy Based on G-Channel and EMA
- Dual Moving Average Trend Following Strategy with Risk Management
- Triple Supertrend and Bollinger Bands Multi-Indicator Trend Following Strategy
- Multi-Trendline Breakout Momentum Quantitative Strategy
- RSI Momentum and ADX Trend Strength Based Capital Management System
- Multi-Timeframe Liquidity Pivot Heatmap Strategy
- Multi-Timeframe Trend Following Strategy with ATR-Based Take Profit and Stop Loss
- Advanced Trend Following Strategy with Adaptive Trailing Stop