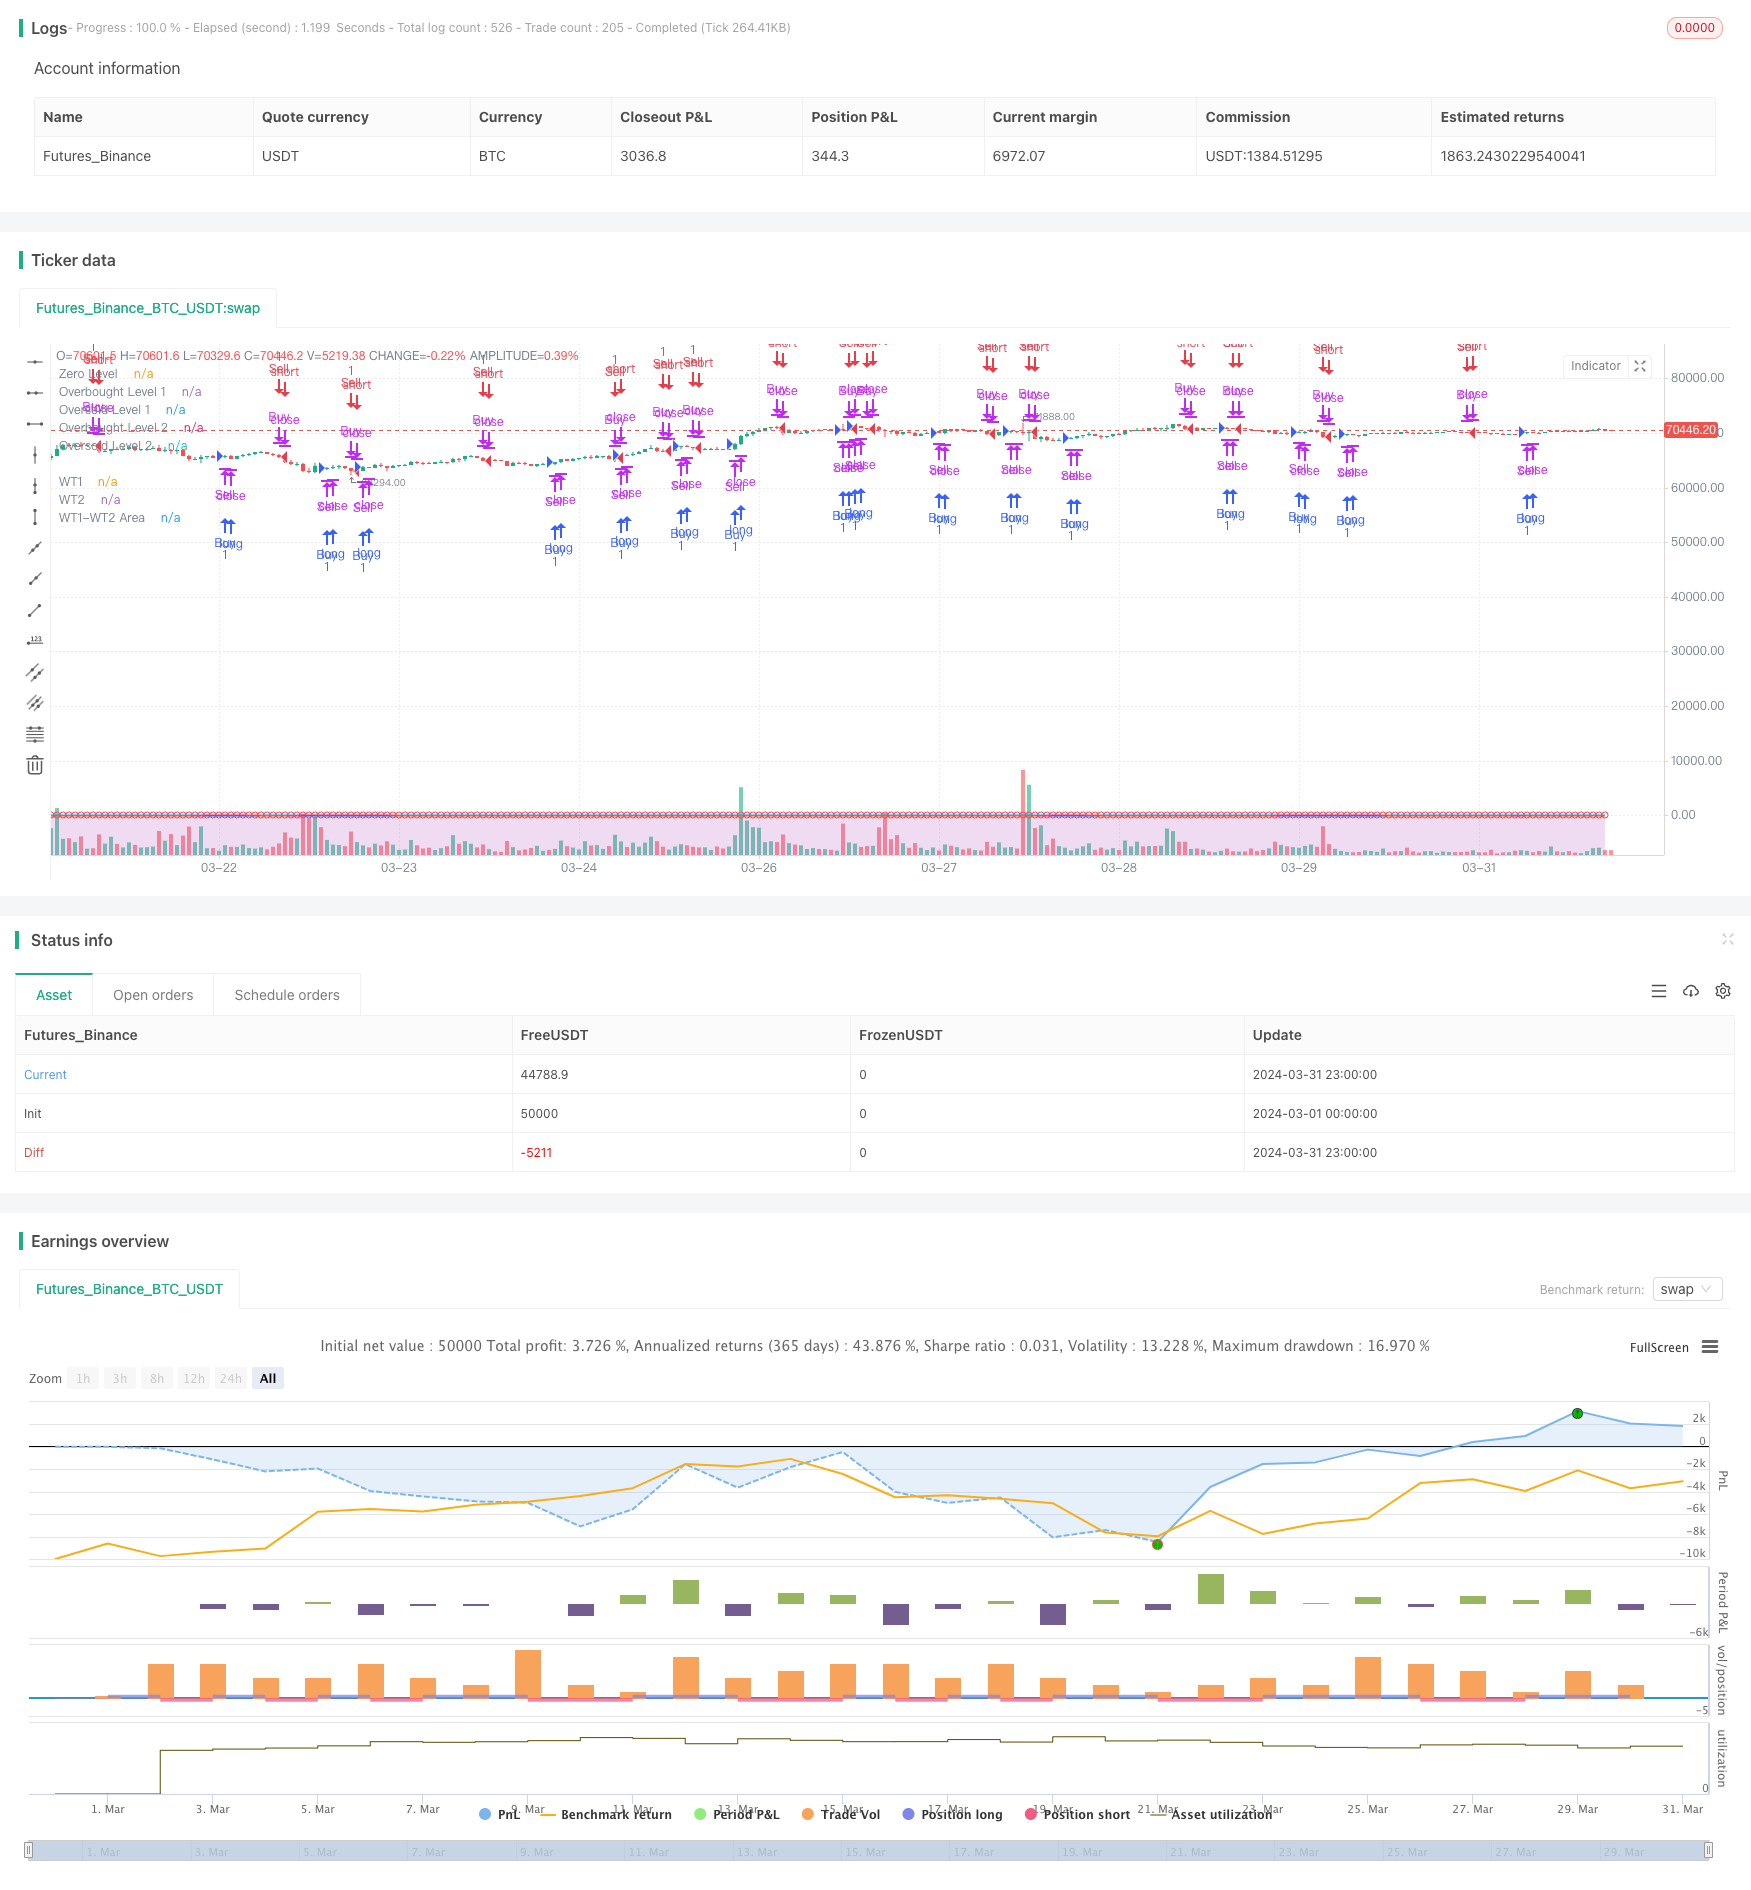
WaveTrend クロス LazyBear 戦略
作者: リン・ハーンチャオチャン, 日付: 2024-04-28 13:56:27タグ:エイマSMAHLCC3エー・エ・エ

概要
WaveTrend Cross LazyBear戦略は,WaveTrend指標に基づいた取引戦略である.この戦略は,異なる期間の2つのWaveTrend指標線を使用する.より速い期間のWaveTrend指標線が,より遅い期間のWaveTrend指標線の上を横切ると,購入信号を生成する.より速い期間のWaveTrend指標線が,より遅い期間のWaveTrend指標線を下を横切ると,販売信号を生成する.この戦略は,市場状況を判断するのに役立つために,過剰購入および過剰販売ゾーンも設定する.
戦略原則
この戦略の核心はWaveTrend指標で,次のステップで計算されます.
- 高値,低値,閉値の平均に等しい典型的な価格 (AP) を計算します.
- 周期 n1 の AP の指数移動平均 (ESA) を計算する.
- 周期 n1 の AP と ESA の違いの絶対値の指数移動平均 d を計算する.
- インディケーター CI を計算する.これは (AP - ESA) / (0.015 * d) に等しい.
- 周期 n2 の CI の指数移動平均 TCI を計算して WaveTrend インディケーターを得ます.
この戦略は,それぞれWT1とWT2として表記される異なる期間 (デフォルトは10と21) の2つのWaveTrend指標線を使用する.WT1がWT2を超えると購入信号を生成し,WT1がWT2を下回ると販売信号を生成する.さらに,この戦略は4つの補助レベルを設定する.過剰購入レベル1,過剰購入レベル2,過剰販売レベル1,過剰販売レベル2,市場状況を判断するのに役立ちます.
戦略 の 利点
- WaveTrend指標は,市場動向をより良く把握できる動力と波動性の特徴を組み合わせています.
- 双期波動トレンドインジケーターは,一部のノイズ信号を効果的にフィルタリングすることができます.
- 過剰購入と過剰販売のレベルを設定することで,ある程度市場が大きく変動するときに,戦略が頻繁に取引することを防ぐことができます.
- 戦略の論理は明確で 分かりやすく 実行できます
戦略リスク
- この戦略は変動する市場では 誤った信号を 増やす可能性があります
- パラメータの選択は戦略の業績に大きな影響を及ぼし,異なるパラメータは戦略の業績に大きな違いをもたらす可能性があります.
- この戦略はリスク管理を考慮していないため,極端な市場状況では大きな引き上げが起こり得る.
戦略の最適化方向
- トレンドフィルタリング条件,例えば長期移動平均の方向を追加することで,振動する市場における誤った信号を減らすことを検討する.
- 過剰購入と過剰販売のレベルを最適化し,異なる市場状況により動的に適応させる.
- ストップ・ロストとテイク・プロフィートのメカニズムを追加して,単一の取引のリスクを制御します.
- パラメータ最適化によって最適なパラメータ組み合わせを見つけます
概要
WaveTrend Cross LazyBear戦略は,WaveTrend指標に基づいたトレンド追跡戦略である. 双期指標の設計と過剰購入と過剰売却レベルの補助判断を通じて,特定のリスク制御を考慮しながらトレンドを把握する.しかし,この戦略は振動する市場でより多くの誤った信号を生む可能性があり,厳格なリスク管理対策がない.実用的な応用ではさらなる最適化と改善が必要である.
/*backtest
start: 2024-03-01 00:00:00
end: 2024-03-31 23:59:59
period: 1h
basePeriod: 15m
exchanges: [{"eid":"Futures_Binance","currency":"BTC_USDT"}]
*/

// This Pine Script™ code is subject to the terms of the Mozilla Public License 2.0 at https://mozilla.org/MPL/2.0/
// © burakaydingr

//@version=5
strategy("WaveTrend with Crosses [LazyBear]", shorttitle="WT_CROSS_LB", overlay=true)

// Kullanıcı girişleri
n1 = input(10, title="Channel Length")
n2 = input(21, title="Average Length")
obLevel1 = input(60, title="Over Bought Level 1")
obLevel2 = input(53, title="Over Bought Level 2")
osLevel1 = input(-60, title="Over Sold Level 1")
osLevel2 = input(-53, title="Over Sold Level 2")

// Temel hesaplamalar
ap = hlc3
esa = ta.ema(ap, n1)
d = ta.ema(math.abs(ap - esa), n1)
ci = (ap - esa) / (0.015 * d)
tci = ta.ema(ci, n2)

// WaveTrend göstergeleri
wt1 = tci
wt2 = ta.sma(wt1, 4)

// Al ve Sat Sinyalleri
buySignal = ta.crossover(wt1, wt2)
sellSignal = ta.crossunder(wt1, wt2)

// Alım ve Satım pozisyonları
if (buySignal)
    if (strategy.position_size <= 0) // Eğer şu anda açık bir satış pozisyonu varsa, onu kapat
        strategy.close("Sell")
    strategy.entry("Buy", strategy.long, comment="Buy Signal: Price crossed above WT2")

if (sellSignal)
    if (strategy.position_size >= 0) // Eğer şu anda açık bir alım pozisyonu varsa, onu kapat
        strategy.close("Buy")
    strategy.entry("Sell", strategy.short, comment="Sell Signal: Price crossed below WT2")

// Renkler ve diğer görseller
plot(0, color=color.new(color.gray, 0), title="Zero Level")
plot(obLevel1, color=color.new(color.red, 0), title="Overbought Level 1")
plot(osLevel1, color=color.new(color.green, 0), title="Oversold Level 1")
plot(obLevel2, color=color.new(color.purple, 0), title="Overbought Level 2")
plot(osLevel2, color=color.new(color.orange, 0), title="Oversold Level 2")

plot(wt1, color=color.new(color.red, 0), title="WT1")
plot(wt2, color=color.new(color.blue, 0), title="WT2")
plot(wt1-wt2, color=color.new(color.purple, 80), style=plot.style_area, title="WT1-WT2 Area")

// İşaretler
plotshape(buySignal, location=location.absolute, color=color.new(color.yellow, 0), style=shape.circle, size=size.small, title="Buy Signal")
plotshape(sellSignal, location=location.absolute, color=color.new(color.red, 0), style=shape.circle, size=size.small, title="Sell Signal")
関連性
- ダイナミック・トレンド・フォロー・EMA・クロスオーバー・戦略
- ハルク4エマ
- BMSBの脱出戦略
- ダイナミック 利益とストップ・ロスの取引戦略 3つの連続した下落のキャンドルと移動平均値に基づいています
- 2つの移動平均のクロスオーバー戦略
- MOST と 2 つの移動平均のクロスオーバー戦略
- ボリュームとキャンドルスティックパターンをベースにした買い/売る戦略
- EMA/SMA トレンドフォロー スウィング・トレーディング戦略 総量フィルターとパーセントのテイク・プロフィート/ストップ・ロース・システム
- トレンド確認付きのマルチEMAクロスオーバー戦略
- ダイナミック・デュアル・EMA・クロスオーバー・ストラテジー
もっと
- VWAPの取引戦略
- 多指標組み合わせ戦略 (CCI,DMI,MACD,ADX)
- RSI2 ストラテジー 日中の逆転 勝利率 バックテスト
- ハースト 境界線戦略の未来
- OBVとMAのクロスオーバー信号に基づいた戦略をフォローする傾向
- GBS TOP Bottom 確認された戦略
- 戦略をフォローする多指標の傾向
- 圧縮バックテスト トランスフォーマー v2.0
- フィボナッチトレンド逆転戦略
- HTF ジグザグパス戦略
- CCI,DMI,MACD ハイブリッド・ロング・ショート戦略
- AlphaTradingBotの取引戦略
- ベガス スーパートレンド 強化戦略
- 量的な取引戦略 変更されたハルム移動平均値とイチモク・キンコ・ヒョーに基づいた
- RSIのトレンド逆転戦略
- ストカスティッククロスオーバー指標のモメンタム取引戦略
- RSIと二重EMAのクロスオーバー・シグナル量的な戦略
- エリオット波理論 4-9 インパルス波自動検出 取引戦略
- ストーカスティック・オシレーターとストップ・ロストとストーカスティック・フィルター付きの移動平均クロスオーバー戦略
- 日中の可拡大波動性取引戦略