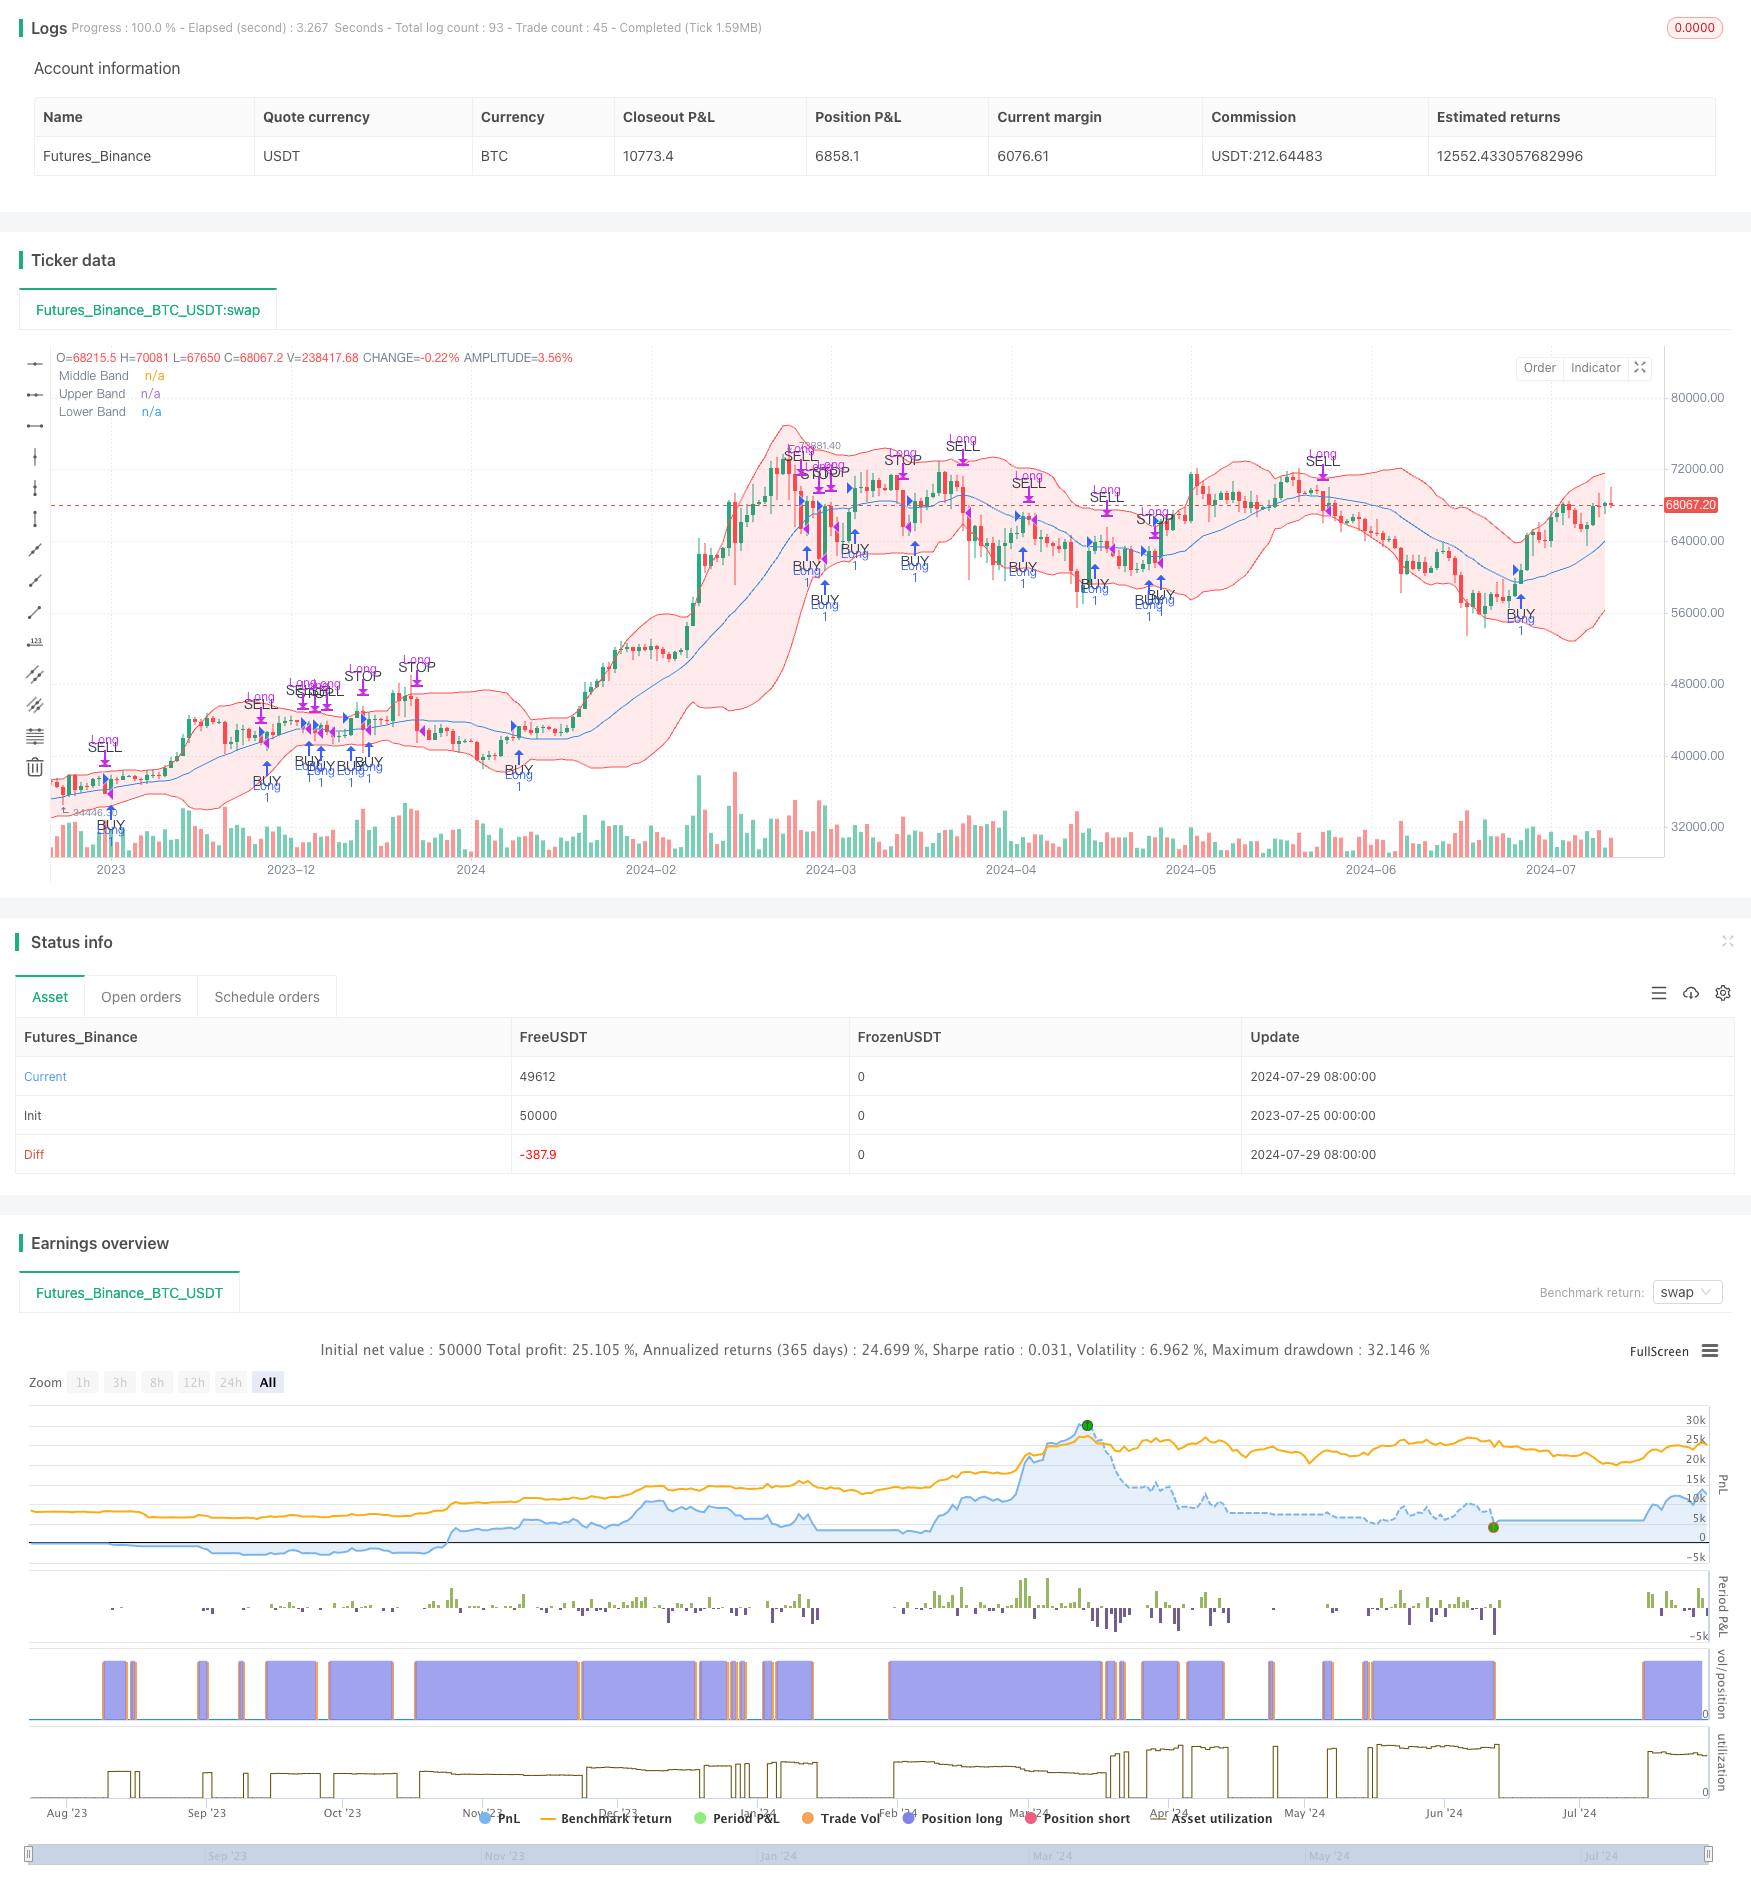
概要
ブリン帯平均値逆転取引戦略とダイナミック・サポートは,ブリン帯の指標を使用して潜在的な買い機会を識別し,ダイナミック・サポートレベルとして中軌を利潤的に結びつける取引戦略である.この戦略は,価格が上方の中軌を突破する兆候を示したときに多額の入場を行い,価格が中軌に戻ったとき,または入場価格から大幅な下落したときにポジションを退出することを目的としている.
この戦略の核心理は,平均回帰という概念に基づいている.この場合,ブリン帯の中軌道は,この平均を表している.この戦略は,価格が中軌道を突破して確認されるのを待つことで,取引の成功率を向上させ,同時に,ダイナミックな出口条件によってリスクを管理することを目的としている.
戦略原則
この戦略の仕組みは以下の通りです.
応募条件:
- 価格がブリン帯の中間軌道を破り,その後の2つの取引日において中間軌道上にとどまったときに多頭位を確立する.
- この条件は,一時的な価格変動ではなく,継続的な上昇傾向を保証するのに役立ちます.
収益は以下の条件で決まります.
- 価格が上からブリン帯の中軌道に触れたとき,平仓多頭ポジション.
- 中央線はここで動的支柱の役割を果たし,利益を得るために用いられる.
ストップ・ロスの条件:
- 価格が入場価格の2%以上下落した場合,平仓の多頭ポジション.
- このストップ条件は,価格が急激に下落したときに資金を保護するのに役立ちます.
同日取引制限:
- ストップ・ロスの条件を触発しない限り,同じ日に買い物も販売もされないことを保証する戦略.
- これは不必要な取引や価格変動を防ぐのに役立ちます.
策略は20期単調移動平均 ((SMA) をブリン帯の中軌として使用し,上下軌はそれぞれ中軌加減2倍標準差である.これらのパラメータはトレーダーの好みと市場条件に応じて調整できる.
戦略的優位性
市場への適応の動態:
- ブリン帯は市場の変動に合わせて自動的に調整され,異なる市場環境に戦略を適応させる.
到着と出発のシグナルがはっきりしている:
- 戦略は明確な出入りのルールを提供し,主観的な判断の必要性を減らす.
リスク管理:
- 固定パーセンテージのストップを用いることで,戦略は各取引のリスクを効果的にコントロールできます.
平均値帰帰帰原理:
- この戦略は,金融市場でよくある平均値の逆転現象を利用して,利益を得る可能性を高めています.
取引を避けるために:
- この策略は,偽の突破による不必要な取引を減らし,入場前に2つの取引日間の価格を中道の上部に維持することを要求します.
柔軟性:
- 戦略のパラメータ (ブリン帯の長さ,標準差倍数,ストップ・パーセンテージなど) は,異なる市場と個人の好みに合わせて調整することができる.
戦略リスク
トレンドマーケットの不況:
- 強烈なトレンド市場では,価格が長期にわたって平均から偏り,戦略が大きなトレンドを逃してしまう可能性があります.
過剰取引のリスク:
- 波動性のある市場では,価格が中道を通過することが多く,取引過多と取引コストの上昇につながる.
固定ストップの限界:
- 2%の固定ストップは,特定の状況において過大または過小であり,すべての市場状況にうまく適応できない可能性があります.
スリップポイントと流動性のリスク:
- 流動性の低い市場では,正確な価格レベルで取引を行うことが困難になり,戦略のパフォーマンスに影響を与える可能性があります.
パラメータ感度:
- 策略のパフォーマンスはブリン帯のパラメータ設定に敏感であり,注意深く最適化および反測が必要である.
偽の侵入リスク:
- 2日間の確認のメカニズムがあるにもかかわらず,偽の突破が起こり,不必要な取引が起こる可能性があります.
戦略最適化の方向性
ダイナミック・ストップ・ダメージ:
- 市場変動に基づく動的ストップをATR (平均リアル波幅) の倍数として使用することを検討し,異なる市場条件に適した対応を図る.
複数の時間枠分析:
- 取引の方向がより大きな市場動向と一致していることを確認するために,より長い時間枠の分析を導入します.
定量化された確認指標:
- 入力信号の質を向上させるフィルターとして他の技術指標 (RSIやMACDなど) を追加する.
動的パラメータ最適化:
- ブリン帯のパラメータの動的調整を実現し,異なる市場周期と波動性に対応する.
ポジション管理の一部:
- リスクの管理と価格変動の捉え方を改善するために,分量貯蔵と貯蔵の仕組みを導入する.
市場環境のフィルター:
- 市場環境の識別メカニズムに参加し,平均値戻り取引に適さない市場環境で取引を一時停止する.
ストップアップの最適化:
- 価格の大きな変動を捉えるため,上線付近に追加のストップ条件を設定することを検討してください.
取引コストは
- 戦略の論理に取引コストを組み込むことを考慮し,小規模な取引を頻繁に行わないようにする.
要約する
ブリン帯平均値回帰取引戦略と動的サポートは,技術分析と統計学の原理を組み合わせた量的な取引方法である.ブリン帯指標を利用して,この戦略は,価格が平均値から偏った後にその回帰の機会を捕捉しようとし,同時に動的サポートとストップ損失メカニズムを使用してリスクを管理する.
この戦略の主な優点は,明確な取引ルールと市場の変動に動的に適応する能力である.しかし,それは強いトレンド市場での不良なパフォーマンスと,過剰取引の可能性のリスクにも直面している.
戦略の安定性と適応性をさらに向上させるために,ダイナミックストップ,マルチタイムフレーム分析,追加の確認指標,より複雑なポジション管理技術を導入することを考えることができます. 同時に,戦略パラメータの継続的な最適化と反測も不可欠です.
全体として,この戦略はトレーダーに価格の変動を捉え,リスクを管理するための体系的な方法を提供します.しかし,すべての取引戦略のように,それは万能ではありません.特定の市場条件と個人のリスクの好みに応じて調整および最適化が必要です.実用的なアプリケーションでは,トレーダーは,実物取引の前に十分なフィードバックと模擬取引を行い,戦略の特性と潜在的なリスクを十分に理解することをお勧めします.
/*backtest
start: 2023-07-25 00:00:00
end: 2024-07-30 00:00:00
period: 1d
basePeriod: 1h
exchanges: [{"eid":"Futures_Binance","currency":"BTC_USDT"}]
*/

//@version=5
strategy("Mean Reversion Strategy with Bollinger Bands", overlay=true)

// Bollinger Bands settings
length = input.int(20, minval=1, title="Bollinger Bands Length")
src = input(close, title="Source")
mult = input.float(2.0, minval=0.1, title="Bollinger Bands Multiplier")

// Calculate Bollinger Bands
basis = ta.sma(src, length)
dev = mult * ta.stdev(src, length)
upper = basis + dev
lower = basis - dev

// Plot Bollinger Bands
plot(basis, title="Middle Band", color=color.blue)
p1 = plot(upper, title="Upper Band", color=color.red)
p2 = plot(lower, title="Lower Band", color=color.red)
fill(p1, p2, color=color.rgb(255, 0, 0, 90))

// Buy condition: Price crosses above the middle band
longCondition = ta.crossover(close, basis)

// Close condition: Price touches the middle band
closeCondition = ta.crossunder(close, basis)

// Emergency stop condition: Price drops below 2% of entry price
dropCondition = strategy.position_size > 0 and close < strategy.position_avg_price * 0.98

// Plot Buy/Sell Signals only on initial cross
plotshape(series=longCondition, location=location.belowbar, color=color.green, style=shape.triangleup, textcolor=color.black, text="BUY", size=size.small)
plotshape(series=closeCondition and not dropCondition, location=location.abovebar, color=color.red, style=shape.triangledown, textcolor=color.black, text="SELL", size=size.small)
plotshape(series=dropCondition, location=location.abovebar, color=color.red, style=shape.triangledown, textcolor=color.black, text="STOP", size=size.small)

// Track entry date to ensure no same-day buy/sell
var float entryPrice = na
var int entryYear = na
var int entryMonth = na
var int entryDay = na

// Strategy Logic
if (longCondition and (na(entryDay) or (year != entryYear or month != entryMonth or dayofmonth != entryDay)))
    strategy.entry("Long", strategy.long)
    entryPrice := close
    entryYear := year
    entryMonth := month
    entryDay := dayofmonth

if ((closeCondition or dropCondition) and strategy.position_size > 0 and (na(entryDay) or (year != entryYear or month != entryMonth or dayofmonth != entryDay or dropCondition)))
    strategy.close("Long")
    entryDay := na