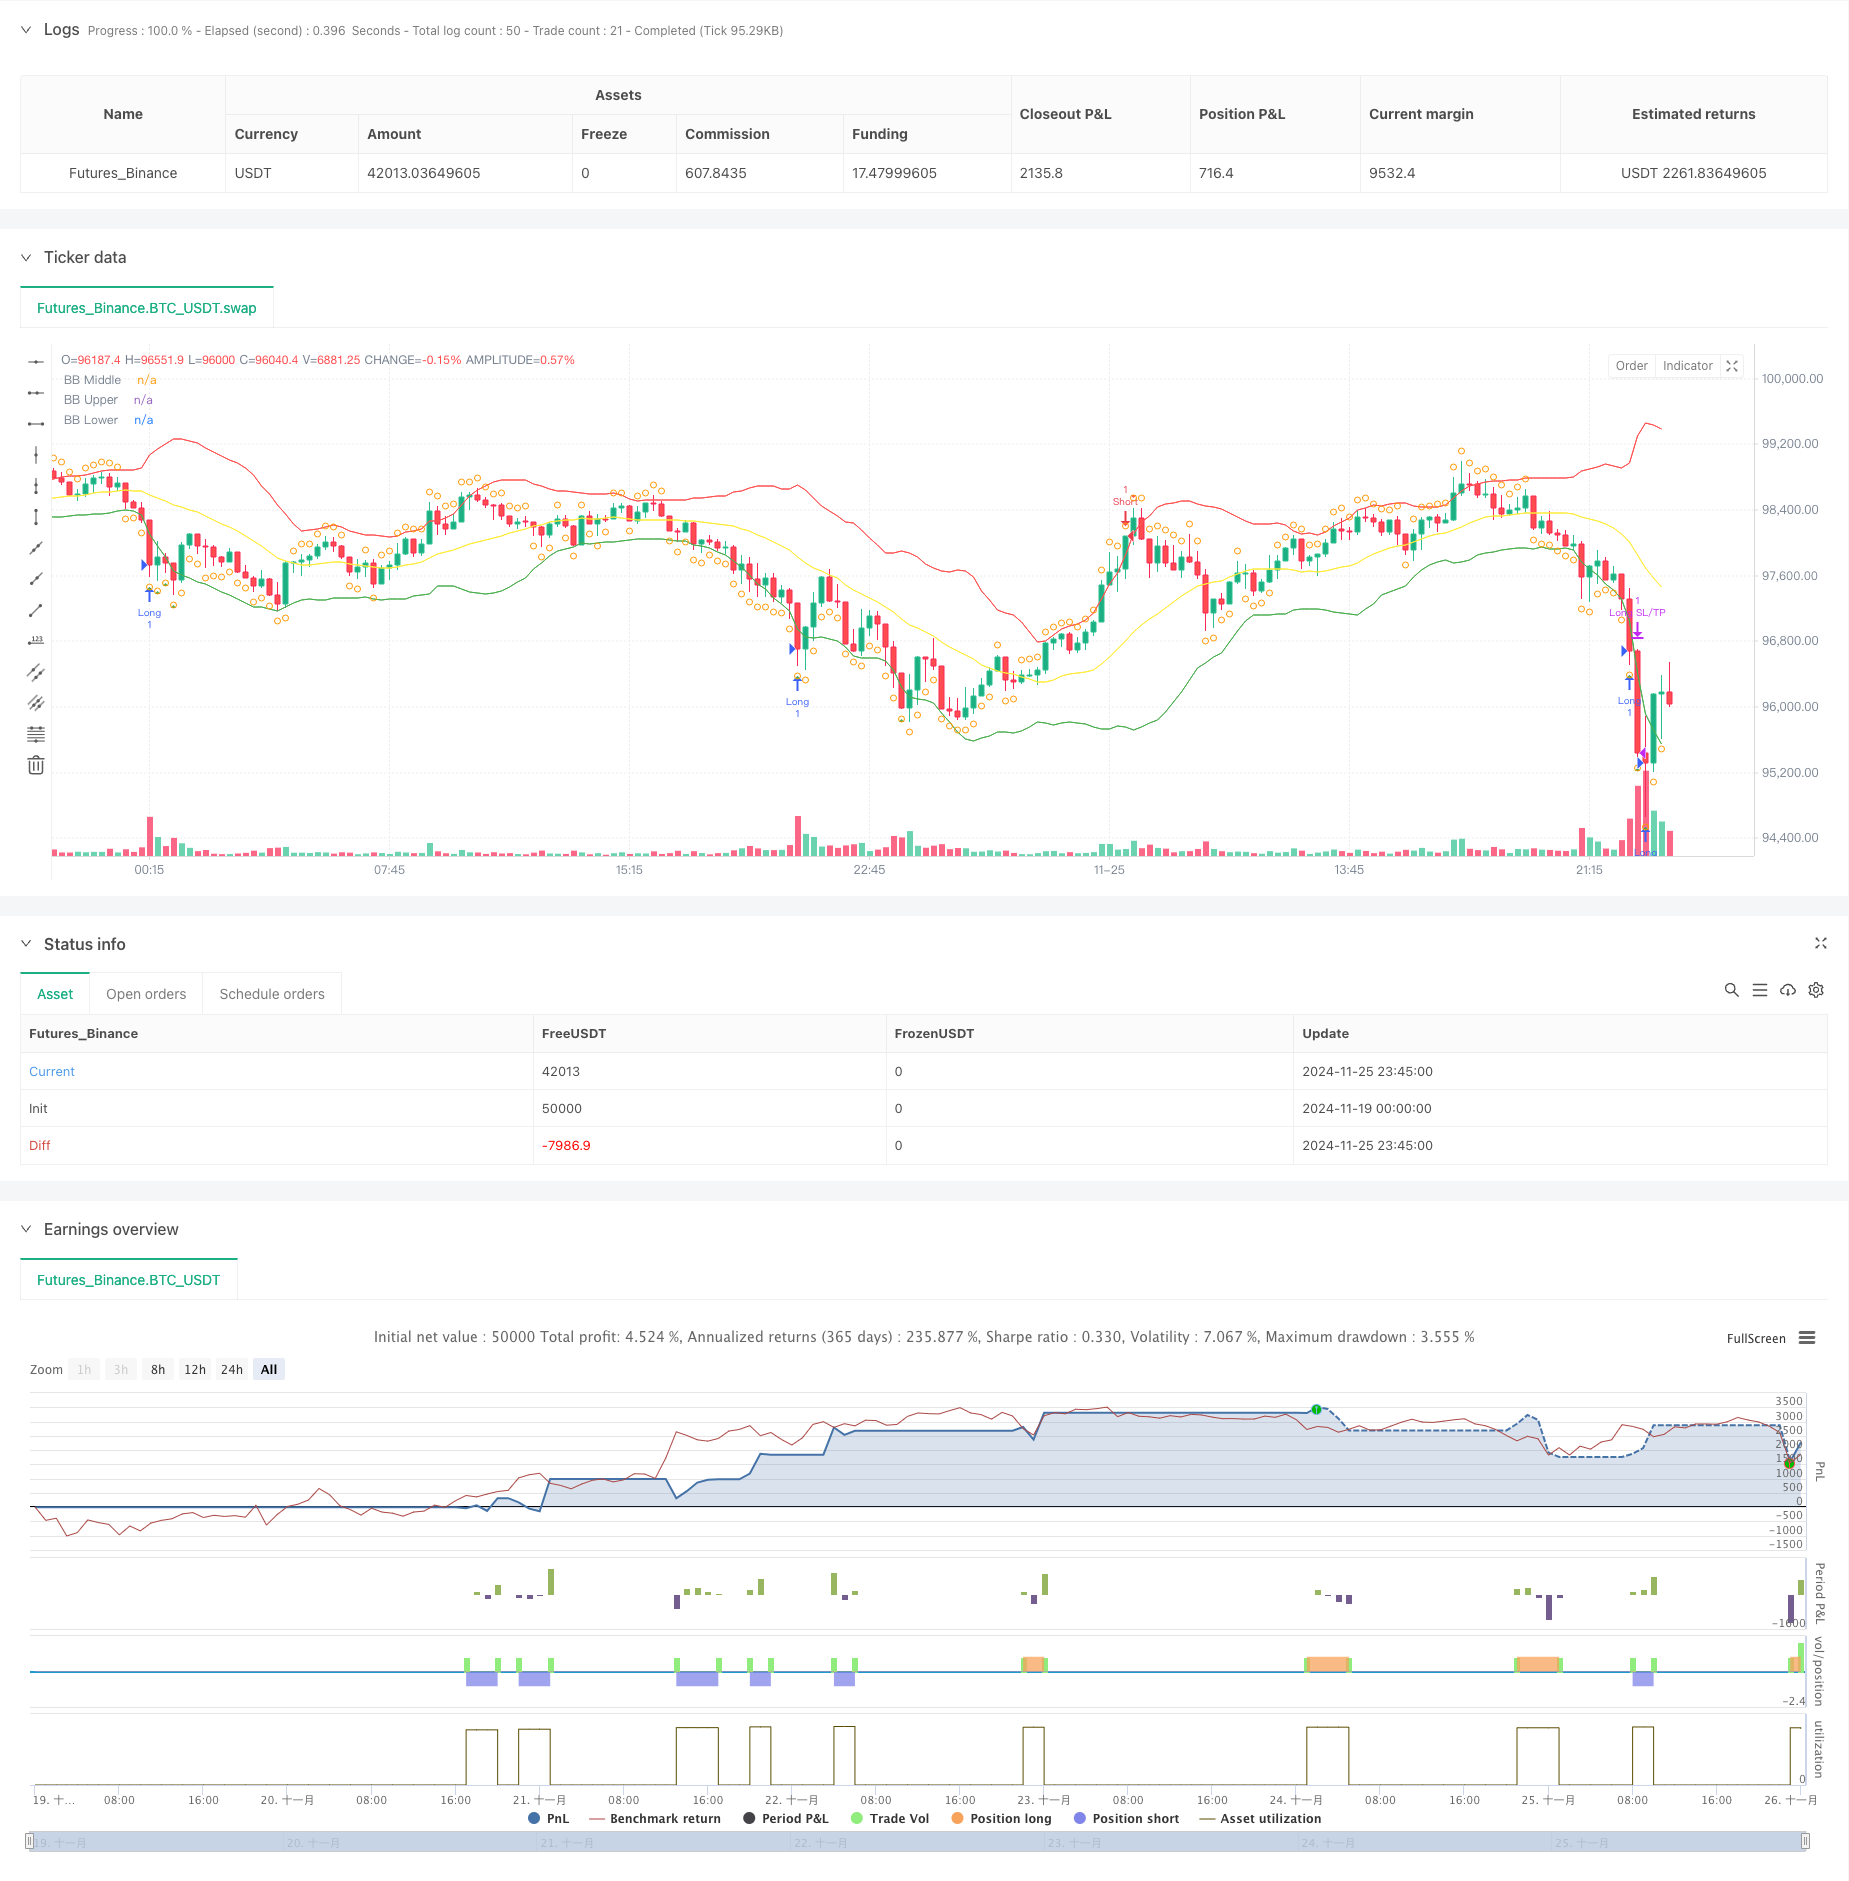
Bollinger Bands,RSI,ATRベースのダイナミックストップ・ロース・システムによる平均逆転戦略
作者: リン・ハーンチャオチャン,日付: 2024年11月27日 14:28:17タグ:BBRSIATRMR

概要
この戦略は,ボリンジャーバンド,RSI指標,ATRベースのダイナミックストップ・ロスのメカニズムを組み合わせた平均逆転理論に基づく定量的な取引システムである.この戦略は,平均値から極端な価格偏差を特定し,価格がボリンジャーバンドの下部に触れたとき,RSIが過剰販売領域にあり,価格がボリンジャーバンド上部に触れたとき,RSIが過剰購入領域にあり,ATRを使用して,効果的なリスク報酬管理のためにストップ・ロスのレベルと収益をダイナミックに設定する.
戦略の原則
この戦略は20期ボリンジャーバンドを主要トレンドインジケーターとして採用し,標準偏差倍数2.0で価格動きの境界を決定する. 14期RSIは補足指標として組み込まれ,30未満の値が過売れ,70を超える値が過買いとみなされる. 価格が下帯を下回り,RSIが30以下になるとロングポジションが開始され,潜在的過売状況を示すが,価格が上帯を下回り,RSIが70以上になるとショートポジションが取られる. 中間帯はポジション管理のためのRSI逆転信号と組み合わせた利益引き上げレベルとして機能する. さらに,14期ATRベースのダイナミック損失目標メカニズムが実装され,リスクを正確に制御するために2xATRで利益停止と3xATRで停止を設定する.
戦略 の 利点
- 多指標クロスバディレーション:ボリンジャーバンドとRSIの組み合わせは,誤った信号を効果的にフィルターし,取引の精度を向上させます.
- ダイナミックストップ・ロースメカニズム: ATRに基づくストップ・ロースとテイク・プロフィートの調整は,市場の変動に対応する.
- 完全な取引回路: 明確なエントリー・退出条件,一貫した論理を持つリスク管理メカニズムを含む.
- 高い適応性: 戦略パラメータは,異なる市場特性に最適化できます.
戦略リスク
- トレンド市場リスク: 平均逆転戦略は,強いトレンド市場で頻繁に停止する可能性があります.
- パラメータの敏感性:ボリンジャー・バンドの期間とRSIの
値の設定は,戦略のパフォーマンスに大きく影響します. - 出口タイミング: 中帯出口は,有利な条件下でポジションを早期に閉じる可能性があります.
- ストップ・ロスの大きさは,高波動期間に固定ATR倍数ストップが過剰である可能性があります.
オプティマイゼーションの方向性
- トレンドフィルターを追加する: 強いトレンドで反トレンド取引を避けるために,より長い期間の移動平均を組み込むことを検討する.
- 取引の質を向上させるために,取引信号の確認指標として取引量の指標を統合する.
- 利得を最適化する: 利得性を高めるため,トライリングストップやスケーラアウトアウト方法の実施を検討する.
- ダイナミックパラメータ調整:市場変動に基づいてボリンジャーバンドとRSIパラメータの適応調整を実施する.
概要
この戦略は,ボリンジャーバンドとRSIの組み合わせによる包括的な平均逆転取引システムを構築する.ATRベースのダイナミックストップの導入は,リスクを効果的に制御し,有利なリスク・リターン特性を提供します.最適化のための余地がある一方で,全体的な設計コンセプトは明確で実用的です.トレーダーは特定の市場の特徴に応じてパラメータを調整し,ライブ取引で戦略のパフォーマンスを継続的に監視することをお勧めします.
/*backtest
start: 2024-11-19 00:00:00
end: 2024-11-26 00:00:00
period: 15m
basePeriod: 15m
exchanges: [{"eid":"Futures_Binance","currency":"BTC_USDT"}]
*/

//@version=5
strategy("SOL/USDT Mean Reversion Strategy", overlay=true)

// Input parameters
length = input(20, "Bollinger Band Length")
std_dev = input(2.0, "Standard Deviation")
rsi_length = input(14, "RSI Length")
rsi_oversold = input(30, "RSI Oversold")
rsi_overbought = input(70, "RSI Overbought")

// Calculate indicators
[middle, upper, lower] = ta.bb(close, length, std_dev)
rsi = ta.rsi(close, rsi_length)

// Entry conditions
long_entry = close < lower and rsi < rsi_oversold
short_entry = close > upper and rsi > rsi_overbought

// Exit conditions
long_exit = close > middle or rsi > rsi_overbought
short_exit = close < middle or rsi < rsi_oversold

// Strategy execution
if (long_entry)
    strategy.entry("Long", strategy.long)

if (short_entry)
    strategy.entry("Short", strategy.short)

if (long_exit)
    strategy.close("Long")

if (short_exit)
    strategy.close("Short")

// Stop loss and take profit
atr = ta.atr(14)
strategy.exit("Long SL/TP", "Long", stop=strategy.position_avg_price - 2*atr, limit=strategy.position_avg_price + 3*atr)
strategy.exit("Short SL/TP", "Short", stop=strategy.position_avg_price + 2*atr, limit=strategy.position_avg_price - 3*atr)

// Plot indicators
plot(middle, color=color.yellow, title="BB Middle")
plot(upper, color=color.red, title="BB Upper")
plot(lower, color=color.green, title="BB Lower")

// Plot entry and exit points
plotshape(long_entry, title="Long Entry", location=location.belowbar, color=color.green, style=shape.triangleup, size=size.small)
plotshape(short_entry, title="Short Entry", location=location.abovebar, color=color.red, style=shape.triangledown, size=size.small)
plotshape(long_exit, title="Long Exit", location=location.abovebar, color=color.orange, style=shape.circle, size=size.small)
plotshape(short_exit, title="Short Exit", location=location.belowbar, color=color.orange, style=shape.circle, size=size.small)
関連性
- RSI・ボリンジャー・バンド統合戦略: ダイナミック・セルフアダプティブ・マルチインジケータ・トレーディング・システム
- 複数の指標を備えた インテリジェントピラミッド戦略
- 動的平均逆転とモメント戦略
- 高精度なRSIとボリンジャーバンドのブレイクアウト戦略
- 逆波動性ブレイクアウト戦略
- VWAP と RSI ダイナミック・ボリンガー・バンドは,利益とストップ・ロスの戦略をとる
- 複数の技術指標の統合を備えたAI最適化された適応型ストップ損失取引システム
- 賢明な時間に基づく長短回転バランスのとれた取引戦略
- モメントフィルター統合システムで強化されたボリンジャーブレイク量的な戦略
- ビッグ・レッド・キャンドル・ブレイク・バイ・ストラテジー
もっと
- 複数の技術指標の統合を備えたAI最適化された適応型ストップ損失取引システム
- 多期移動平均のクロスオーバーと量分析システム
- 二重移動平均勢力の追跡量的な戦略
- 調整可能なストップ・ロストとテイク・プロフィートを持つ二重移動平均クロスオーバー戦略
- 動向オシレーターに基づく戦略をフォローする適応傾向
- PVT-EMA トレンド・クロスオーバー・ボリューム・価格戦略
- MACD-EMA 多期動的クロスオーバー量的な取引システム
- MACD ダイナミック・オシレーション・クロスプレジクション戦略
- VWAP-ATR ダイナミック・プライス・アクション・トレーディング・システム
- Bollinger Bands と RSI クロス ベース ダイナミック トレンド 定量 戦略
- パラボリックSAR指標に基づくダイナミック取引戦略システム
- アダプティブ・ボラティリティ・アンド・モメント・量子トレード・システム (AVMQTS)
- Bollinger Bands と Candlestick パターンに基づく高度なトレンド取引戦略
- 脱出戦略の後にATR波動性と移動平均に基づく適応傾向
- 全体キャンドルシグナルシステムとダブルEMAモメンタムトレンド・トレード戦略
- RSI最適化システムとダブルタイムフレームスーパートレンド
- ダイナミックストップ・ロストとテイク・プロフィートシステムによる戦略をフォローする二重移動平均クロスオーバートレンド
- ATRとMACD統合付きの多期トレンドフォロー・トレード・システム
- 2つのタイムフレームスーパートレンド RSI インテリジェント・トレーディング・戦略
- 双重MACD価格アクションブレイク トレイリング戦略