トレンドブレイク・トレード戦略によるマルチタイムフレームフィボナッチ・リトラセメント
作者: リン・ハーンチャオチャン,日付: 2024-12-11 17:32:25タグ:FIBOSMARSIRRTF

概要
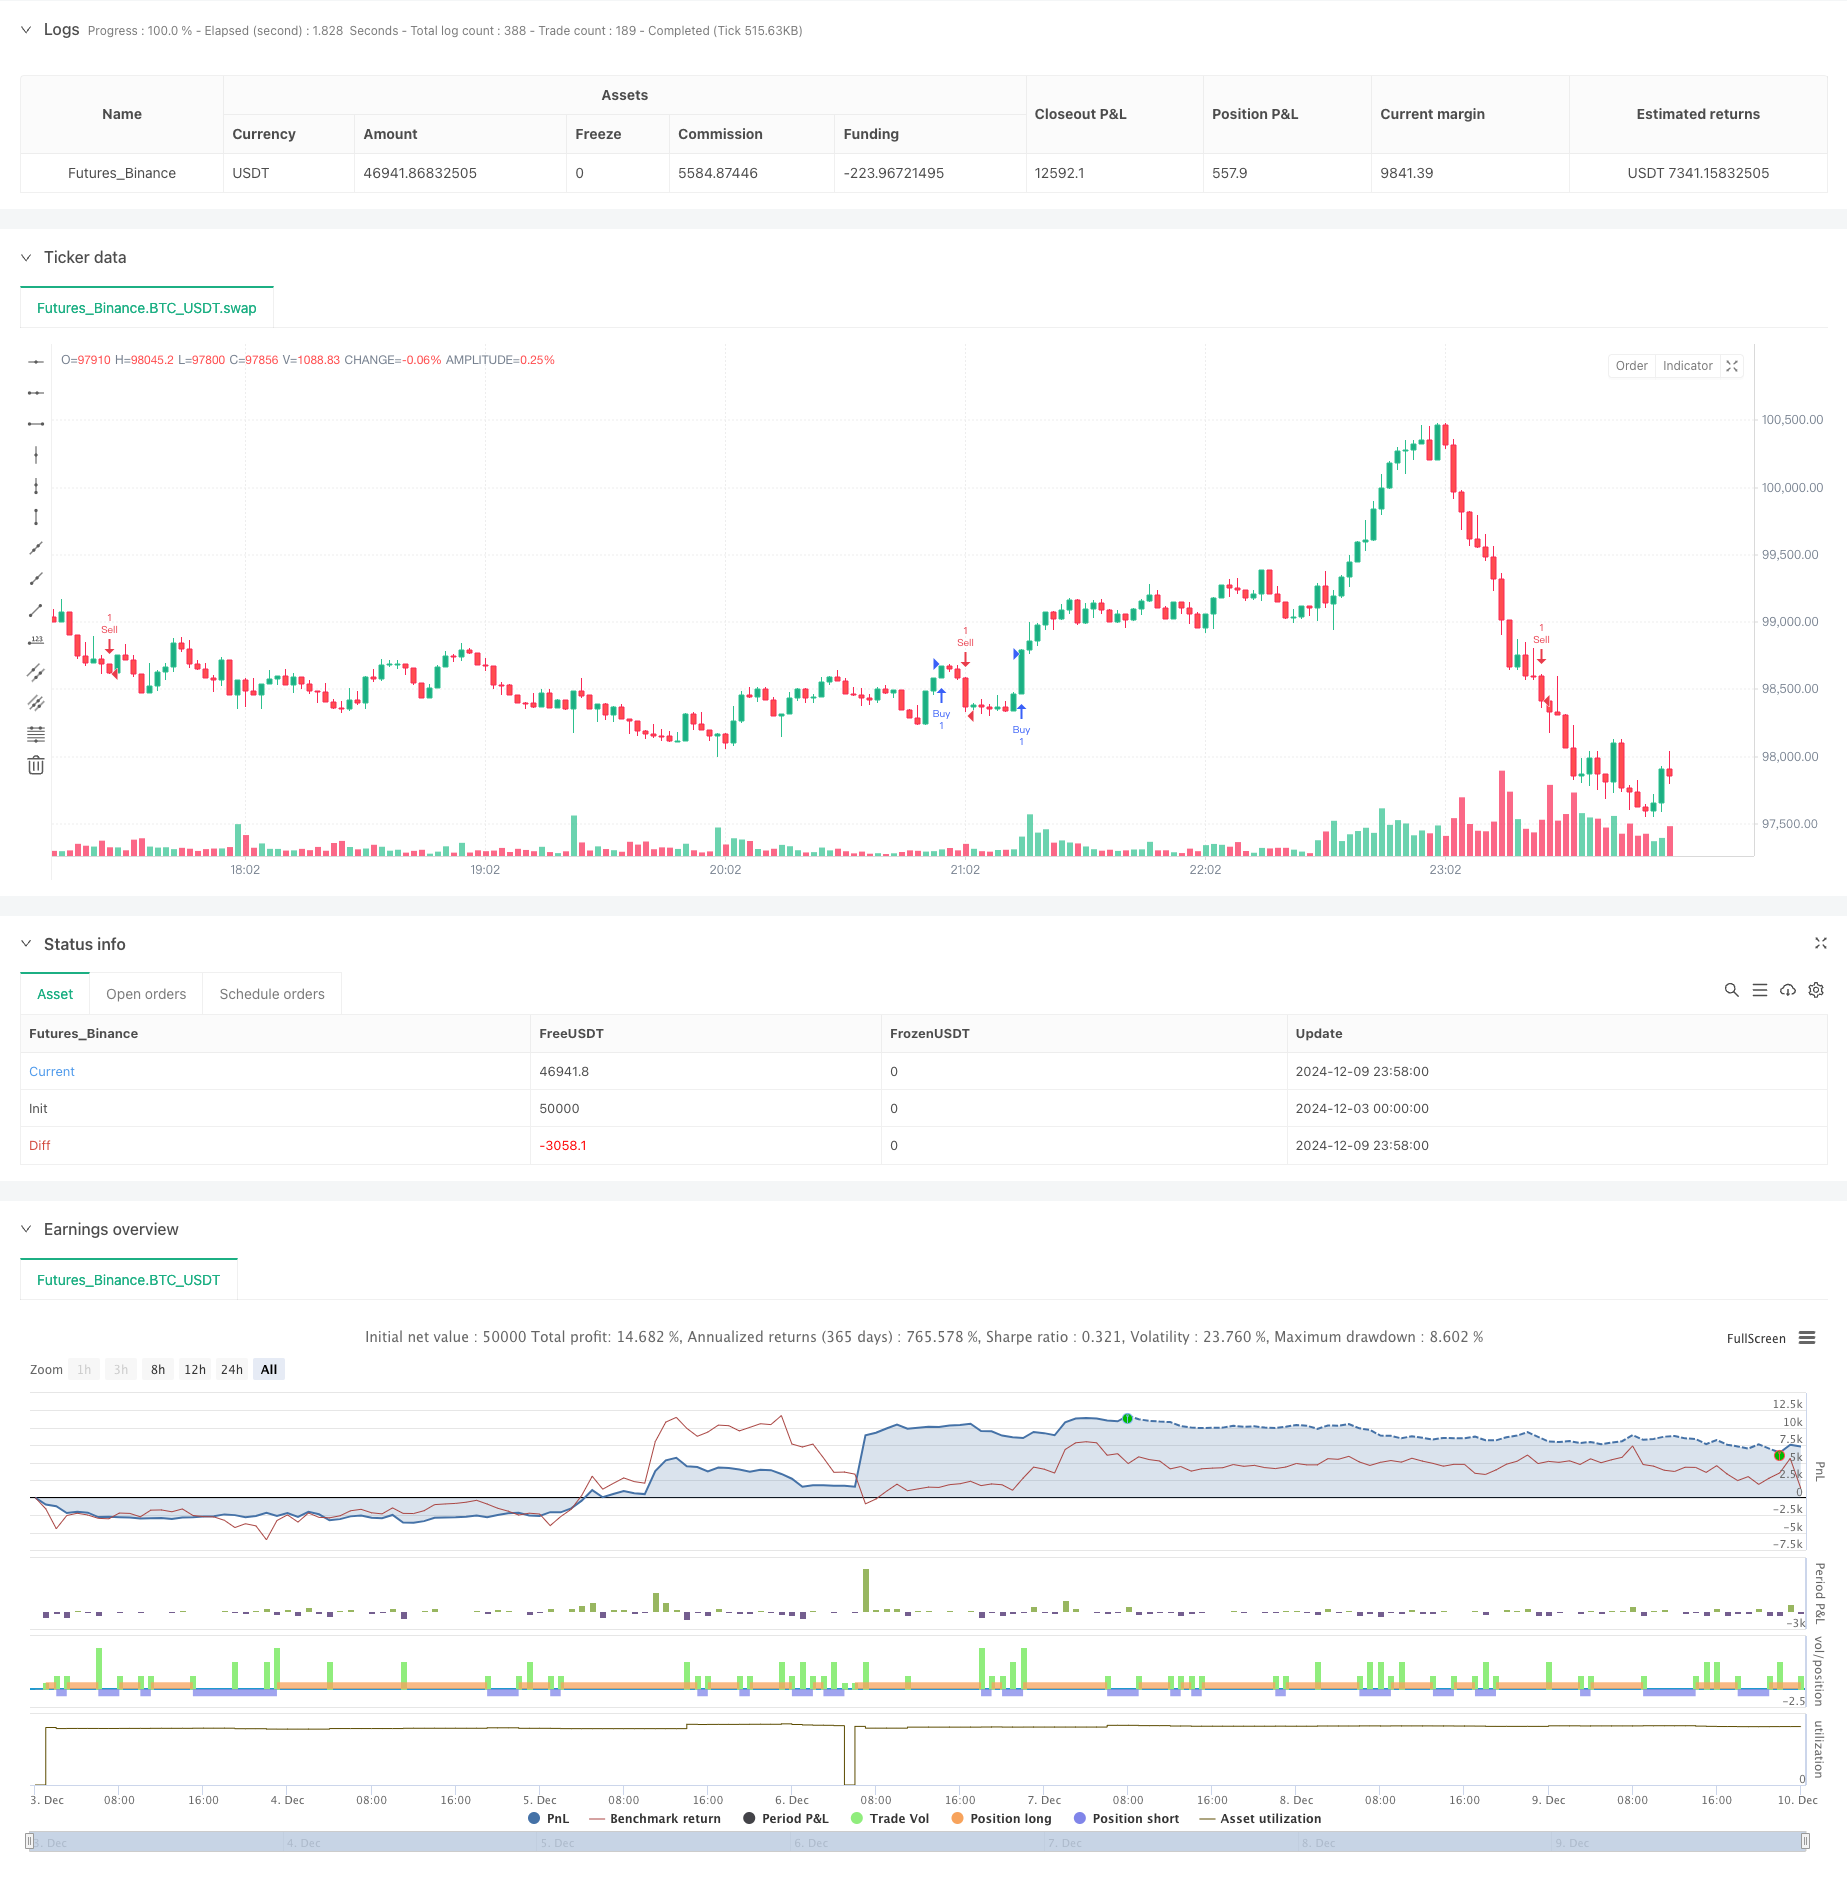
この戦略は,フィボナッチリトレースメントレベルとキャンドルスタックパターンに基づいたトレンドトレーディングシステムである.技術分析とリスク管理原則を組み合わせて,複数のタイムフレームで動作する.戦略は,主にリスク管理のためのストップ損失と利益目標を活用しながら,主要なフィボナッチリトレースメントレベル (0.618と0.786) を特定することによって取引機会を探している.
戦略の原則
戦略の基本的な論理は,いくつかの重要な要素に基づいています. 1. タイムフレーム選択: 戦略は,異なる取引スタイルに対応するために4時間,日,週,月を含む複数のタイムフレームで動作することができます. 2. フィボナッチレベル計算: 50 期間の高値と低値を使用して,0.618 と 0.786 の 2 つのキーリトラセーションレベルを計算します. 3.エントリー・シグナル生成: 閉値が特定の条件下でフィボナッチレベルを突破したとき,システムはロング・またはショート・シグナルを生成する.ロング・シグナルには閉値が開値以上,0.618レベル以上である必要がある.ショート・シグナルには閉値が開値以下,0.786レベル以下である必要がある. 4. リスク管理: 戦略は固定パーセントのストップロスを採用し,事前に設定されたリスク・リターン比率を通じて利益目標を決定する.
戦略 の 利点
- 複数のタイムフレームに適応可能: 異なるタイムフレームで動作することで,戦略は様々な市場環境と取引スタイルに適応できます.
- 体系的なリスク管理:各取引に対して事前に設定されたストップ・ロストと利益目標による明確なリスク管理.
- テクニカル・インディケーター・インテグレーション: フィボナッチ・リトラセーションとキャンドルスタイク・パターンの分析を組み合わせて,より信頼性の高い取引信号を提示する.
- 高度なカスタマイズ可能性: フィボナッチレベル,リスク・リターン比,ストップ・ロスの割合などのキーパラメータは,個人の好みに合わせて調整できます.
戦略リスク
- 市場変動リスク:高変動期間の間,価格はストップ・ロスのレベルを急速に突破して損失を引き起こす可能性があります.
- 誤ったブレイクリスク:フィボナッチレベルでは市場が誤ったブレイクシグナルを生む可能性があります.
- パラメータ最適化リスク: パラメータの過剰な最適化により,ライブ取引における戦略のパフォーマンスが低下する可能性があります.
- 流動性リスク: 特定の時間枠や市場条件下で十分な流動性がない可能性があります.
戦略の最適化方向
- Market Trend Filter を追加する:逆トレンド信号をフィルタリングするために移動平均値または他のトレンド指標を追加することができます.
- 入力タイミングを最適化:入力の精度を向上させるために,ボリューム確認またはモメント指標を追加することを検討します.
- ダイナミックストップロスの管理: 変動性に基づくダイナミックストップロスの実施により,異なる市場状況に適応する.
- 時間フィルタリングを追加します.不利な市場期間を避けるために取引時間窓の制限を組み込む.
- 多次元信号確認:追加の信号確認のために他の技術指標を統合する.
概要
この戦略は,フィボナッチリトレースメント,キャンドルスティックパターン,リスク管理原則を組み合わせて,トレーダーに体系的な取引アプローチを提供する,よく構造化されたトレンドフォロー戦略である.特定のリスクが存在している一方で,戦略の安定性と信頼性は,提案された最適化方向によってさらに強化することができる.戦略のマルチタイムフレーム性質とカスタマイズ可能なパラメータは,さまざまなタイプのトレーダーに適している.
/*backtest
start: 2024-12-03 00:00:00
end: 2024-12-10 00:00:00
period: 2m
basePeriod: 2m
exchanges: [{"eid":"Futures_Binance","currency":"BTC_USDT"}]
*/

// This Pine Script™ code is subject to the terms of the Mozilla Public License 2.0 at https://mozilla.org/MPL/2.0/
// © jontucklogic7467

//@version=5
strategy("Fibonacci Swing Trading Bot", overlay=true)

// Input parameters
fiboLevel1 = input.float(0.618, title="Fibonacci Retracement Level 1")
fiboLevel2 = input.float(0.786, title="Fibonacci Retracement Level 2")
riskRewardRatio = input.float(2.0, title="Risk/Reward Ratio")
stopLossPerc = input.float(1.0, title="Stop Loss Percentage") / 100

// Timeframe selection
useTimeframe = input.timeframe("240", title="Timeframe for Analysis", options=["240", "D", "W", "M"])

// Request data from selected timeframe
highTF = request.security(syminfo.tickerid, useTimeframe, high)
lowTF = request.security(syminfo.tickerid, useTimeframe, low)

// Swing high and low calculation over the last 50 bars in the selected timeframe
highestHigh = ta.highest(highTF, 50)
lowestLow = ta.lowest(lowTF, 50)

// Fibonacci retracement levels
fib618 = highestHigh - (highestHigh - lowestLow) * fiboLevel1
fib786 = highestHigh - (highestHigh - lowestLow) * fiboLevel2

// Plot Fibonacci levels
// line.new(bar_index[1], fib618, bar_index, fib618, color=color.red, width=2, style=line.style_dashed)
// line.new(bar_index[1], fib786, bar_index, fib786, color=color.orange, width=2, style=line.style_dashed)

// Entry signals based on candlestick patterns and Fibonacci levels
bullishCandle = close > open and close > fib618 and close < highestHigh
bearishCandle = close < open and close < fib786 and close > lowestLow

// Stop loss and take profit calculation
stopLoss = bullishCandle ? close * (1 - stopLossPerc) : close * (1 + stopLossPerc)
takeProfit = bullishCandle ? close + (close - stopLoss) * riskRewardRatio : close - (stopLoss - close) * riskRewardRatio

// Plot buy and sell signals
if bullishCandle
    strategy.entry("Buy", strategy.long)
    strategy.exit("Take Profit", "Buy", limit=takeProfit, stop=stopLoss)

if bearishCandle
    strategy.entry("Sell", strategy.short)
    strategy.exit("Take Profit", "Sell", limit=takeProfit, stop=stopLoss)
- リスクマネジメントシステム付きの双重技術指標モメンタム逆転取引戦略
- リスク・リターン最適化システムを持つ二重移動平均のクロスRSIモメント戦略
- 高勝率トレンドは逆転トレード戦略を意味する
- 多指標トレンド・モメンタム・トレーディング・戦略:ボリンジャー・バンド,フィボナッチ,ATRをベースとした最適化された定量取引システム
- RSI トレンドモメンタム トレーディング戦略とダブルMAとボリューム確認
- Bollinger Bands RSI 市場中立量的な取引戦略
- ダイナミックストップ・ロストとテイク・プロフィート 双重移動平均トレンド キャンドルスティック反応の戦略に従う
- 相対強度指数 平均逆転戦略
- RSIフィルターとアラートを持つSMAクロスオーバー戦略
- 日中の買い/売る
- 双重BBI (bulls and bears index) クロスオーバー戦略
- 動的ロング/ショート・スウィング・トレーディング・ストラテジー
- 取引戦略をフォローするマルチテクニカル指標傾向
- 先進的な波動性平均逆転取引戦略:VIXと移動平均値に基づく多次元量的な取引システム
- 金のトレンドチャネル逆転のモメンタム戦略
- 先進的なEMAモメンタムトレンド取引戦略
- マルチMAトレンド・インテニシティ・トレーディング・戦略 - MA偏差に基づく柔軟なスマート・トレーディング・システム
- ボリューム重量化二重傾向検出システム
- 多要素対トレンド取引戦略
- 強化されたモメントオシレーターとストカスティックディバージェンスの定量取引戦略
- 多指標の傾向 利益の最適化による戦略
- フラクタル・ブレイクアウト・モメンタム・トレーディング・戦略
- チェンデ・モメンタム・オシレーターに基づいた適応型平均逆転取引戦略
- 取引戦略をフォローするMACD-スーパートレンド 双重確認傾向
- 多期スーパートレンド・ダイナミック・トレーディング・戦略
- Fibonacci リトラセッションとピボットポイント取引戦略のマルチタイムフレーム EMA
- 複数の時間枠で動的ストップ・ロスのEMA・スクリーズ・トレーディング戦略
- MACDと線形回帰の二重信号インテリジェント取引戦略
- 取引戦略をフォローするマルチEMA傾向
- 多期調整されたハイキン・アシ・トレンド 定量取引システム