개요
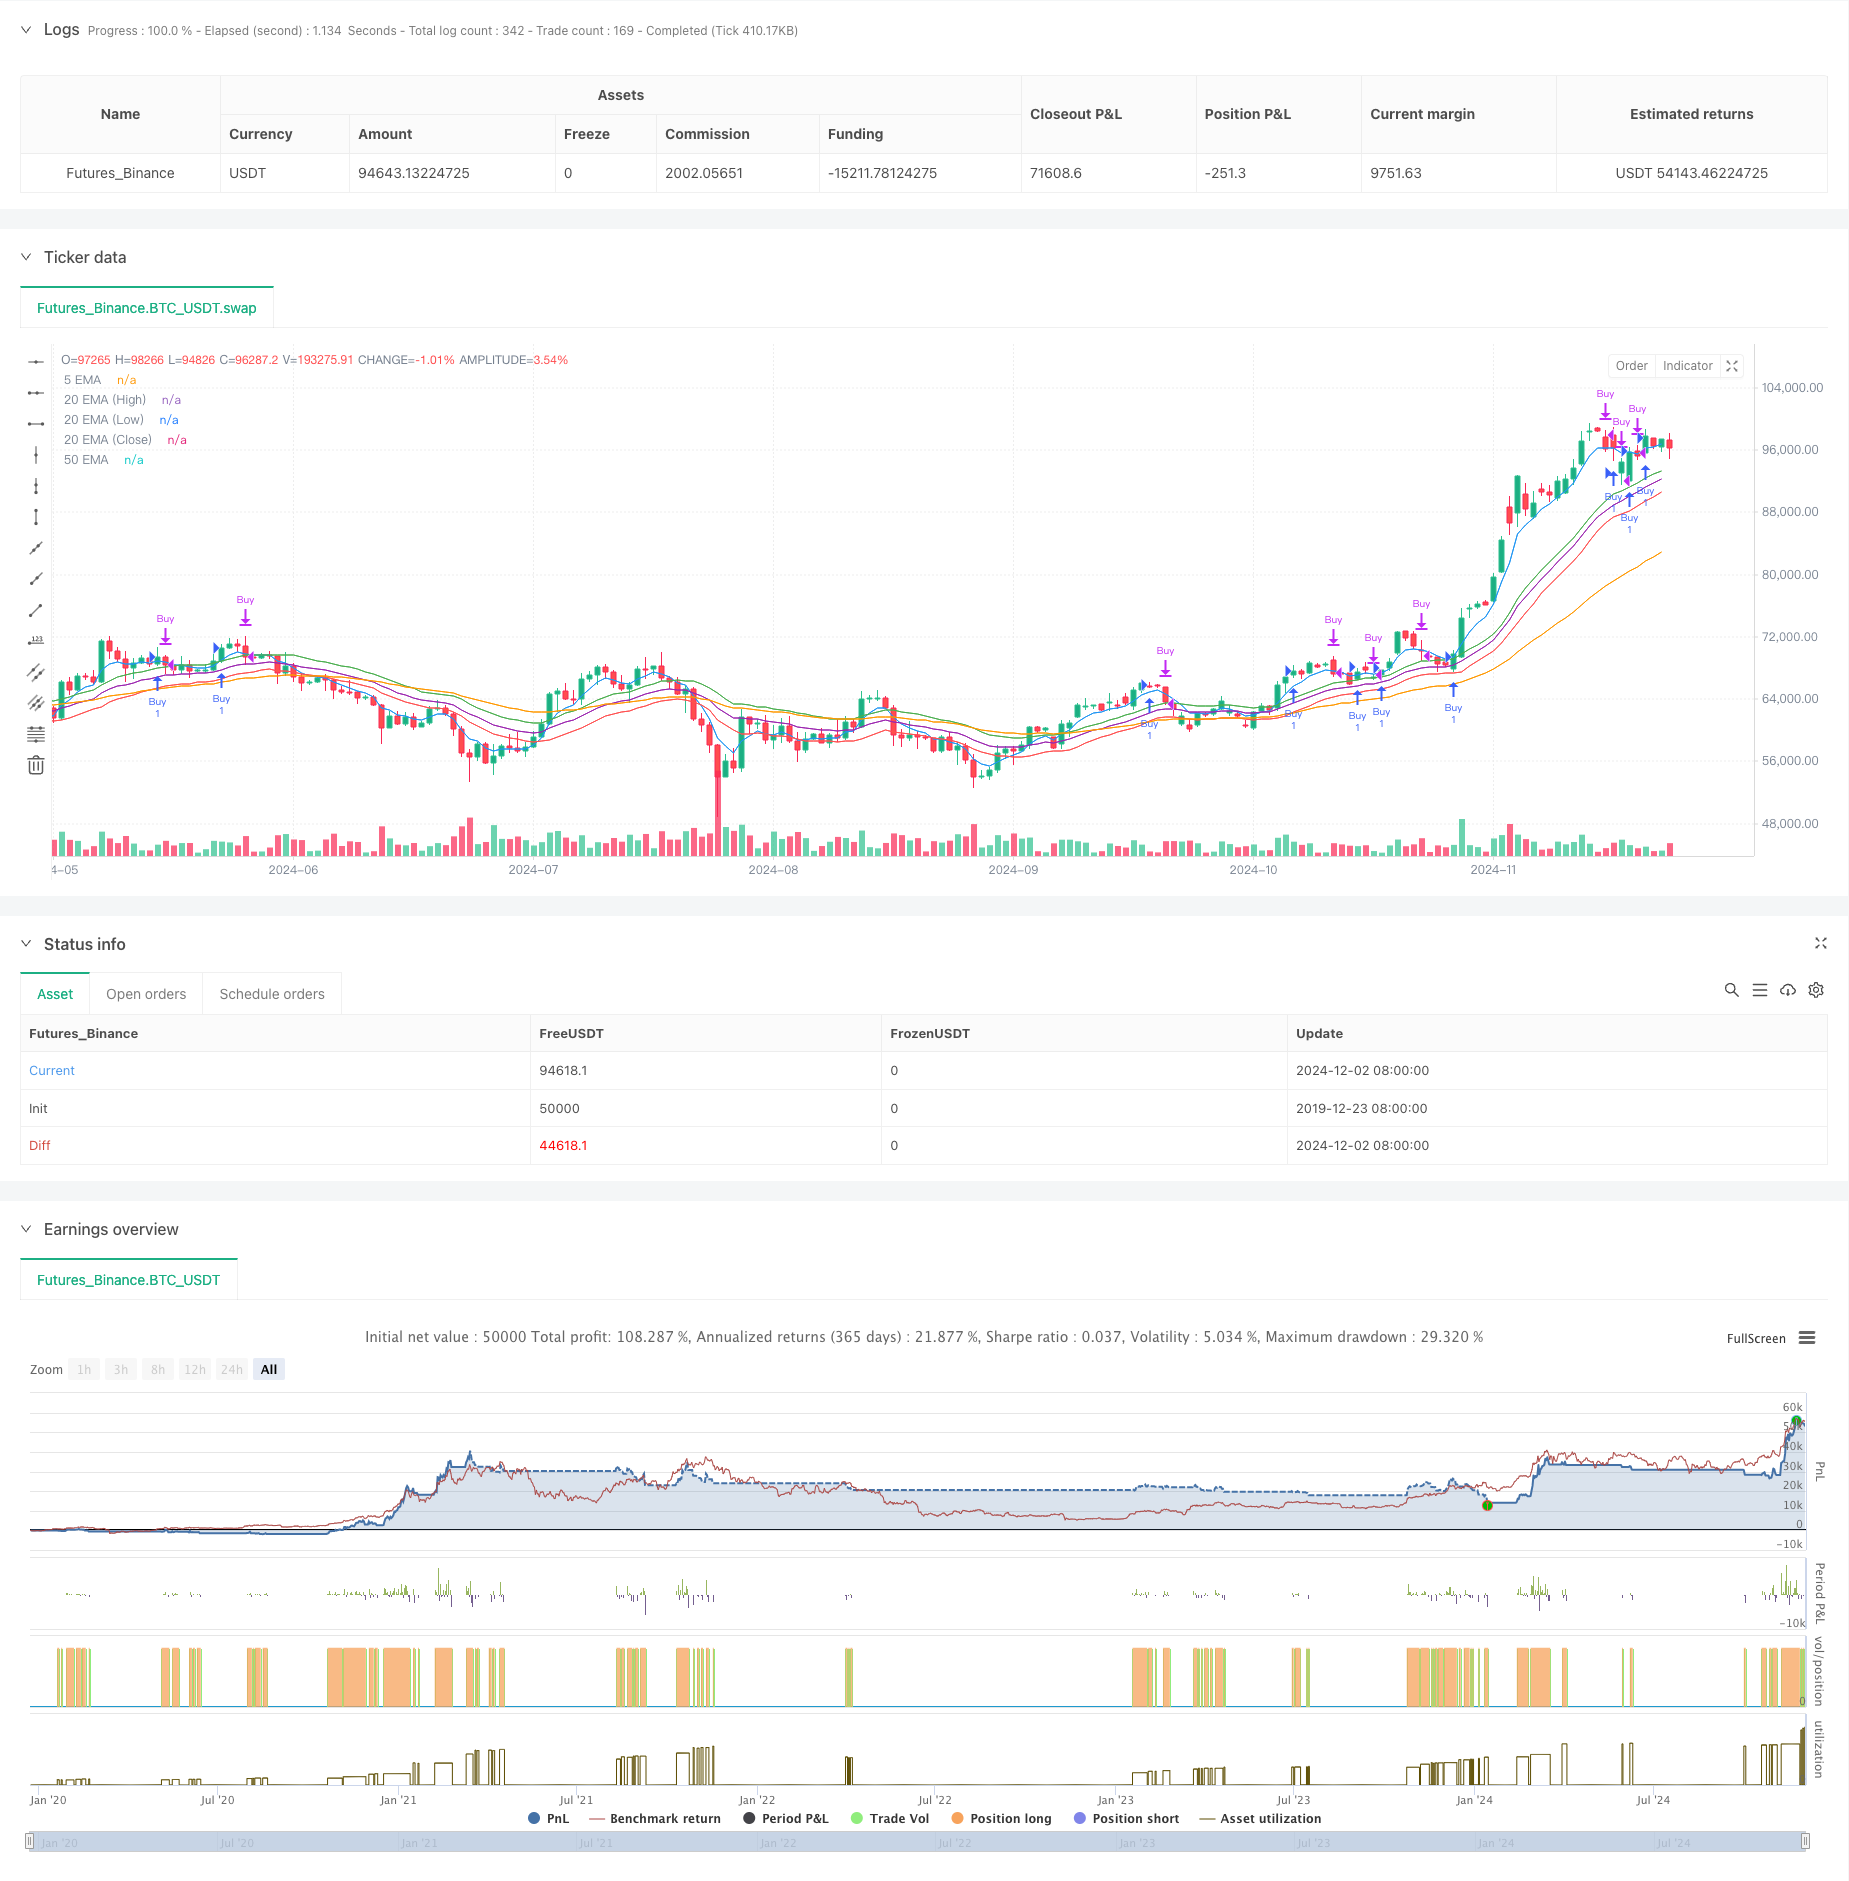
이 전략은 다중 지수 이동 평균 ((EMA) 에 기반한 자동 거래 시스템으로, 5주기, 20주기, 50주기 EMA의 계층적 판단을 통해 거래 신호를 구축한다. 시스템 설계의 특징은 고위, 낮은, 그리고 종결 가격에 기반한 다중 EMA 판단을 채택하고, 동적 스톱 손실과 추적 스톱 메커니즘을 결합하여 위험을 효과적으로 제어하면서 수익을 잠금하는 것이다.
전략 원칙
이 전략은 EMA 교차와 위치 관계를 다중 시간 주기에 기초하여 거래 결정을 합니다. 구체적으로:
- 5주기, 20주기 (최고 가격, 최저 가격 및 종결 가격에 따라) 및 50주기 EMA를 사용합니다.
- 창고 구축 조건은 모든 지표가 명확한 다목적 배열을 나타내는 것을 요구합니다: 50EMA < 20EMA(하위점) < 20EMA(폐쇄점) < 20EMA(고위점) < 5EMA
- 동시에, 현재 가격이 모든 평균선 위에 있어야 강세를 보장할 수 있습니다.
- 출구는 이중 메커니즘을 사용합니다: 가격이 5주기 EMA를 넘어갈 때 이익을 얻거나 20주기 EMA의 하락점을 만질 때 손실을 입습니다.
전략적 이점
- 계층화 필터링 메커니즘은 가짜 신호를 크게 감소시킵니다.
- 다중 EMA의 교차 확인을 사용하여 거래의 정확성을 향상시킵니다.
- 동적 중지 위치 시장의 변동에 따라 조정, 적응력 강
- 이 시스템은 완전히 자동화되어 인간의 정서적 방해가 없습니다.
- 트래킹 스톱 메커니즘을 적용하여 수익을 효과적으로 고정합니다.
전략적 위험
- 수평 변동 시장의 진출과 진출이 빈번할 수 있습니다.
- EMA는 기본적으로 지표가 뒤쳐져 있고, 시장의 출발점을 놓칠 수도 있습니다.
- 다중 조건으로 인해 일부 거래 기회를 놓칠 수 있습니다.
- 20EMA 하위에서 상대적으로 느슨하게 설정된 스톱 손실
전략 최적화 방향
- 수송량 확인 메커니즘을 증가시키고 신호 신뢰도를 높일 수 있다.
- 변동성 지표를 추가하고, 동적으로 포지션 크기를 조정하는 것을 고려하십시오
- 더 융통성 있는 방조제 도입, 예를 들어 수량 감축
- RSI와 같은 변동 지표와 결합하여 진입 시기를 최적화할 수 있습니다.
- 추세 강도를 판단하고 약점을 필터링하는 것을 고려하십시오.
요약하다
이것은 엄격하게 설계된 다중평평선 거래 시스템으로, 계층화 필터링과 동적 스톱 로저를 통해 위험을 효과적으로 제어한다. 빠른 상황을 놓칠 수 있지만, 트렌딩 시장에서 안정적으로 수행한다. 다른 시장 특성에 따라 파라미터를 적절히 조정하고 거래량과 같은 보조 지표를 추가하는 것을 고려하여 신뢰성을 높이는 것이 좋습니다. 이 전략은 안정적인 수익을 추구하는 중장기 투자자에게 적합하다.
전략 소스 코드
/*backtest
start: 2019-12-23 08:00:00
end: 2024-12-03 00:00:00
period: 1d
basePeriod: 1d
exchanges: [{"eid":"Futures_Binance","currency":"BTC_USDT"}]
*/

//@version=5
strategy("Automated EMA Strategy with Hierarchical Conditions", overlay=true)

// Inputs for EMA lengths
length_5 = 5
length_20 = 20
length_50 = 50

// Calculating EMAs
ema_5 = ta.ema(close, length_5)
ema_20_high = ta.ema(high, length_20)
ema_20_low = ta.ema(low, length_20)
ema_20_close = ta.ema(close, length_20)
ema_50 = ta.ema(close, length_50)

// Buy condition: 50 EMA < 20 EMA (Close) < 20 EMA (High) < 20 EMA (Low) < 5 EMA
// and LTP above all EMAs
buy_condition = ema_50 < ema_20_low and ema_20_low < ema_20_close and ema_20_close < ema_20_high and ema_20_high < ema_5 and close > ema_5 and close > ema_20_close and close > ema_20_high and close > ema_20_low and close > ema_50

// Stop-loss and target levels
stop_loss = ema_20_low

// Target condition: Close below 5 EMA
target_condition = close < ema_5

// Check if there's an open position
is_in_position = strategy.position_size > 0

// Execute Buy Signal only if no position is open
if (buy_condition and not is_in_position)
    strategy.entry("Buy", strategy.long)

// Exit conditions: Stop-loss or target (close below 5 EMA)
if (is_in_position and (target_condition or close < stop_loss))
    strategy.close("Buy")

// Plotting the EMAs
plot(ema_5, color=color.blue, title="5 EMA")
plot(ema_20_high, color=color.green, title="20 EMA (High)")
plot(ema_20_low, color=color.red, title="20 EMA (Low)")
plot(ema_20_close, color=color.purple, title="20 EMA (Close)")
plot(ema_50, color=color.orange, title="50 EMA")