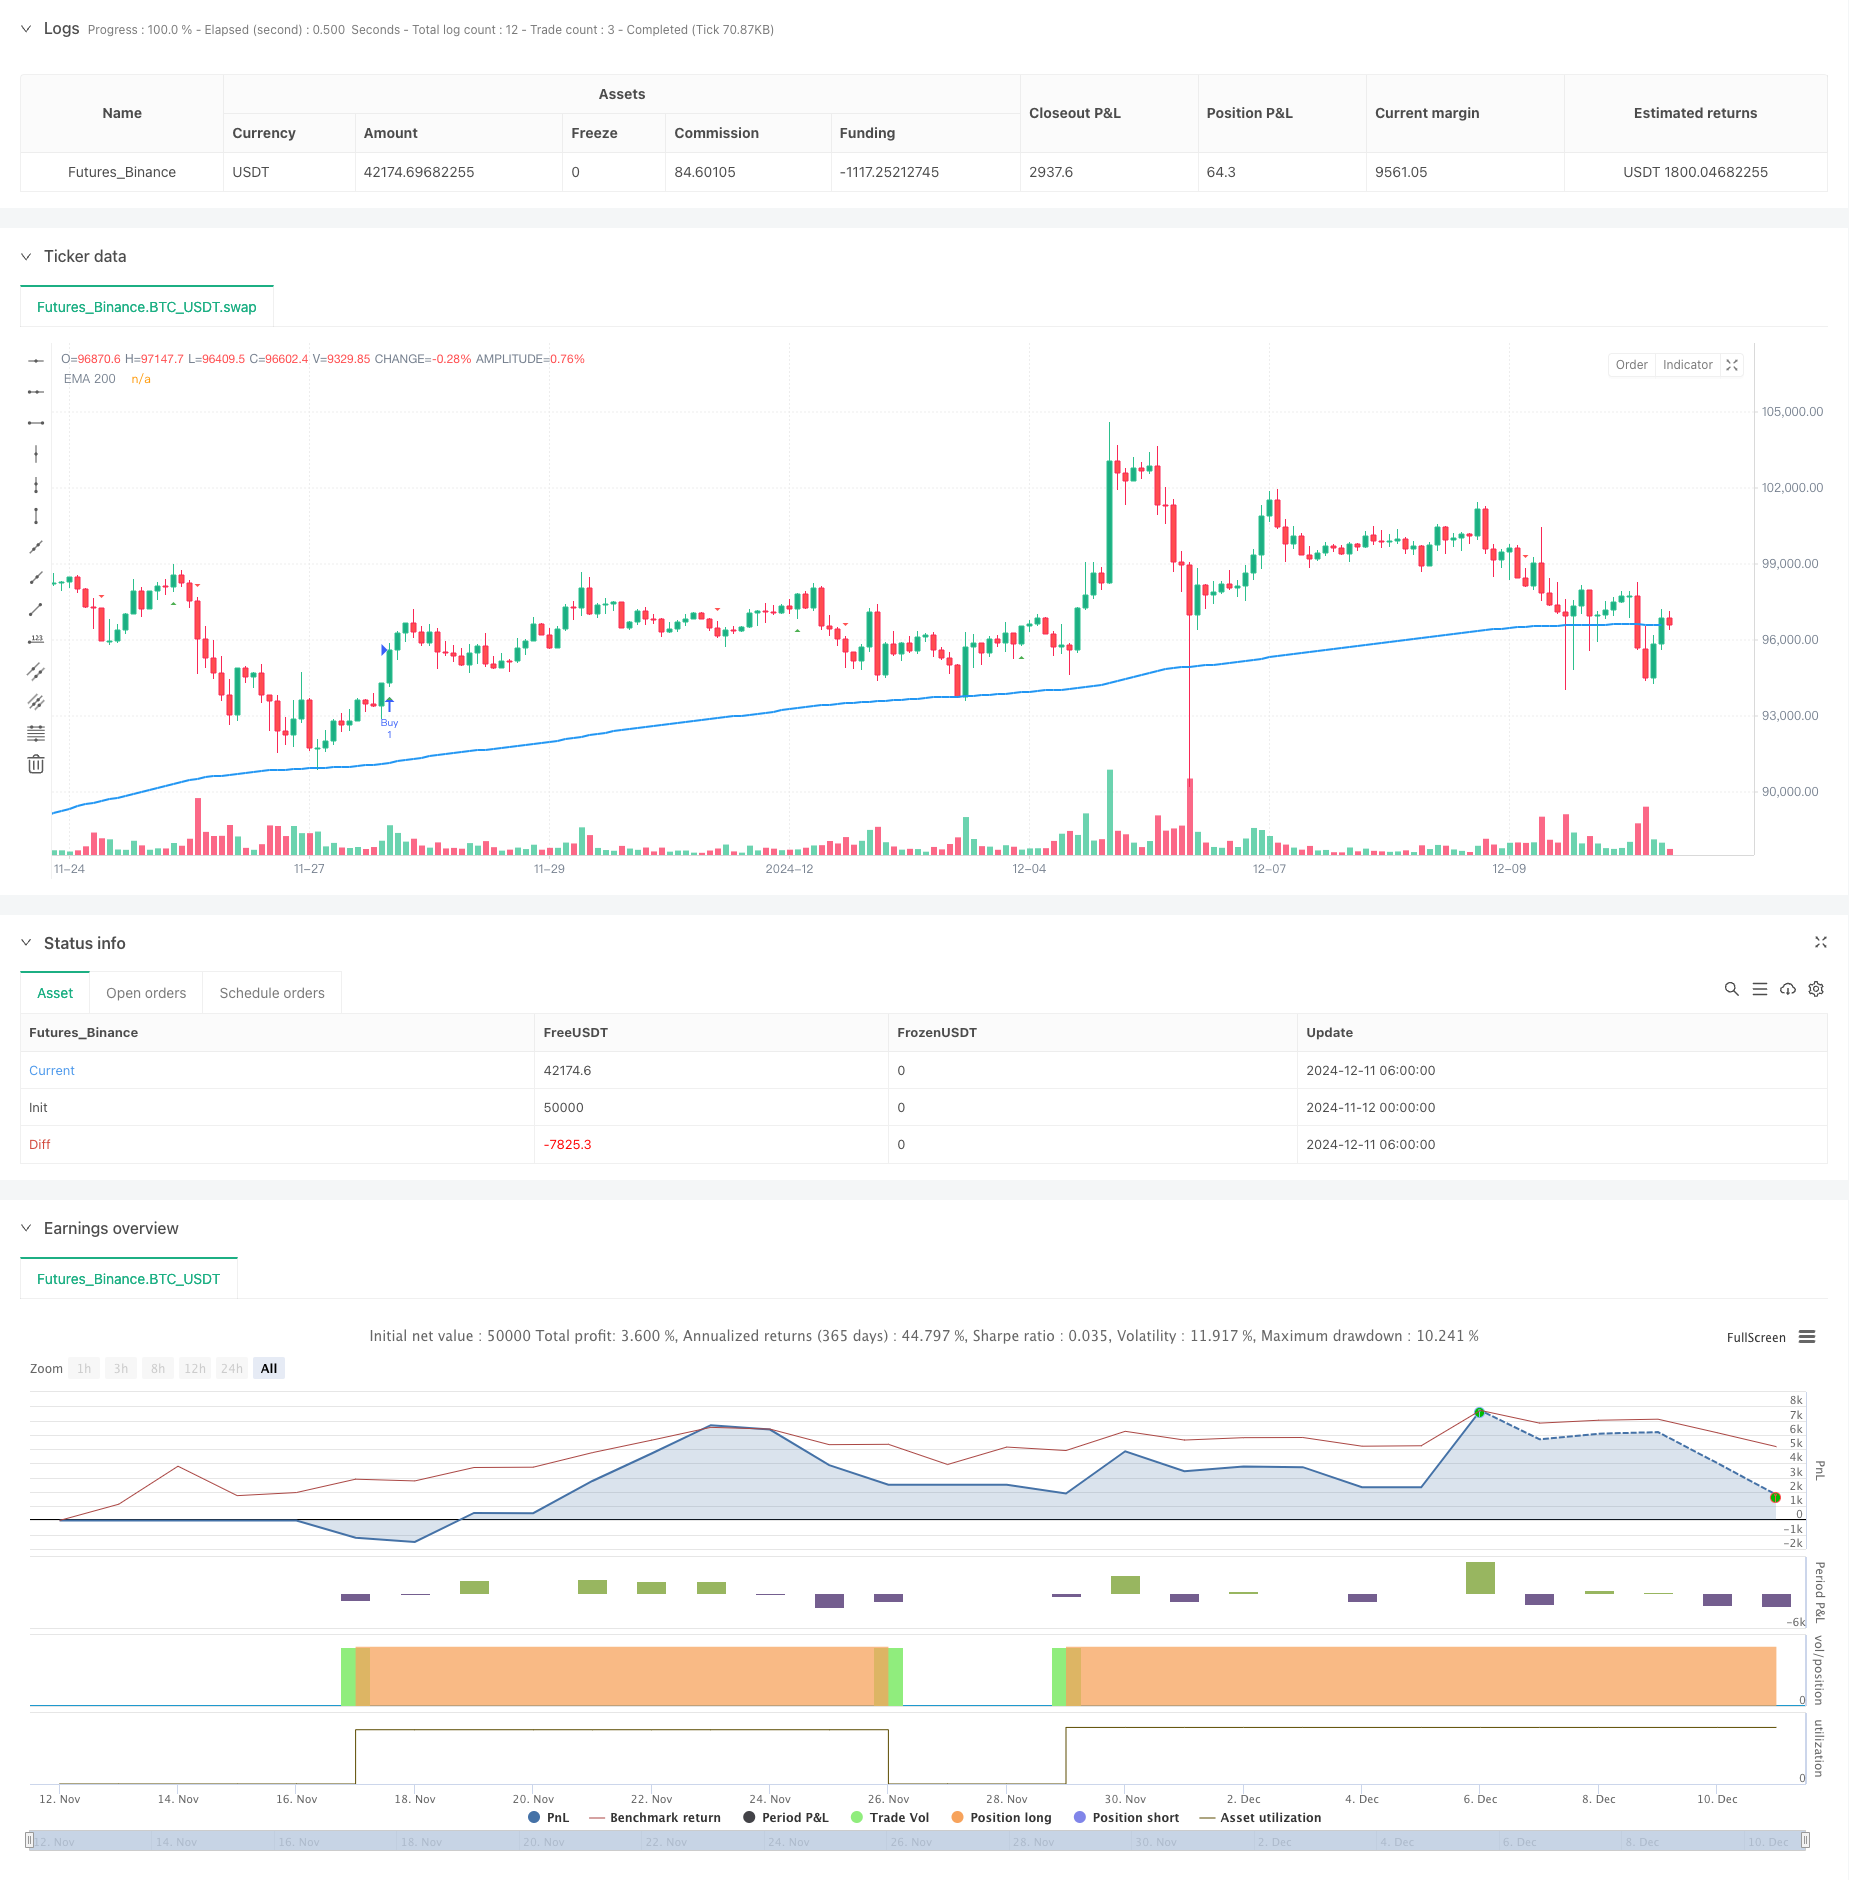
개요
이 전략은 다중 기술 지표가 결합 된 트렌드 추적 거래 시스템입니다. 그것은 이동 평균 (EMA), 변동률 추적 (ATR), 거래량 트렌드 (PVT) 및 동적 진동기 (Ninja) 과 같은 여러 차원의 시장 신호를 결합하여 신호 연동을 통해 거래의 정확성을 향상시킵니다. 전략은 동적 상쇄 메커니즘을 채택하여 트렌드를 추적하는 동시에 위험을 엄격히 통제합니다.
전략 원칙
이 전략의 핵심 논리는 다음과 같은 네 가지 주요 기둥에 기초하고 있습니다.
- 200주기 EMA를 주요 트렌드 판별기준으로 사용하여, 시장을 다머리 및 빈머리 두 가지 상태로 나눈다.
- ATR 기반의 Chandelier Exit 시스템은 최고 가격과 최저 가격을 추적하고 변동률과 결합하여 트렌드의 전환점을 결정합니다.
- PVT 지표는 가격 변화와 거래량을 결합하여 가격 추세의 유효성을 확인하는 데 사용됩니다.
- 닌자 진동기는 단기 및 중기 평균선을 비교하여 시장 동력의 변화를 포착합니다.
거래 신호의 생성에는 다음과 같은 조건이 필요합니다:
- 더 많이: 가격이 200 EMA 이상에 있고, Chandelier Exit에서 구매 신호가 나타나고, PVT 또는 Ninja 지표가 확인됩니다.
- 공백: 가격은 200EMA 아래로, 그리고 Chandelier Exit이 판매 신호를 표시하고 PVT 또는 Ninja 지표가 확인됩니다.
전략적 이점
- 여러 지표가 합동으로 확인되면서 가짜 침입의 위험이 크게 낮아졌습니다.
- 트렌드, 변동성, 거래량, 동력 등의 여러 차원의 시장 정보를 결합합니다.
- 동적 중지 메커니즘을 사용하여 시장의 변동에 따라 자동으로 중지 위치를 조정할 수 있습니다.
- 체계화된 거래 규칙, 주관적 판단의 방해를 줄여줍니다.
- 모든 거래에 대해 명확한 스톱 손실이 있는 리스크 관제 장치가 있습니다.
전략적 위험
- 변동성이 큰 시장에서는 잘못된 신호가 자주 발생할 수 있습니다.
- 복수 인증 메커니즘으로 인해 입학 시간이 다소 늦어질 수 있습니다.
- 시장의 급격한 역전시에는 상대적으로 느슨한 스톱로즈 위치가 있을 수 있습니다.
- 매개 변수 최적화에는 과도한 적합성의 위험이 있습니다.
- 더 큰 재정적 보호가 필요해
전략 최적화 방향
- 시장 환경 식별 메커니즘을 도입하여 다른 시장 상태에서 다른 파라미터 조합을 사용합니다.
- 거래량 분석 차원을 늘리고 포지션 관리 시스템을 최적화합니다.
- 동적 변수 조정 메커니즘을 포함하는 것을 고려하십시오.
- 여러 지표들 사이의 무게 분배를 최적화
- 시간 필터를 도입하여 시장의 큰 변동성을 피할 수 있습니다.
요약하다
이 전략은 다중 지표 협동 및 동적 스톱 메커니즘을 통해 비교적 완전한 거래 시스템을 구축한다. 전략의 핵심 장점은 다차원적인 신호 확인 메커니즘과 엄격한 위험 제어에 있다. 약간의 지연 및 가짜 신호 위험이 있지만, 지속적인 최적화 및 개선으로 이 전략은 다양한 시장 환경에서 안정적인 성능을 유지할 것으로 예상된다.
전략 소스 코드
/*backtest
start: 2024-11-12 00:00:00
end: 2024-12-11 08:00:00
period: 2h
basePeriod: 2h
exchanges: [{"eid":"Futures_Binance","currency":"BTC_USDT"}]
*/

//@version=5
strategy("Triple Indicator Strategy", shorttitle="TIS", overlay=true)

// --- Inputs ---
var string calcGroup = "Calculation Parameters"
atrLength = input.int(22, title="ATR Period", group=calcGroup)
atrMult = input.float(3.0, title="ATR Multiplier", step=0.1, group=calcGroup)
emaLength = input.int(200, title="EMA Length", group=calcGroup)

// --- ATR and EMA Calculations ---
atr = atrMult * ta.atr(atrLength)
ema200 = ta.ema(close, emaLength)

// --- Chandelier Exit Logic ---
longStop = ta.highest(high, atrLength) - atr
shortStop = ta.lowest(low, atrLength) + atr

var int dir = 1
dir := close > shortStop ? 1 : close < longStop ? -1 : dir

buySignal = dir == 1 and dir[1] == -1
sellSignal = dir == -1 and dir[1] == 1

// --- Price Volume Trend (PVT) ---
pvt = ta.cum((close - close[1]) / close[1] * volume)
pvtSignal = ta.ema(pvt, 21)
pvtBuy = ta.crossover(pvt, pvtSignal)
pvtSell = ta.crossunder(pvt, pvtSignal)

// --- Ninja Indicator ---
ninjaOsc = (ta.ema(close, 3) - ta.ema(close, 13)) / ta.ema(close, 13) * 100
ninjaSignal = ta.ema(ninjaOsc, 24)
ninjaBuy = ta.crossover(ninjaOsc, ninjaSignal)
ninjaSell = ta.crossunder(ninjaOsc, ninjaSignal)

// --- Strategy Conditions ---
longCondition = buySignal and close > ema200 and (pvtBuy or ninjaBuy)
shortCondition = sellSignal and close < ema200 and (pvtSell or ninjaSell)

if longCondition
    strategy.entry("Buy", strategy.long)
    strategy.exit("Exit Long", "Buy", stop=low - atr)

if shortCondition
    strategy.entry("Sell", strategy.short)
    strategy.exit("Exit Short", "Sell", stop=high + atr)

// --- Plotting ---
plot(ema200, title="EMA 200", color=color.blue, linewidth=2)
plotshape(buySignal, title="Chandelier Buy", location=location.belowbar, color=color.green, style=shape.triangleup, size=size.small)
plotshape(sellSignal, title="Chandelier Sell", location=location.abovebar, color=color.red, style=shape.triangledown, size=size.small)

// --- Labels for Buy/Sell with price ---
if buySignal
    label.new(bar_index, low, "Buy: " + str.tostring(close), color=color.green, style=label.style_label_up, yloc=yloc.belowbar, size=size.small)

if sellSignal
    label.new(bar_index, high, "Sell: " + str.tostring(close), color=color.red, style=label.style_label_down, yloc=yloc.abovebar, size=size.small)

// --- Alerts ---
alertcondition(longCondition, title="Buy Alert", message="Buy Signal Triggered!")
alertcondition(shortCondition, title="Sell Alert", message="Sell Signal Triggered!")