横线突破捕捉趋势策略
Author: ChaoZhang, Date: 2024-04-26 15:22:06Tags:
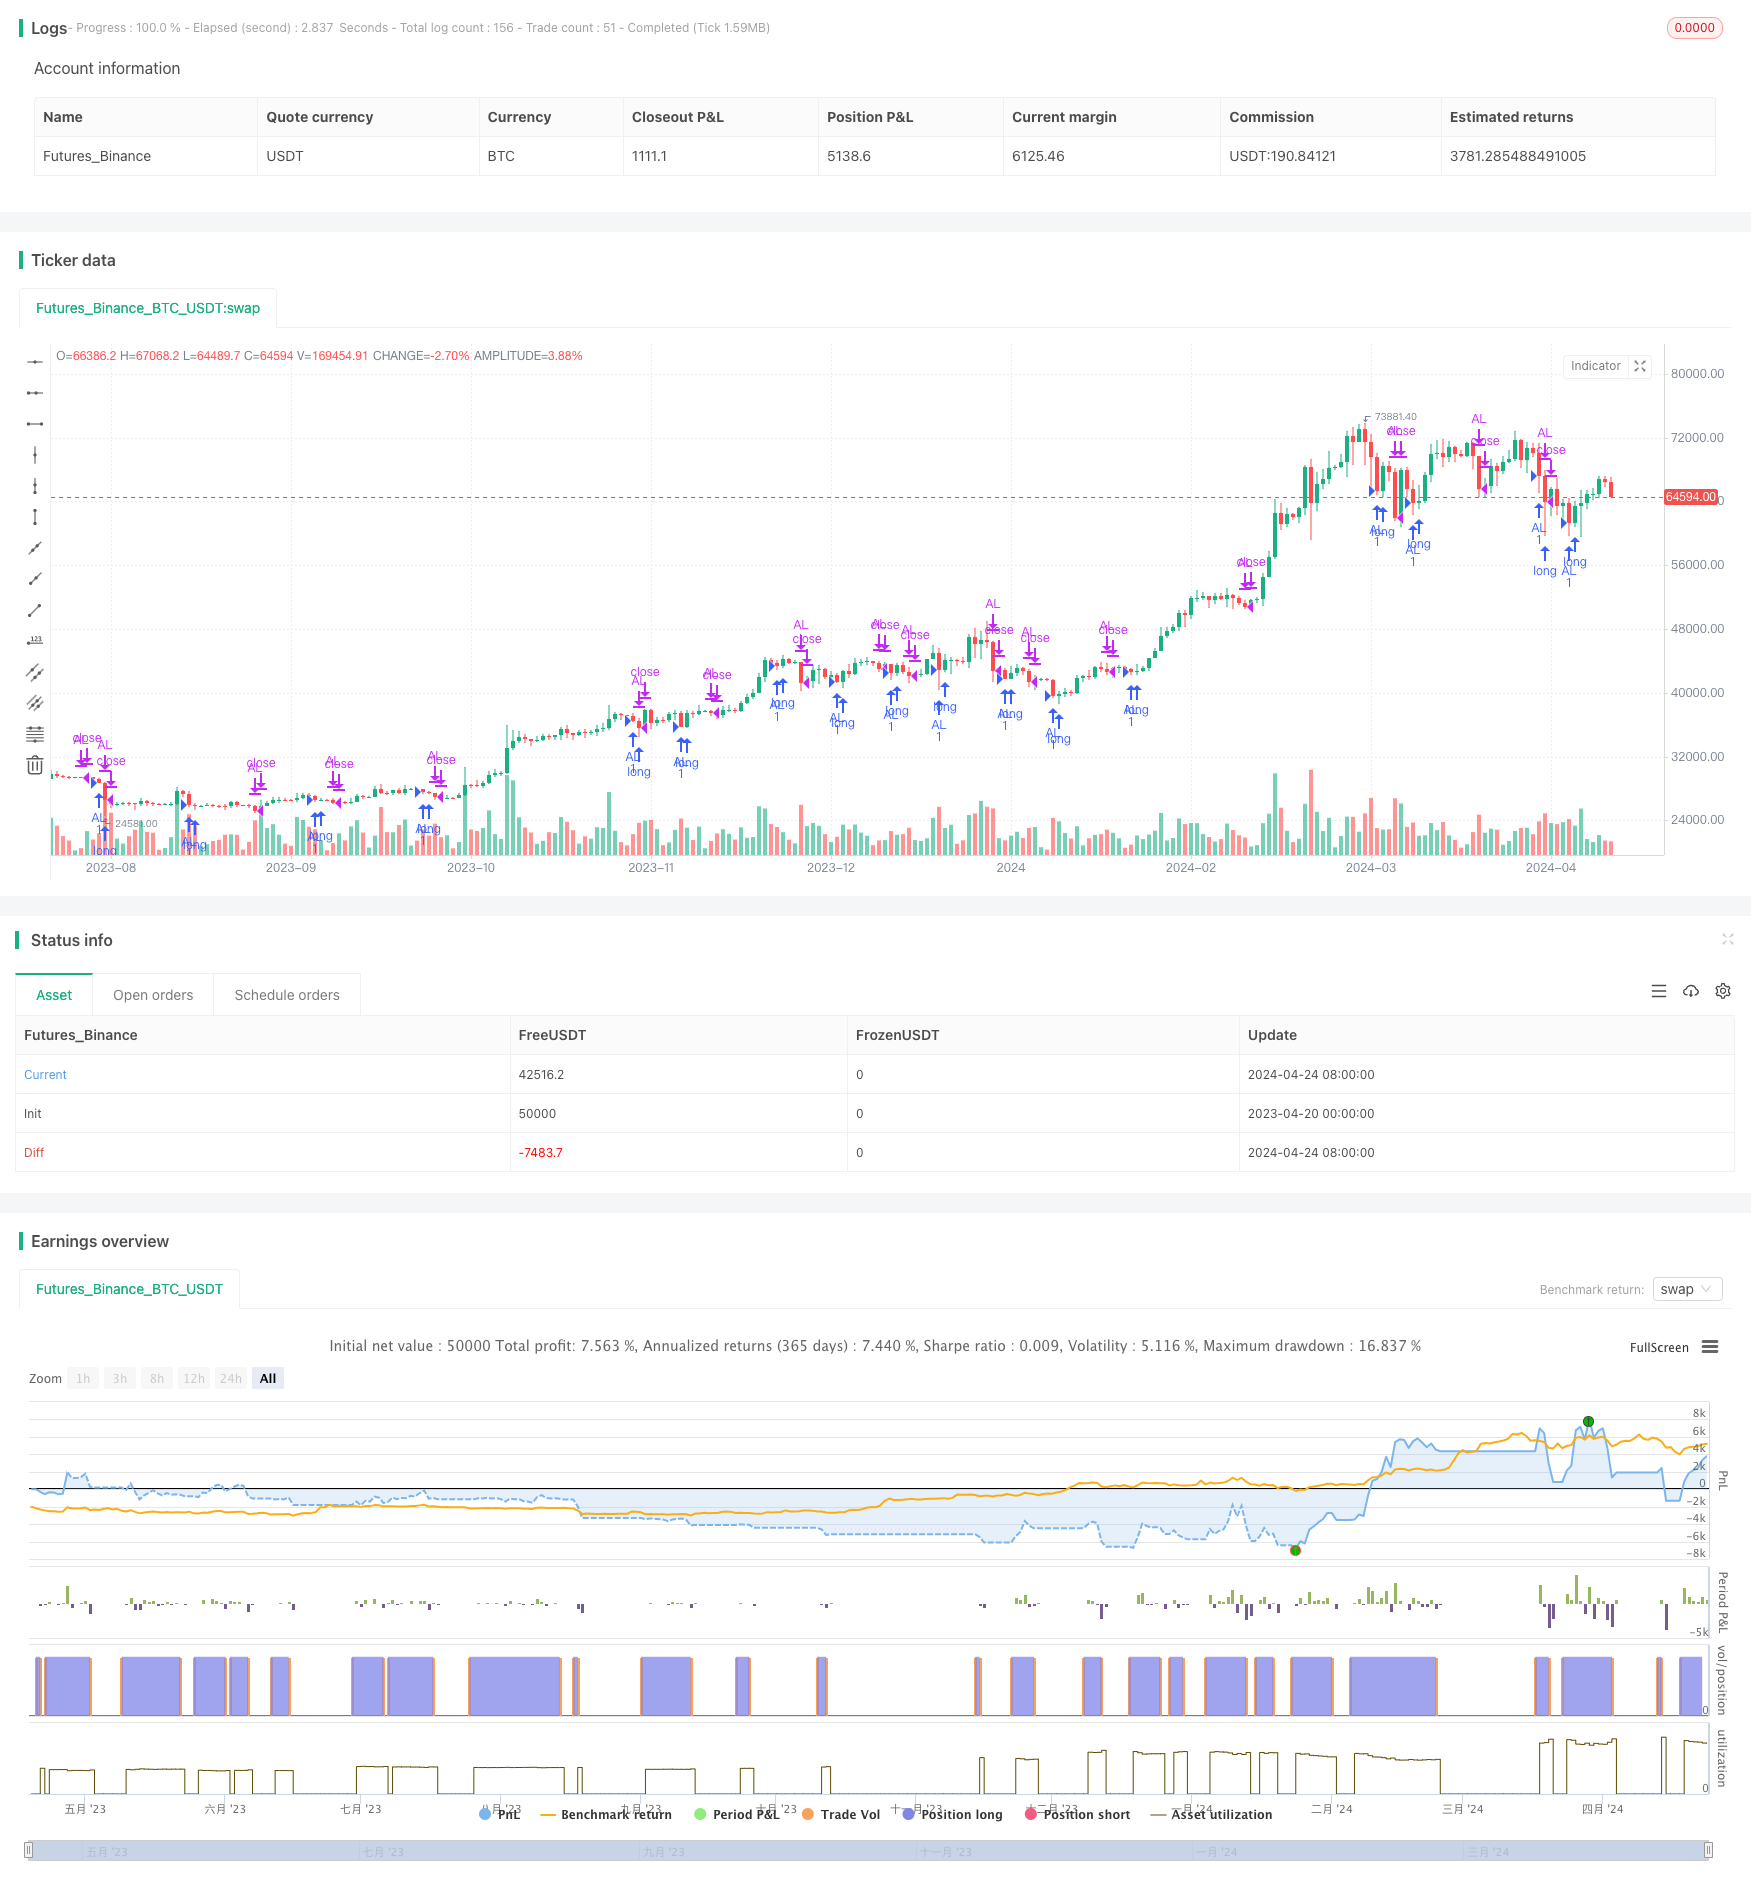
概述
该策略使用水平线作为支撑位和阻力位,当价格突破水平线时会产生交易信号。主要思路是:首先根据某些条件画出水平线,当价格向上突破水平线时做多,当价格向下突破水平线时平仓。同时水平线的产生也有相应的条件,如前一根K线的最低价大于当前收盘价。
策略原理
- 根据前一根K线的最低价大于当前收盘价的条件,在前一根K线的最低价位置画一条长度为20的水平线,并且始终只保留最新的10条线。
- 如果当前价格向上突破了最新的一条水平线,则平掉之前所有的多单,重新做多。
- 在画新的水平线时,如果此时有持仓,则先平仓,再做多。
策略优势
- 策略逻辑简单清晰,容易理解和实现。
- 通过水平线支撑阻力位的突破来产生信号,能较好地捕捉趋势。
- 新的水平线产生时会先平掉之前的仓位,然后再开新仓,这样可以降低之前开仓可能带来的风险。
- 可以通过调整水平线的长度和数量来优化策略。
策略风险
- 对于震荡行情,频繁的水平线突破可能会导致过度交易,从而产生较大的滑点和手续费。
- 策略对于水平线的定义比较简单,缺乏其他指标的验证,可能会产生一些错误信号。
- 只做多不做空,无法充分利用下跌行情。
策略优化方向
- 可以结合其他指标来确认水平线的有效性,比如成交量的变化等,以减少错误信号。
- 对于震荡行情,可以通过增加水平线突破的幅度来减少交易频率。
- 加入做空机制,在下跌趋势中也能获利。
- 可以考虑动态调整水平线的长度和数量,以适应不同的行情。
总结
该策略以水平线作为重要的支撑阻力位,通过突破水平线产生交易信号。优点是逻辑简单,容易实现,能较好地捕捉趋势。但是缺点是可能会过度交易,产生错误信号,并且只能做多不能做空。后续可以从结合其他指标、减少交易频率、加入做空机制和动态调整参数等方面进行优化和改进。
/*backtest
start: 2023-04-20 00:00:00
end: 2024-04-25 00:00:00
period: 1d
basePeriod: 1h
exchanges: [{"eid":"Futures_Binance","currency":"BTC_USDT"}]
*/

// This Pine Script™ code is subject to the terms of the Mozilla Public License 2.0 at https://mozilla.org/MPL/2.0/
// © Traderxprox

//@version=5
strategy("Alarm Trader_ALL", overlay=true)

// Yatay çizgi oluşum
yatayc = low[1] > close[0]

if yatayc
    if strategy.opentrades > 0
        strategy.close("AL", comment = "Fiyat:" + str.tostring(low[1], "#.##") + "\n" + timeframe.period +"\n Yatay Direnç Oluştu")
    else
        strategy.entry("AL", strategy.long, comment = "Fiyat:" + str.tostring(low[1], "#.##") + "\n" + timeframe.period +"\n Yatay Direnç Oluştu")


//YATAY ÇİZGİ
int cizgilen = input.int(20, "Çizgi uzunluğu?", group = "Yatay Çizgi Ayarları")
var array<line> lines = array.new<line>()
int numberOfLines = input.int(10, "Son Kaç Çizgi?", 0, group = "Yatay Çizgi Ayarları")
kural22 = low[1] > close[0]
// if kural22
//     newLine = line.new(bar_index-2, low[1], bar_index+cizgilen, low[1] ,color=color.red, width=1, style=line.style_solid)
//     // Push the `newLine` into the `lines` array.
//     lines.push(newLine)
//     // Delete the oldest line when the size of the array exceeds the specified `numberOfLines`.
//     if array.size(lines) > numberOfLines
//         line.delete(lines.shift())

// Alarm kırılım için koşul

var float lastLinePrice = na
if not na(close) and array.size(lines) > 0
    lastLinePrice := line.get_price(array.get(lines, array.size(lines) - 1), bar_index)
if open < lastLinePrice and close > lastLinePrice
    if strategy.opentrades > 0
        strategy.close("AL", comment = "Fiyat:" + str.tostring(lastLinePrice, "#.##") + "\n" + timeframe.period +" \n Yatay çizgi yukarı kırılımı")
    else
        strategy.entry("AL", strategy.long, comment = "Fiyat:" + str.tostring(lastLinePrice, "#.##") + "\n" + timeframe.period +" \n Yatay çizgi yukarı kırılımı")
更多内容
- 基于修正Hull移动平均与一目均衡的量化交易策略
- RSI趋势反转策略
- 随机交叉指标动量交易策略
- RSI与双EMA交叉信号量化策略
- 艾略特波浪理论4-9脉冲波自动检测交易策略
- 随机震荡指标与均线交叉策略结合止损与随机震荡过滤器
- 日内可扩展波动率交易策略
- KRK aDa 随机慢速均值回归策略与人工智能增强
- 基于支点和斜率的实时趋势线交易
- EMA23/EMA50双均线交叉量化交易策略
- 移动平均线交叉多层获利策略
- MACD金叉死叉策略
- MACD-V和斐波那契多时间框架动态止盈策略
- 趋势捕捉策略
- 滑动平均线和布林带量化交易策略
- 布林带突破策略
- 双时间尺度动量策略
- MACD BB 波段突破策略
- Wavetrend 大幅指标超跌反弹网格交易策略
- MACD 交叉策略