概述
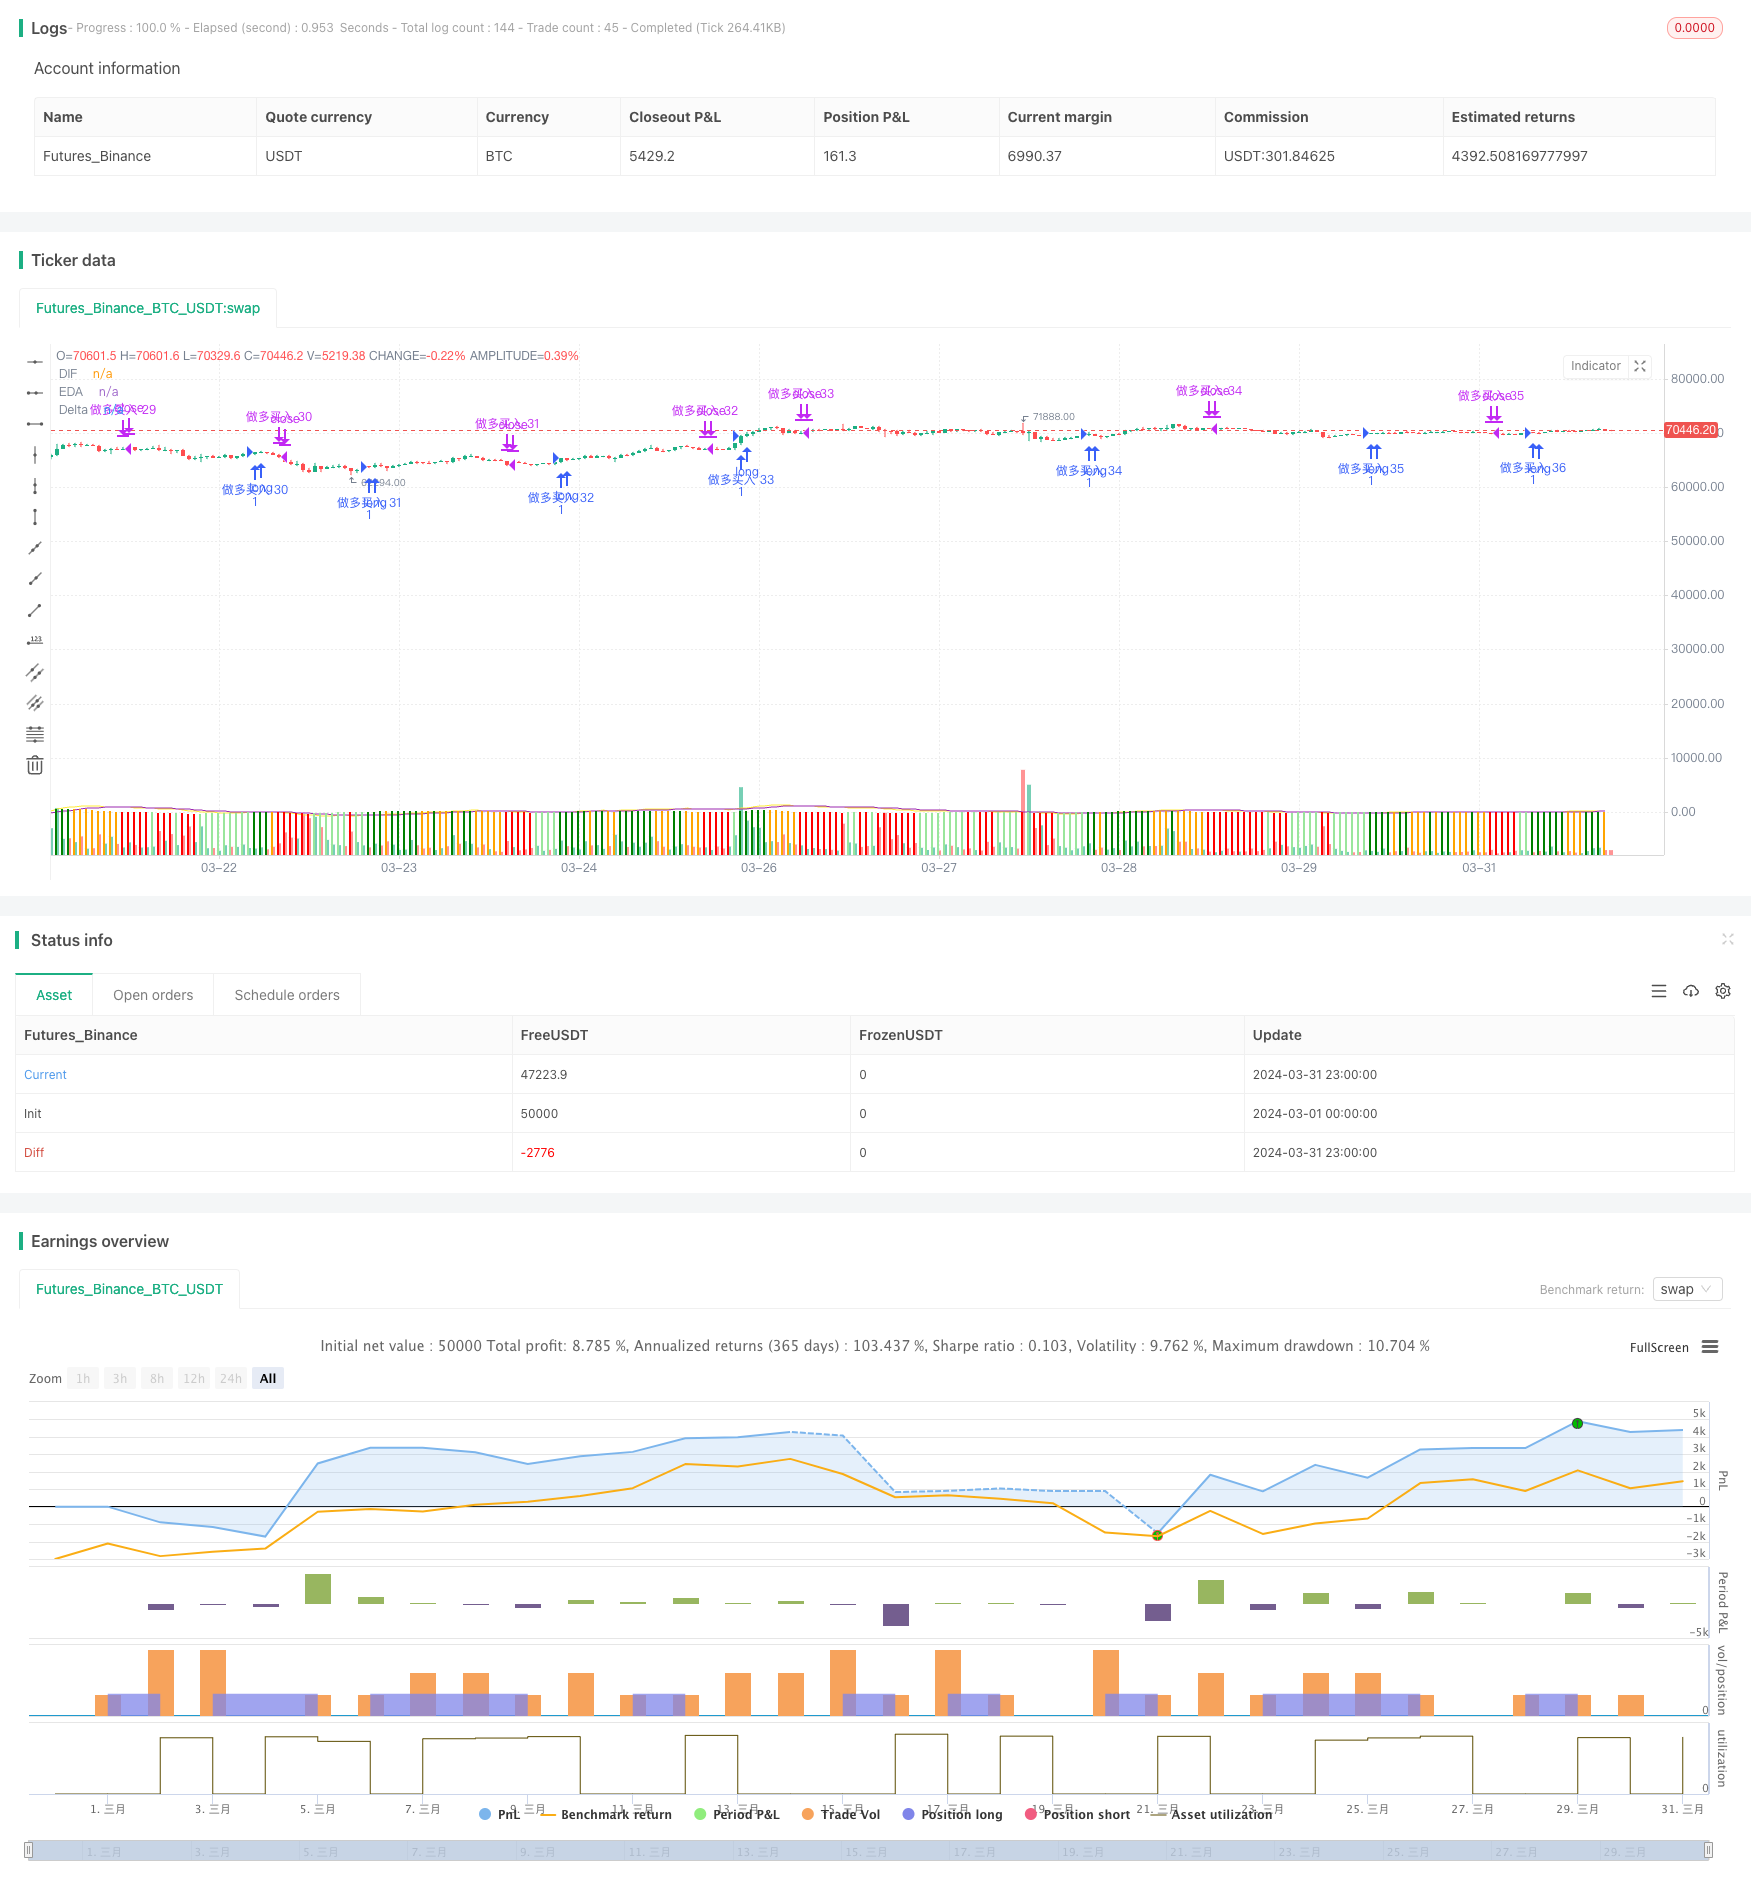
该策略使用MACD指标中的DIF线和DEA线的交叉来产生交易信号。当DIF线从下向上穿过DEA线时,产生做多信号;当DIF线从上向下穿过DEA线时,产生做空信号。该策略的回测结果显示,在BTCUSDT交易对上,胜率约为40%,年化收益率为1.05,但会导致持有的资产数量不断增加,因此无法作为一个独立的套利策略使用。
策略原理
- 计算快速移动平均线(EMA)和慢速移动平均线(EMA)。
- 计算DIF线,即快速EMA和慢速EMA的差值。
- 计算DEA线,即DIF线的EMA。
- 计算MACD柱状图,即DIF线和DEA线的差值。
- 当DIF线从下向上穿过DEA线时,产生做多信号,开仓做多。
- 当DIF线从上向下穿过DEA线时,产生做空信号,平仓做多,开仓做空。
- 当再次出现相反的交叉信号时,平仓当前仓位,开仓相反方向的仓位。
策略优势
- 该策略使用了广泛使用的MACD指标,易于理解和实现。
- 策略逻辑清晰,交易信号明确。
- 适用于趋势性市场,可以跟踪市场的主要趋势。
策略风险
- 该策略的胜率较低,仅为40%,这意味着有60%的交易可能是亏损的。
- 该策略会导致持有的资产数量不断增加,这可能会带来额外的风险敞口。
- 在震荡市场中,该策略可能会产生频繁的交易信号,导致高昂的交易成本。
- 该策略没有考虑风险管理,如止损和仓位管理,这可能会导致大幅亏损。
策略优化方向
- 引入趋势过滤器,如长期移动平均线,以避免在震荡市场中交易。
- 优化MACD指标的参数,如快速EMA、慢速EMA和信号线的周期,以适应不同的市场状况。
- 加入风险管理措施,如止损和仓位管理,以控制潜在的亏损。
- 结合其他技术指标或基本面分析,以提高交易信号的可靠性。
总结
MACD金叉死叉策略是一个简单易懂的交易策略,适用于趋势性市场。然而,该策略的胜率较低,且缺乏风险管理措施,因此需要进一步优化和完善。通过引入趋势过滤器、优化参数、加入风险管理以及结合其他分析方法,可以提高该策略的性能和可靠性。尽管如此,该策略仍然无法作为一个独立的套利策略使用,需要与其他策略相结合,以获得更好的交易结果。
策略源码
/*backtest
start: 2024-03-01 00:00:00
end: 2024-03-31 23:59:59
period: 1h
basePeriod: 15m
exchanges: [{"eid":"Futures_Binance","currency":"BTC_USDT"}]
*/

// @version=5
// @description 该策略使用 MACD DIF 线与 EDA 线产生金叉与死叉时进行入场与出场操作, 回测后发现胜率约 40%, BTCUSDT 年化利率 1.05, 同时会导致持有的资产数量不断上升, 无法作为一个独立的套利策略进行使用.

strategy("MACD 金叉策略", overlay=true)

fastLength = input(12, "快线长度")
slowLength = input(26, "慢线长度")
MACDLength = input(9, "MACD 均线长度")

deltaIncreaseOver0 = input(color.green,'MACD 柱在 0 线以上增长')
deltaIncreaseUnder0 = input(color.rgb(153, 230, 156),'MACD 柱在 0 线以下增长')

deltaDecreaseOver0 = input(color.orange,'MACD 柱在 0 线以上下跌')
deltaDecreaseUnder0 = input(color.red,'MACD 柱在 0 线以下下跌')

buySellEnabled = input(true, '是否显示入场与出场信号')

// @variable 做多轮数
var longRound = 0
// @variable 做空轮数
var shortRound = 0

DIF = ta.ema(close, fastLength) - ta.ema(close, slowLength) // 快慢均线差值
EDA = ta.ema(DIF, MACDLength) // DIF 线的 EMA 均线
delta = DIF - EDA // MACD 柱高度

// plot(0, 'Zero', color.black)
plot(DIF,'DIF', color.yellow)
plot(EDA, "EDA", color.purple)

isDeltaIncreasing = delta[1] < delta
isDeltaOver0 = delta > 0
deltaColor = isDeltaIncreasing ? (isDeltaOver0? deltaIncreaseOver0: deltaIncreaseUnder0) :( isDeltaOver0? deltaDecreaseOver0: deltaDecreaseUnder0)
plot(delta, "Delta", deltaColor, style = plot.style_columns)

isDeltaV = delta > delta[1] and delta[2] > delta[1]
isDeltaA = delta < delta[1] and delta[2] < delta[1]

longBuy(round) =>
	entry = str.format("做多买入 {0}",round)
	// log.info(str.format("{0} {1}",entry,close))
	strategy.entry(entry, strategy.long, comment=entry)

longSell(round) =>
	entry = str.format("做多买入 {0}",round)
	exit = str.format("做多卖出 {0}",round)
	// log.info(str.format("{0} {1}",exit,close))
	strategy.close(entry, comment=exit)

shortSell(round) =>
	entry = str.format("做空卖出 {0}",round)
	// log.info(str.format("{0} {1}",entry,close))
	strategy.entry(entry, strategy.short, comment= entry)

shortBuy(round) =>
	entry = str.format("做空卖出 {0}",round)
	exit = str.format("做空买入 {0}",round)
	// log.info(str.format("{0} {1}",exit,close))
	strategy.close(entry, comment=exit)

if (buySellEnabled)
	if (ta.crossunder(DIF, EDA))
		longSell(longRound)
	if (ta.crossover(DIF, EDA))
		longRound := longRound + 1
		longBuy(longRound)
相关推荐