概述
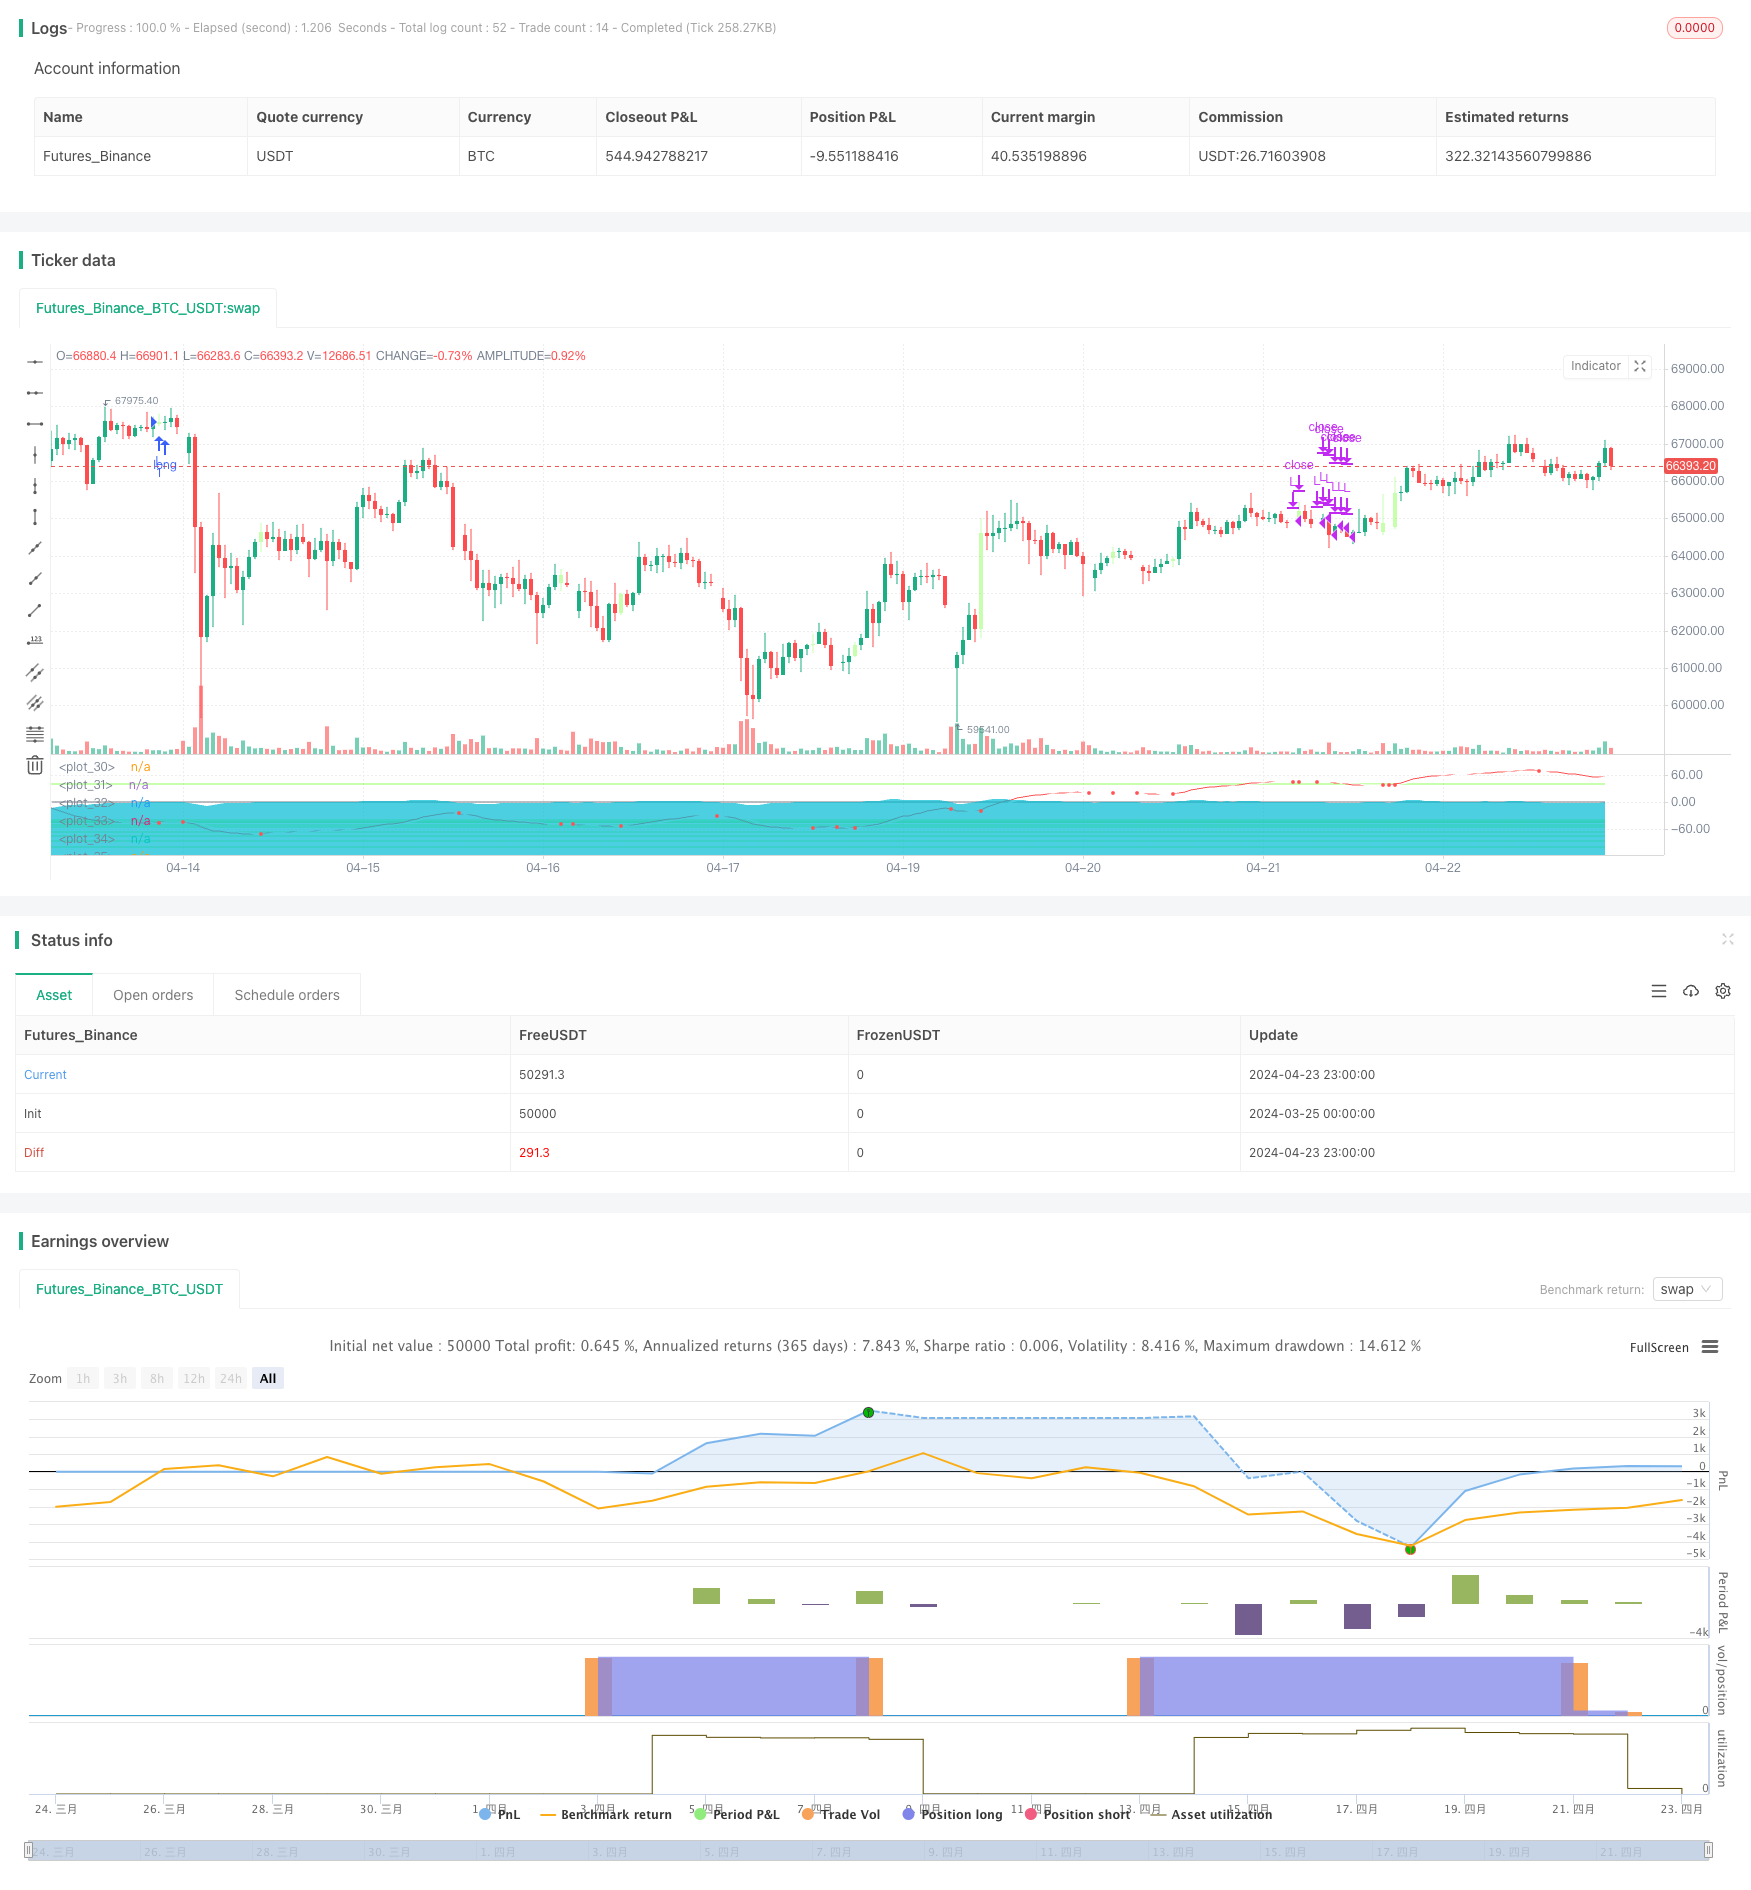
该策略基于Wavetrend指标,通过设置多个超卖和超买水平,在价格触及这些水平时建立多头仓位,并在价格反弹至超买水平时平仓获利。这是一种网格交易策略,旨在捕捉市场的超跌反弹行情,适用于比特币和索拉纳等数字货币的15分钟周期。
策略原理
- 计算Wavetrend指标的两条线,一条为原始值(wt1),一条为平滑值(wt2)。
- 设置多个超卖水平(oslevel1~8)和超买水平(Oblevel1~5)。
- 当wt1和wt2同时低于某个超卖水平,且wt1在wt2上方时,开多头仓位。级别越低,开仓越激进。
- 当wt1和wt2同时高于超买水平1,且wt1在wt2下方时,平掉70%的多头仓位。
- 重复步骤3和4,构建一个网格交易系统。
策略优势
- 捕捉超跌反弹行情:通过设置多个超卖水平,在价格大幅下跌后开仓,博取反弹利润。
- 分批建仓,控制风险:根据超卖级别分批建仓,级别越低仓位越重,可以更好地控制风险。
- 自动止盈:在价格反弹至超买区域时自动平掉大部分仓位,锁定利润。
- 参数灵活:超卖和超买水平可以根据市场特点和个人偏好进行调整,适应不同的交易品种和周期。
策略风险
- 暴跌风险:如果价格持续下跌,触发越来越多的超卖开仓信号,可能导致重仓被套。
- 震荡市风险:如果价格在超卖区域反复震荡,可能导致多次开仓而无法止盈,从而削弱策略效果。
- 参数风险:不同参数设置对策略表现影响很大,需要根据回测和经验进行优化,否则可能带来损失。
策略优化方向
- 加入趋势过滤:在开仓前判断大级别趋势是否向上,避免在下跌趋势中开仓。
- 优化仓位管理:根据价格距离超卖水平的距离,调整开仓仓位大小,距离越远仓位越大。
- 动态止盈:根据持仓盈亏比例,动态调整止盈水平,而不是固定比例平仓。
- 加入止损:设置固定或追踪止损,控制单笔交易的最大损失。
总结
Wavetrend大幅指标超跌反弹网格交易策略是一个基于超卖超买信号的量化策略,通过分批建仓和自动止盈的方式,试图捕捉超跌后的反弹行情,博取差价利润。该策略的优势在于适应性强,可以灵活调整参数,但也存在市场持续下跌、参数设置不当等风险。在实际应用中,可以考虑加入趋势过滤、动态仓位和止盈止损等优化手段,提高策略的稳健性和盈利能力。但仍然需要注意,该策略属于高风险策略,需要严格控制仓位,谨慎使用。
策略源码
/*backtest
start: 2024-03-25 00:00:00
end: 2024-04-24 00:00:00
period: 1h
basePeriod: 15m
exchanges: [{"eid":"Futures_Binance","currency":"BTC_USDT"}]
*/

//@version=5
// © And Isaac, all rights reserved. If there is any piracy, please call the police immediately.

strategy(title='wavetrend',shorttitle='DCA-High win rate quantitative trading')
n1 = input(40,'channel length')
n2 = input(60,'average length')
Oblevel1 = input(40,'over bought level 1')
Oblevel2 = input(50,'over bought level 1')
Oblevel3 = input(70,'over bought level 1')
Oblevel4 = input(80,'over bought level 1')
Oblevel5 = input(100,'over bought level 2')
oslevel1 = input(-40,'over sold level 1')
oslevel2 = input(-45,'over sold level 1')
oslevel3 = input(-50,'over sold level 1')
oslevel4 = input(-55,'over sold level 1')
oslevel5 = input(-65,'over sold level 1')
oslevel6 = input(-75,'over sold level 1')
oslevel7 = input(-85,'over sold level 1')
oslevel8 = input(-100,'over sold level 2')

ap = input(title="source",defval=hlc3)
esa =ta.ema(ap, n1)
d =ta.ema(math.abs(ap - esa),n1)
ci = (ap - esa)/ (0.015 * d)
tci = ta.ema(ci,n2)

wt1 = tci
wt2 = ta.sma(wt1, 4)

plot(0,color=color.new(#787b86, 0 ))
plot(Oblevel1, color=color.new(#89ff52, 53), linewidth = 2)
plot(oslevel1, color=color.new(#89ff52, 53), linewidth = 2)
plot(oslevel2, color=color.new(#89ff52, 53), linewidth = 2)
plot(oslevel3, color=color.new(#89ff52, 53), linewidth = 2)
plot(oslevel4, color=color.new(#89ff52, 53), linewidth = 2)
plot(oslevel5, color=color.new(#89ff52, 53), linewidth = 2)
plot(oslevel6, color=color.new(#89ff52, 53), linewidth = 2)
plot(oslevel7, color=color.new(#89ff52, 53), linewidth = 2)
plot(oslevel8, color=color.new(#89ff52, 53), linewidth = 2)
plot(oslevel2, color=color.new(#89ff52, 53), linewidth = 2)
plot(wt1, color=color.new(#ff5252,0))
plot(wt2, color=color.new(#ffffff,0))
plot(wt1 - wt2, color=color.new(#00bcd4, 30),style=plot.style_area)

plot(ta.cross(wt1, wt2) ? wt2 : na, color=color.new(#ff5252,0) , style=plot.style_circles, linewidth=4 )

// barcolor(cross(wt1, wt2) ? (wt2 - wt1 > 0 ? aqua : yellow) : na)
barcolor(ta.cross(wt1, wt2) ? (wt2 - wt1 > 0 ? color.new(#ffffff,0) : color.new(#89ff52, 53)) : na)

/////////////
Long1 = wt2 < oslevel1 and wt1 < oslevel1 and wt1>wt2 and wt2 > oslevel3 and wt1>oslevel3
Long5 = wt2 < oslevel5 and wt1 < oslevel5 and wt1>wt2 and wt2 > oslevel6 and wt1>oslevel6

Long7 = wt2 < oslevel7 and wt1 < oslevel7 and wt1>wt2 and wt2 > oslevel8 and wt1>oslevel8
Long8 = wt2 < oslevel8 and wt1 < oslevel8 and wt1>wt2
LS1 = wt2 > Oblevel1 and wt1 > Oblevel1 and wt1<wt2


if Long1
    strategy.entry("L",strategy.long,comment = "做多1")


if Long5
    strategy.entry("L",strategy.long,comment = "做5")

if Long7
    strategy.entry("L",strategy.long,comment = "做多7")
if Long8
    strategy.entry("L",strategy.long,comment = "做多8")
if LS1
    strategy.close("L", qty_percent = 70,comment = "平多")
相关推荐