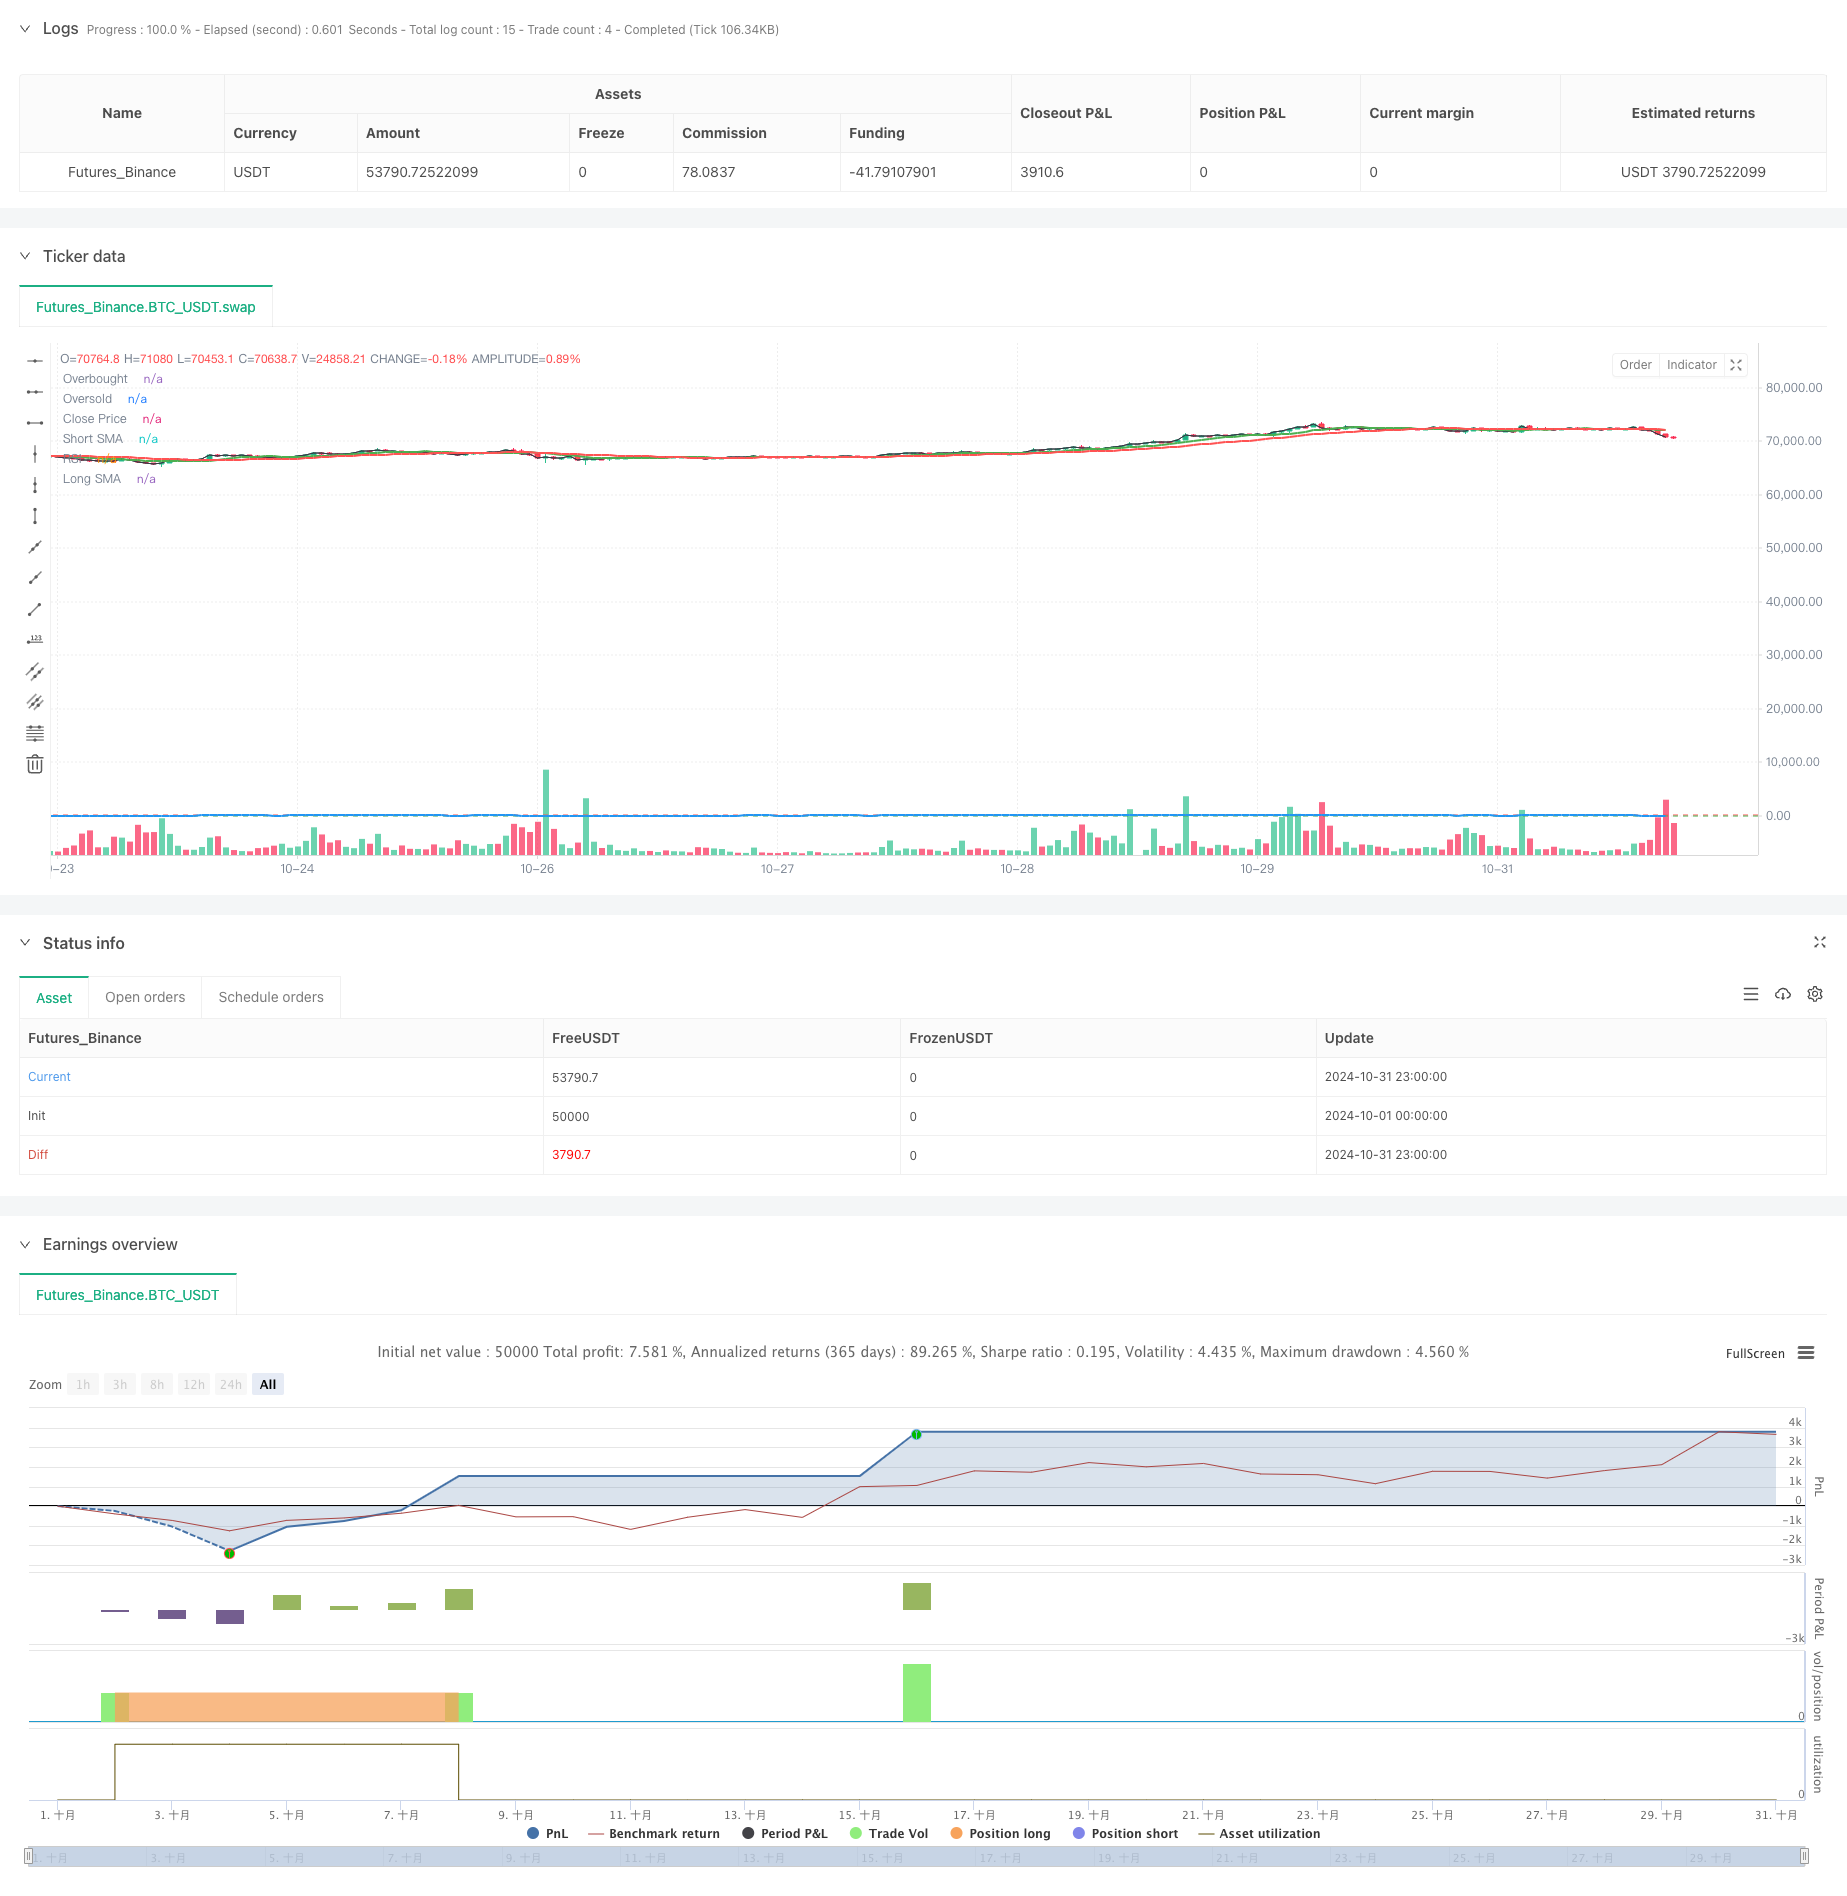
ওভারভিউ
এটি একটি পরিমাণগত ট্রেডিং কৌশল যা দ্বি-সমান্তরাল ক্রস, আরএসআই ওভারব্লড ওভারসোল্ড এবং রিস্ক-রিটার্নের সমন্বয় করে। এই কৌশলটি সংক্ষিপ্ত এবং দীর্ঘমেয়াদী চলমান গড়ের ক্রস দ্বারা বাজার প্রবণতার দিক নির্ধারণ করে এবং আরও সুনির্দিষ্ট ট্রেডিং সিগন্যাল ফিল্টারিংয়ের জন্য ওভারব্লড ওভারসোল্ড অঞ্চলগুলি সনাক্ত করার জন্য আরএসআই সূচক ব্যবহার করে। কৌশলটি এটিআর-ভিত্তিক গতিশীল স্টপ লস সেটিং এবং ফিক্সড-রিস্ক-রিটার্ন-রিটার্ন-এর লাভের লক্ষ্য পরিচালনার সিস্টেমও সংহত করে।
কৌশল নীতি
কৌশলটি 9 এবং 21 তারিখের দুটি মুভিং এভারেজকে প্রবণতার ভিত্তি হিসাবে গ্রহণ করে এবং আরএসআই সূচকের ওভারবয় ওভারসোল অঞ্চল (৩৫/৬৫) এর মাধ্যমে সংকেত নিশ্চিত করে। মাল্টি হেড এন্ট্রি শর্তে, স্বল্পমেয়াদী গড় লাইনটি দীর্ঘমেয়াদী গড় লাইনের উপরে এবং আরএসআই ওভারবয় অঞ্চলে (৩৫ এর নীচে) থাকতে হবে; খালি হেড এন্ট্রিগুলির জন্য স্বল্পমেয়াদী গড় লাইনটি দীর্ঘমেয়াদী গড় লাইনের নীচে এবং আরএসআই ওভারবয় অঞ্চলে (৬৫ এর উপরে) থাকতে হবে। কৌশলটি স্টপ লসকে ১.৫ গুণ এটিআর মান সেট করে এবং স্বয়ংক্রিয়ভাবে গণনা করা লাভের তুলনায় ২ঃ১ ঝুঁকি-লাভের লক্ষ্যমাত্রা ব্যবহার করে। অতিরিক্ত অবস্থান রোধ করতে, কৌশলটি সর্বাধিক তিন ঘন্টা ধরে রাখার সময়সীমা সেট করে।
কৌশলগত সুবিধা
- মাল্টি সিগন্যাল কনফার্মেশন মেকানিজম লেনদেনের নির্ভরযোগ্যতা উল্লেখযোগ্যভাবে উন্নত করেছে
- ডায়নামিক স্টপ লস সেটিংস বাজারের অস্থিরতার সাথে খাপ খাইয়ে নিতে সক্ষম
- স্থির ঝুঁকি-লাভের অনুপাত দীর্ঘমেয়াদী স্থিতিশীল মুনাফা অর্জনে সহায়তা করে
- ন্যূনতম পজিশনের সময়সীমা অত্যধিক লেনদেন এড়াতে সাহায্য করেছে
- ভিজ্যুয়াল মার্কিং সিস্টেম কৌশলগত পর্যবেক্ষণ এবং প্রতিক্রিয়া বিশ্লেষণে সহায়তা করে
- ব্যাকগ্রাউন্ড রঙ পরিবর্তন করুন এবং বর্তমান অবস্থান প্রদর্শন করুন
কৌশলগত ঝুঁকি
- ডাবল-ইউনিফর্মার সিস্টেমগুলি ঝড়ের সময় ভুল সংকেত দিতে পারে
- RSI সূচক শক্তিশালী প্রবণতা মধ্যে কিছু ট্রেডিং সুযোগ মিস করতে পারে
- নির্দিষ্ট বাজার পরিস্থিতিতে স্থির রিস্ক-রিটার্ন অনুপাত যথেষ্ট নমনীয় নাও হতে পারে
- ATR স্টপডাউন অস্থিরতা পরিবর্তনের সময় যথেষ্ট সময় নাও হতে পারে
- সংক্ষিপ্ত পজিশনের সময়সীমার ফলে সময়মত ক্ষতির সুযোগ হারাতে পারে
কৌশল অপ্টিমাইজেশনের দিকনির্দেশনা
- স্বনির্ধারিত সমান্তরাল চক্র নির্বাচন পদ্ধতি প্রবর্তন, বাজারের অবস্থার গতিশীলতা অনুযায়ী সামঞ্জস্যপূর্ণ
- প্রবণতা শক্তি ফিল্টার বৃদ্ধি, সংকেত মান উন্নত
- গতিশীল ঝুঁকি-লাভের তুলনায় বিভিন্ন বাজারের অবস্থার সাথে খাপ খাইয়ে নেওয়ার জন্য সিস্টেম তৈরি করা
- সিগন্যাল নির্ভরযোগ্যতা উন্নত করার জন্য ট্র্যাফিক ইন্টিগ্রেশন
- বাজারের অস্থিরতা বিশ্লেষণ মডিউল যোগ করুন, লেনদেনের সময় নির্বাচন অপ্টিমাইজ করুন
- প্যারামিটার নির্বাচন অপ্টিমাইজ করতে মেশিন লার্নিং অ্যালগরিদম প্রবর্তন করা হচ্ছে
সারসংক্ষেপ
এই কৌশলটি একাধিক প্রযুক্তিগত সূচকগুলির সমন্বয়মূলক সহযোগিতার মাধ্যমে একটি অপেক্ষাকৃত সম্পূর্ণ ট্রেডিং সিস্টেম তৈরি করে। এটি কেবলমাত্র প্রবেশের সংকেতের গুণমানের দিকে মনোযোগ দেয় না, তবে ঝুঁকি ব্যবস্থাপনা এবং মুনাফা লক্ষ্য নির্ধারণের দিকেও মনোযোগ দেয়। যদিও কিছু জায়গায় অপ্টিমাইজেশনের প্রয়োজন রয়েছে, তবে সামগ্রিক কাঠামোর নকশা যুক্তিসঙ্গত, ভাল ব্যবহারিক মূল্য এবং সম্প্রসারণের জায়গা রয়েছে। কৌশলটির মডিউল ডিজাইনও পরবর্তী অপ্টিমাইজেশনের জন্য সুবিধা প্রদান করে।
/*backtest
start: 2024-10-01 00:00:00
end: 2024-10-31 23:59:59
period: 1h
basePeriod: 1h
exchanges: [{"eid":"Futures_Binance","currency":"BTC_USDT"}]
*/

//@version=5
strategy("JakeJohn", overlay=true)

// Input parameters
smaShortLength = input(9, title="Short SMA Length")
smaLongLength = input(21, title="Long SMA Length")
lengthRSI = input(14, title="RSI Length")
rsiOverbought = input(65, title="RSI Overbought Level")
rsiOversold = input(35, title="RSI Oversold Level")
riskRewardRatio = input(2, title="Risk/Reward Ratio") // 2:1
atrMultiplier = input(1.5, title="ATR Multiplier") // Multiplier for ATR to set stop loss

// Calculate indicators
smaShort = ta.sma(close, smaShortLength)
smaLong = ta.sma(close, smaLongLength)
rsi = ta.rsi(close, lengthRSI)
atr = ta.atr(14)

// Entry conditions
longCondition = (smaShort > smaLong) and (rsi < rsiOversold) // Buy when short SMA is above long SMA and RSI is oversold
shortCondition = (smaShort < smaLong) and (rsi > rsiOverbought) // Sell when short SMA is below long SMA and RSI is overbought

// Variables for trade management
var float entryPrice = na
var float takeProfit = na
var int entryBarIndex = na

// Entry logic for long trades
if (longCondition and (strategy.position_size == 0))
    entryPrice := close
    takeProfit := entryPrice + (entryPrice - (entryPrice - (atr * atrMultiplier))) * riskRewardRatio
    strategy.entry("Buy", strategy.long)
    entryBarIndex := bar_index // Record the entry bar index
    label.new(bar_index, high, "BUY", style=label.style_label_up, color=color.green, textcolor=color.white, size=size.small)

// Entry logic for short trades
if (shortCondition and (strategy.position_size == 0))
    entryPrice := close
    takeProfit := entryPrice - (entryPrice - (entryPrice + (atr * atrMultiplier))) * riskRewardRatio
    strategy.entry("Sell", strategy.short)
    entryBarIndex := bar_index // Record the entry bar index
    label.new(bar_index, low, "SELL", style=label.style_label_down, color=color.red, textcolor=color.white, size=size.small)

// Manage trade duration and exit after a minimum of 3 hours
if (strategy.position_size != 0)
    // Check if the trade has been open for at least 3 hours (180 minutes)
    if (bar_index - entryBarIndex >= 180) // 3 hours in 1-minute bars
        if (strategy.position_size > 0)
            strategy.exit("Take Profit Long", from_entry="Buy", limit=takeProfit)
        else
            strategy.exit("Take Profit Short", from_entry="Sell", limit=takeProfit)

// Background colors for active trades
var color tradeColor = na
if (strategy.position_size > 0)
    tradeColor := color.new(color.green, 90) // Light green for long trades
else if (strategy.position_size < 0)
    tradeColor := color.new(color.red, 90) // Light red for short trades
else
    tradeColor := na // No color when no trade is active

bgcolor(tradeColor, title="Trade Background")

// Plotting position tools
if (strategy.position_size > 0)
    // Plot long position tool
    strategy.exit("TP Long", limit=takeProfit)

if (strategy.position_size < 0)
    // Plot short position tool
    strategy.exit("TP Short", limit=takeProfit)

// Plotting indicators
plot(smaShort, color=color.green, title="Short SMA", linewidth=2)
plot(smaLong, color=color.red, title="Long SMA", linewidth=2)

// Visual enhancements for RSI
hline(rsiOverbought, "Overbought", color=color.red)
hline(rsiOversold, "Oversold", color=color.green)
plot(rsi, color=color.blue, title="RSI", linewidth=2)

// Ensure there's at least one plot function
plot(close, color=color.black, title="Close Price", display=display.none) // Hidden plot for compliance