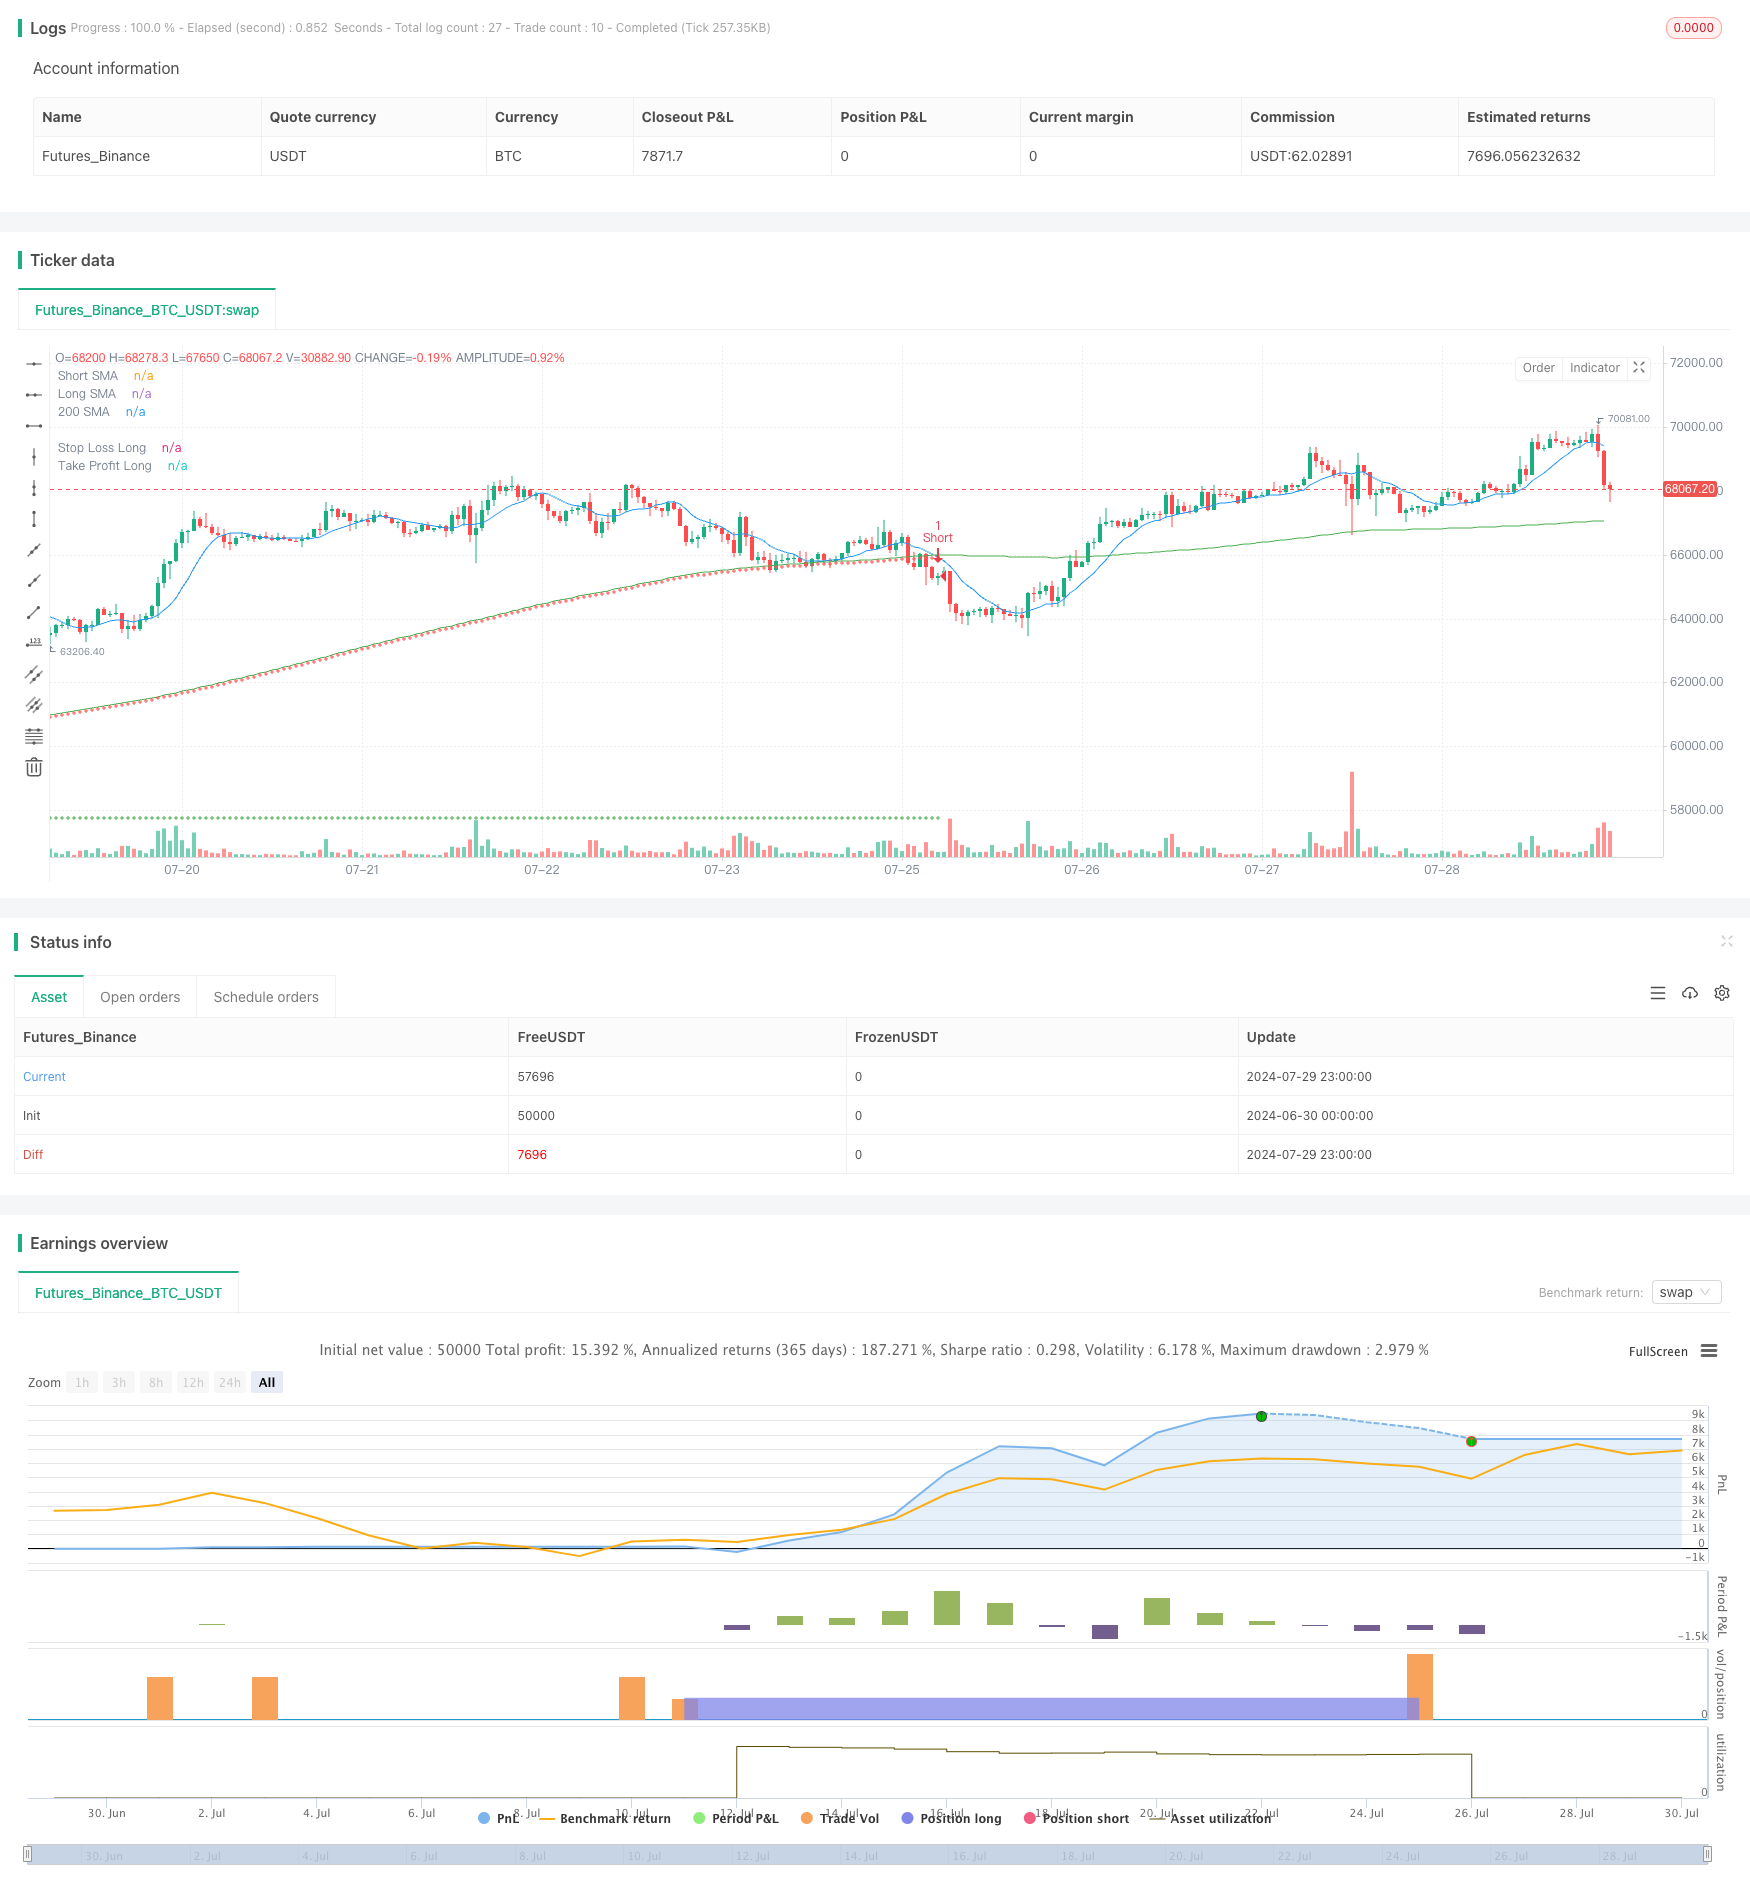
Overview
This is a quantitative trading strategy that combines multi-period Simple Moving Average (SMA) crossovers with a volatility filter. The strategy uses the crossover of short-term and long-term SMAs to generate trading signals, while employing the Average True Range (ATR) indicator as a volatility filter to reduce false signals. The strategy also incorporates dynamic stop-loss levels based on the 200-day moving average and fixed profit targets, aiming to optimize risk management and enhance profitability.
Strategy Principles
Moving Average Crossover Signals: The strategy uses the crossover of short-term (10-day) and long-term (200-day) SMAs to generate buy and sell signals. A long signal is produced when the short-term SMA crosses above the long-term SMA, and a short signal when it crosses below.
Volatility Filter: A 14-day ATR is used as a volatility indicator. Trade signals are only executed when the current ATR is above a specific multiple (determined by a user-defined ATR multiplier) of its 14-day average. This helps filter out potential false signals during low volatility periods.
Dynamic Stop-Loss: The strategy uses the 200-day SMA as a benchmark for dynamic stop-loss levels. The stop-loss for long positions is set at 99.9% of the 200-day SMA, while for short positions, it’s set at 100.1% of the 200-day SMA.
Fixed Profit Targets: The strategy sets fixed profit targets for each trade. The profit target for long trades is the entry price plus 7.5 price units, while for short trades, it’s the entry price minus 7.5 price units.
Strategy Advantages
Multiple Signal Confirmation: By combining moving average crossovers with volatility filtering, the strategy reduces the risk of false signals and improves trade reliability.
Dynamic Risk Management: The use of dynamic stop-losses based on the 200-day SMA allows the strategy to adapt to changing market conditions, providing more flexible risk control.
Clear Profit Objectives: Fixed profit targets help protect realized gains and prevent drawdowns caused by excessive greed.
High Adaptability: Strategy parameters can be adjusted for different markets and trading instruments, enhancing the strategy’s versatility.
Visual Aids: The strategy plots various SMA lines, stop-loss, and profit target levels on the chart, providing traders with intuitive market analysis tools.
Strategy Risks
Lag in Moving Averages: SMAs are inherently lagging indicators, which may produce delayed signals in rapidly changing markets, leading to untimely entries or exits.
Overtrading: In highly volatile markets without clear trends, the strategy may generate too many trading signals, increasing transaction costs.
Limitations of Fixed Profit Targets: Fixed profit targets may result in premature position closures during strong trends, limiting potential profits.
Dependence on Specific Market Conditions: The strategy performs well in trending markets but may underperform in ranging or rapidly reversing markets.
Parameter Sensitivity: The strategy’s performance heavily depends on the chosen parameters; improper parameter settings may lead to poor strategy performance.
Strategy Optimization Directions
Dynamic Parameter Adjustment: Consider dynamically adjusting SMA periods and ATR multiplier based on market conditions to adapt to different market environments.
Add Trend Strength Filter: Introduce additional trend strength indicators (such as ADX) to ensure trading only in strong trend markets.
Optimize Profit Targets: Consider using dynamic profit targets, such as those based on ATR or recent price volatility ranges, to better adapt to market fluctuations.
Introduce Partial Position Closing: Implement partial position closures at certain profit levels to both lock in partial profits and allow remaining positions to continue profiting.
Incorporate Market Regime Recognition: Develop algorithms to identify different market states (e.g., trending, ranging, high volatility) and adjust strategy parameters or pause trading accordingly.
Enhance Stop-Loss Mechanism: Consider using trailing stops or stop-losses based on support/resistance levels to provide more flexible risk management.
Conclusion
This Multi-Period Moving Average Crossover Strategy with Dynamic Volatility Filter combines classic elements of technical analysis with modern risk management techniques. By integrating SMA crossover signals, ATR volatility filtering, dynamic stop-losses, and fixed profit targets, the strategy aims to capture market trends while controlling risk. Although some inherent limitations exist, through continuous optimization and adaptive adjustments, this strategy has the potential to become a robust trading system. Traders using this strategy should pay attention to parameter selection and backtesting, and customize it according to specific market conditions and personal risk preferences.
/*backtest
start: 2024-06-30 00:00:00
end: 2024-07-30 00:00:00
period: 1h
basePeriod: 15m
exchanges: [{"eid":"Futures_Binance","currency":"BTC_USDT"}]
*/

//@version=5
strategy("SMA Crossover Strategy with Volatility Filter", overlay=true)

// Define input parameters
shortSMA = input.int(10, title="Short SMA Length", minval=1)
longSMA = input.int(200, title="Long SMA Length", minval=1)
sma200Length = 200
atrLength = input.int(14, title="ATR Length", minval=1)
atrMultiplier = input.float(1.0, title="ATR Multiplier", minval=0.1)

// Calculate SMAs
smaShort = ta.sma(close, shortSMA)
smaLong = ta.sma(close, longSMA)
sma200 = ta.sma(close, sma200Length)

// Calculate ATR for volatility
atr = ta.atr(atrLength)

// Plot SMAs
plot(smaShort, color=color.blue, title="Short SMA")
plot(smaLong, color=color.red, title="Long SMA")
plot(sma200, color=color.green, title="200 SMA")

// Calculate stop loss levels
stopLossLong = sma200 * 0.999
stopLossShort = sma200 * 1.001

// Initialize take profit levels
var float takeProfitLong = na
var float takeProfitShort = na

// Generate buy/sell signals
longCondition = ta.crossover(smaShort, smaLong) and atr > atrMultiplier * ta.sma(atr, atrLength)
shortCondition = ta.crossunder(smaShort, smaLong) and atr > atrMultiplier * ta.sma(atr, atrLength)

// Execute trades with stop loss and take profit
if (longCondition)
    strategy.entry("Long", strategy.long)
    takeProfitLong := close + 7.5
    strategy.exit("Long Exit", "Long", stop=stopLossLong, limit=takeProfitLong)

if (shortCondition)
    strategy.entry("Short", strategy.short)
    takeProfitShort := close - 7.5
    strategy.exit("Short Exit", "Short", stop=stopLossShort, limit=takeProfitShort)

// Plot stop loss and take profit levels on chart
plot(strategy.position_size > 0 ? stopLossLong : na, style=plot.style_cross, color=color.red, title="Stop Loss Long")
plot(strategy.position_size > 0 ? takeProfitLong : na, style=plot.style_cross, color=color.green, title="Take Profit Long")
plot(strategy.position_size < 0 ? stopLossShort : na, style=plot.style_cross, color=color.red, title="Stop Loss Short")
plot(strategy.position_size < 0 ? takeProfitShort : na, style=plot.style_cross, color=color.green, title="Take Profit Short")