RSI Dynamic Range Reversal Quantitative Strategy with Volatility Optimization Model
Author: ChaoZhang, Date: 2024-11-12 15:55:34Tags: RSI

Overview
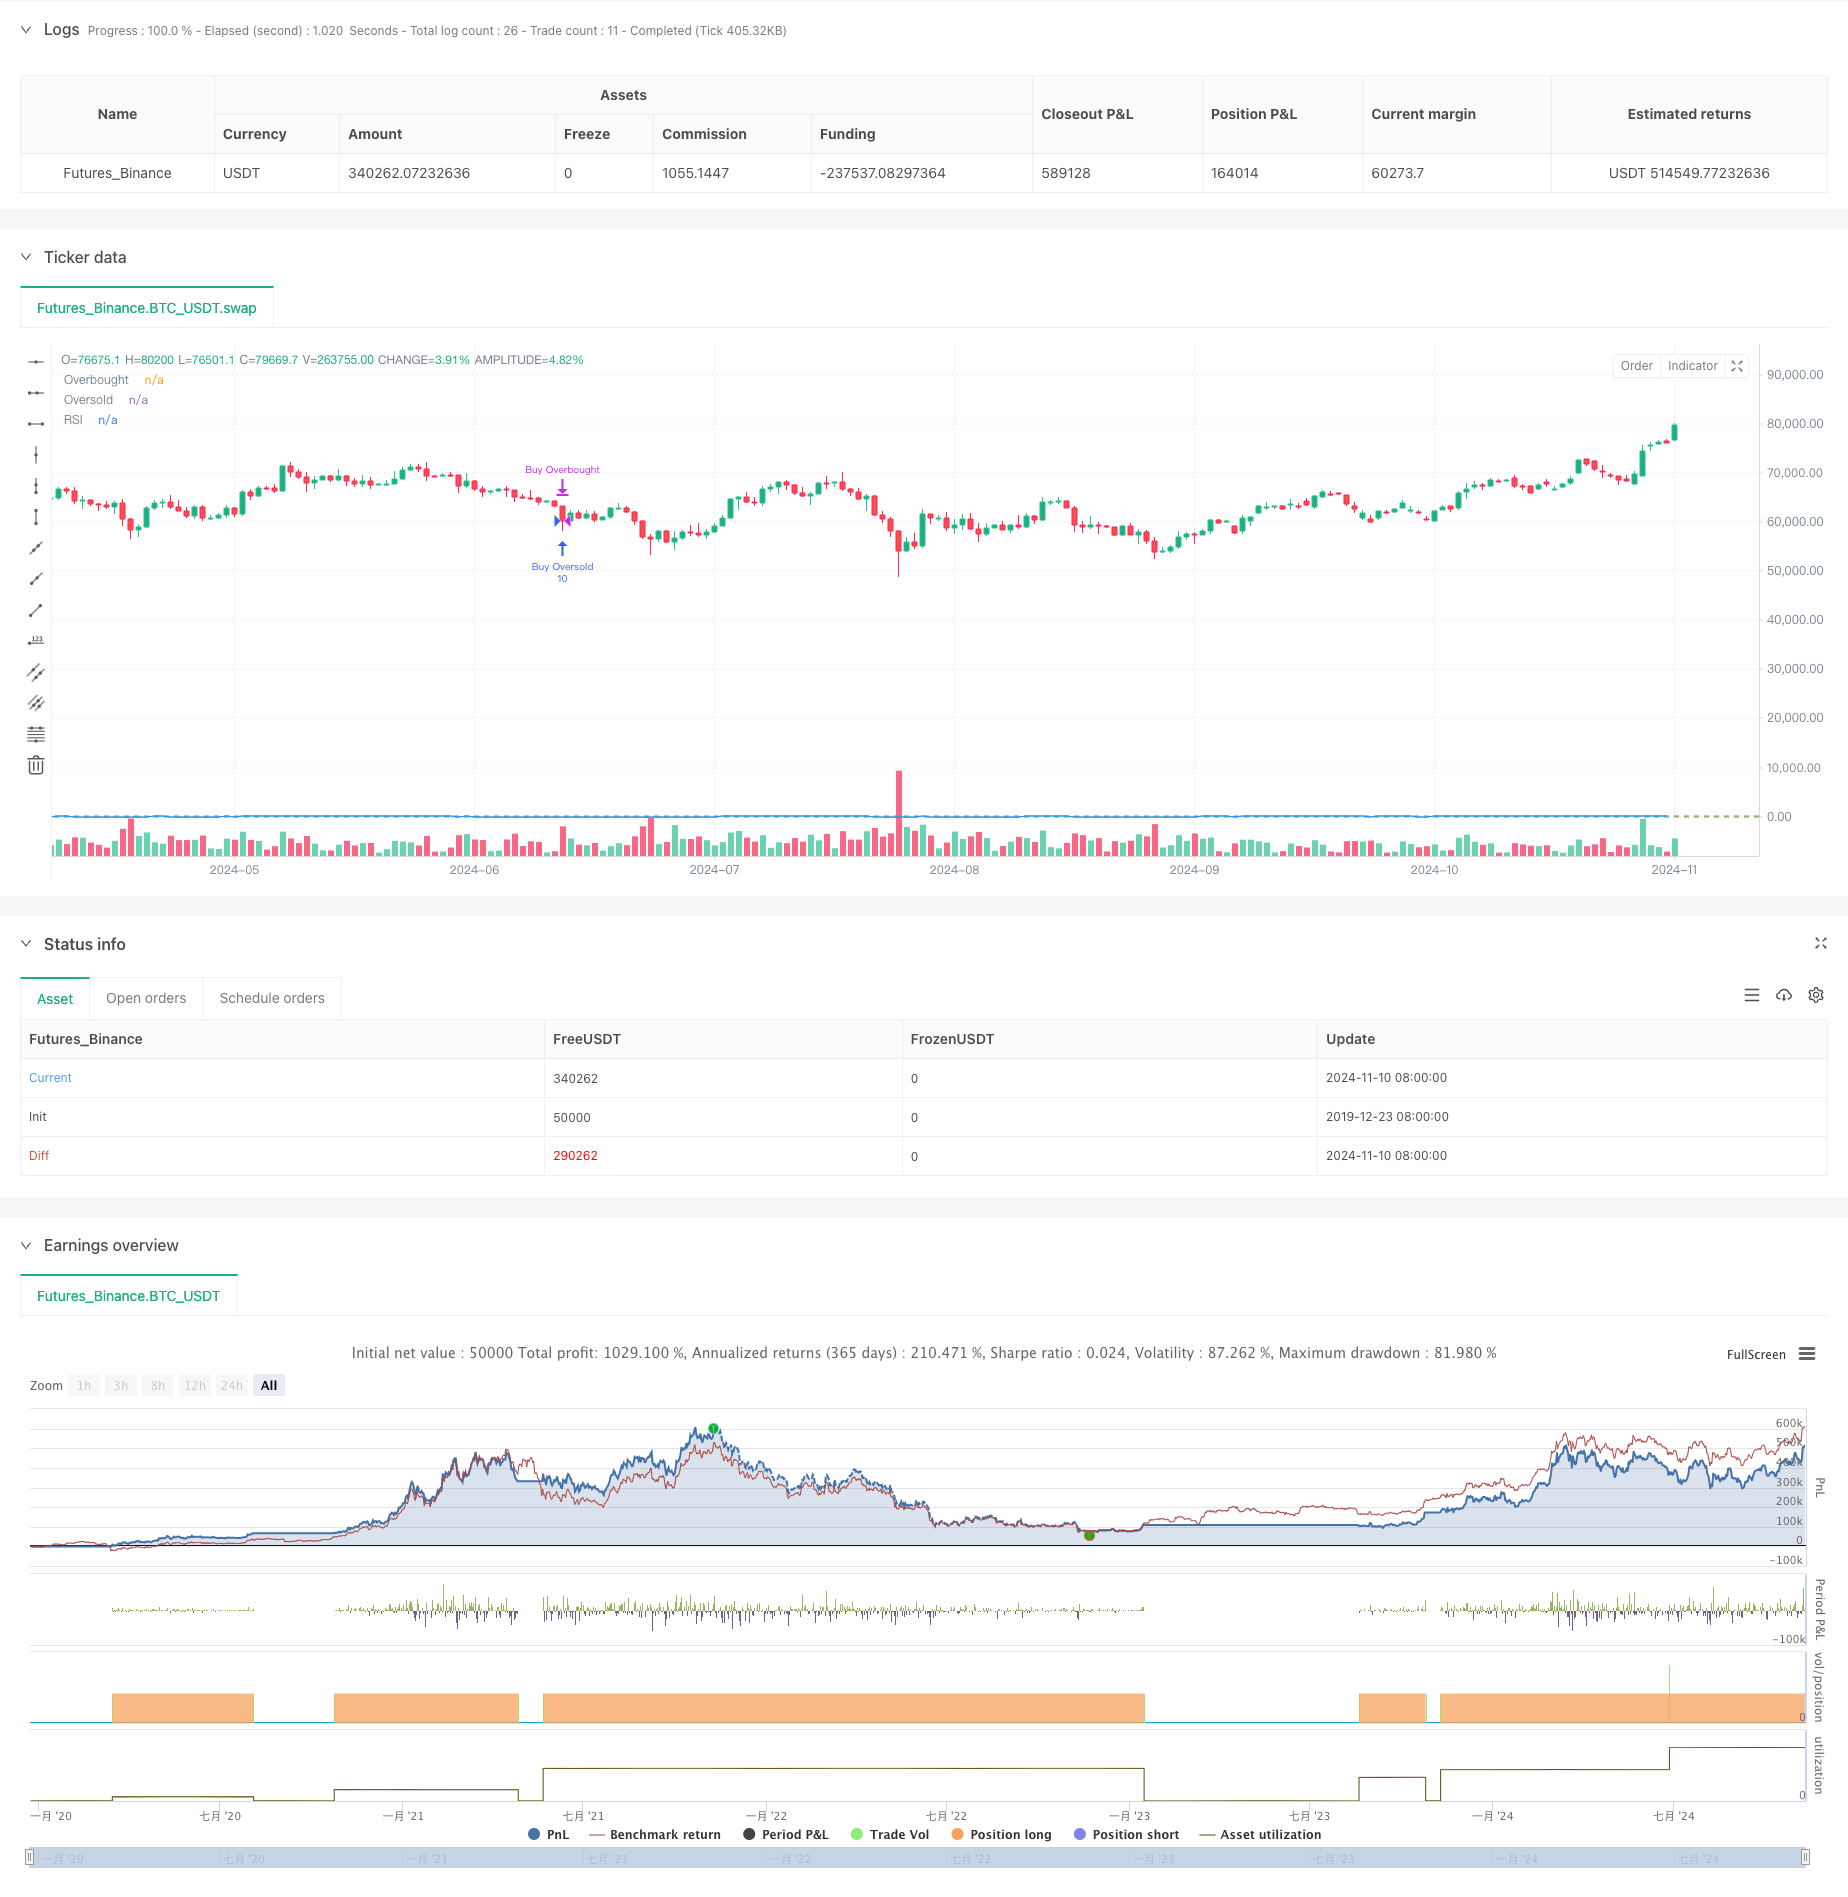
This strategy is a dynamic range reversal trading system based on the RSI indicator, capturing market turning points through adjustable overbought/oversold zones combined with convergence/divergence sensitivity parameters. The strategy employs a fixed number of contracts for trading and operates within a specific backtesting timeframe. The core of this model lies in identifying market overbought and oversold conditions through dynamic RSI changes and executing reversal trades at appropriate timing.
Strategy Principles
The strategy utilizes a 14-period RSI as its core indicator, setting 80 and 30 as overbought and oversold benchmark levels. By introducing a convergence/divergence sensitivity parameter (set at 3.0), it adds dynamic adjustment capability to the traditional RSI strategy. Long positions are established when RSI breaks above the overbought level and closed when RSI falls below the oversold level. Similarly, long positions are established when RSI falls below the oversold level and closed when RSI breaks above the overbought level. Each trade uses a fixed 10 contracts to ensure stability in capital utilization.
Strategy Advantages
- Dynamic Range Adjustment: Achieves dynamic adjustment of overbought/oversold zones through convergence/divergence parameters
- Clear Risk Control: Uses fixed contract quantity for trading, facilitating capital management
- Time Range Limitation: Avoids trading outside target periods through specific backtesting timeframe settings
- Signal Clarity: Uses RSI crossover signals as trading triggers, reducing false signals
- Visualization Support: Displays RSI trends and key levels through charts for monitoring and analysis
Strategy Risks
- Choppy Market Risk: May result in frequent trading in sideways markets, increasing transaction costs
- Trend Continuation Risk: Reversal signals might lead to premature position closure in strong trends
- Fixed Contract Risk: Doesn’t consider market volatility changes, potentially over-risking in high volatility periods
- Parameter Sensitivity: Strategy performance heavily depends on RSI period and overbought/oversold level settings
- Time Dependence: Strategy effectiveness may be limited to specific backtesting periods
Strategy Optimization Directions
- Implement Volatility Adaptation: Suggest dynamically adjusting contract quantity based on market volatility
- Add Trend Filters: Combine other technical indicators to judge market trends, avoiding reversals in strong trends
- Optimize Signal Confirmation: Can add volume and other auxiliary indicators for signal confirmation
- Dynamic Time Periods: Automatically adjust RSI calculation periods based on different market phases
- Stop Loss Mechanism: Add dynamic stop losses to control single trade risk
Summary
This is a dynamic range reversal strategy based on the RSI indicator, achieving a relatively complete trading system through flexible parameter settings and clear trading rules. The strategy’s main advantages lie in its dynamic adjustment capability and clear risk control, while attention needs to be paid to potential risks in choppy and trending markets. Through optimization measures such as volatility adjustment and trend filtering, the strategy has room for further improvement. Overall, this is a practical quantitative trading strategy framework suitable for in-depth research and practical verification.
/*backtest
start: 2019-12-23 08:00:00
end: 2024-11-11 00:00:00
period: 1d
basePeriod: 1d
exchanges: [{"eid":"Futures_Binance","currency":"BTC_USDT"}]
*/

//@version=5
strategy("RSI Options Strategy", overlay=true)

// RSI settings
rsiLength = input(14, title="RSI Length")
rsiOverbought = input(80, title="Overbought Level")
rsiOversold = input(30, title="Oversold Level")
rsiSource = input(close, title="RSI Source")
rsi = ta.rsi(rsiSource, rsiLength)

// Convergence/Divergence Input
convergenceLevel = input(3.0, title="Convergence/Divergence Sensitivity")

// Order size (5 contracts)
contracts = 10

// Date Range for Backtesting
startDate = timestamp("2024-09-10 00:00")
endDate = timestamp("2024-11-09 23:59")

// Limit trades to the backtesting period
inDateRange = true

// RSI buy/sell conditions with convergence/divergence sensitivity
buySignalOverbought = ta.crossover(rsi, rsiOverbought - convergenceLevel)
sellSignalOversold = ta.crossunder(rsi, rsiOversold + convergenceLevel)
buySignalOversold = ta.crossunder(rsi, rsiOversold - convergenceLevel)
sellSignalOverbought = ta.crossover(rsi, rsiOverbought + convergenceLevel)

// Execute trades only within the specified date range
if (inDateRange)
    // Buy when RSI crosses above 80 (overbought)
    if (buySignalOverbought)
        strategy.entry("Buy Overbought", strategy.long, qty=contracts)

    // Sell when RSI crosses below 30 (oversold)
    if (sellSignalOversold)
        strategy.close("Buy Overbought")

    // Buy when RSI crosses below 30 (oversold)
    if (buySignalOversold)
        strategy.entry("Buy Oversold", strategy.long, qty=contracts)

    // Sell when RSI crosses above 80 (overbought)
    if (sellSignalOverbought)
        strategy.close("Buy Oversold")

// Plot the RSI for visualization
plot(rsi, color=color.blue, title="RSI")
hline(rsiOverbought, "Overbought", color=color.red)
hline(rsiOversold, "Oversold", color=color.green)
- Dynamic Dual-Indicator Momentum Trend Quantitative Strategy System
- Dual Moving Average-RSI Multi-Signal Trend Trading Strategy
- Dynamic EMA System Combined with RSI Momentum Indicator for Optimized Intraday Trading Strategy
- Multi-Technical Indicator Crossover Momentum Trend Following Strategy
- Dynamic Stop-Loss Adjustment Elephant Bar Trend Following Strategy
- Dual-Period RSI Trend Momentum Strategy with Pyramiding Position Management System
- Dynamic RSI Quantitative Trading Strategy with Multiple Moving Average Crossover
- Dynamic Trend RSI Indicator Crossing Strategy
- Multi-Dimensional KNN Algorithm with Volume-Price Candlestick Pattern Trading Strategy
- Adaptive Multi-Strategy Dynamic Switching System: A Quantitative Trading Strategy Combining Trend Following and Range Oscillation
- Advanced Multi-Indicator Multi-Dimensional Trend Cross Quantitative Strategy
- Intelligent Time-Based Long-Short Rotation Balanced Trading Strategy
- Advanced MACD Dynamic Trend Quantitative Trading Strategy
- Trend Breakout Trading System with Moving Average (TBMA Strategy)
- ATR-Based Multi-Trend Following Strategy with Take-Profit and Stop-Loss Optimization System
- RSI Momentum-based Smart Adaptive Trading System with Multi-level Risk Management
- Adaptive RSI Oscillator Dynamic Trading Strategy with Threshold Optimization
- RSI and AO Synergistic Trend Following Quantitative Trading Strategy
- Adaptive Trend Momentum RSI Strategy with Moving Average Filter System
- Dual Moving Average Cross RSI Momentum Strategy with Risk-Reward Optimization System
- Multi-Indicator Crossover Dynamic Strategy System: A Quantitative Trading Model Based on EMA, RVI and Trading Signals
- Bollinger Bands Momentum Trend Following Quantitative Strategy
- Multi-Period Technical Analysis and Market Sentiment Trading Strategy
- Dynamic Holding Period Strategy Based on 123 Point Reversal Pattern
- Multi-Technical Indicator Crossover Momentum Quantitative Trading Strategy - Integration Analysis Based on EMA, RSI and ADX
- Parabolic SAR Divergence Trading Strategy
- Combined Momentum SMA Crossover Strategy with Market Sentiment and Resistance Level Optimization System
- Multi-Period RSI Momentum and Triple EMA Trend Following Composite Strategy
- Multi-Moving Average Momentum Trend Following Strategy
- E9 Shark-32 Pattern Quantitative Price Breakout Strategy
- Open Market Exposure Dynamic Position Adjustment Quantitative Trading Strategy