Overview
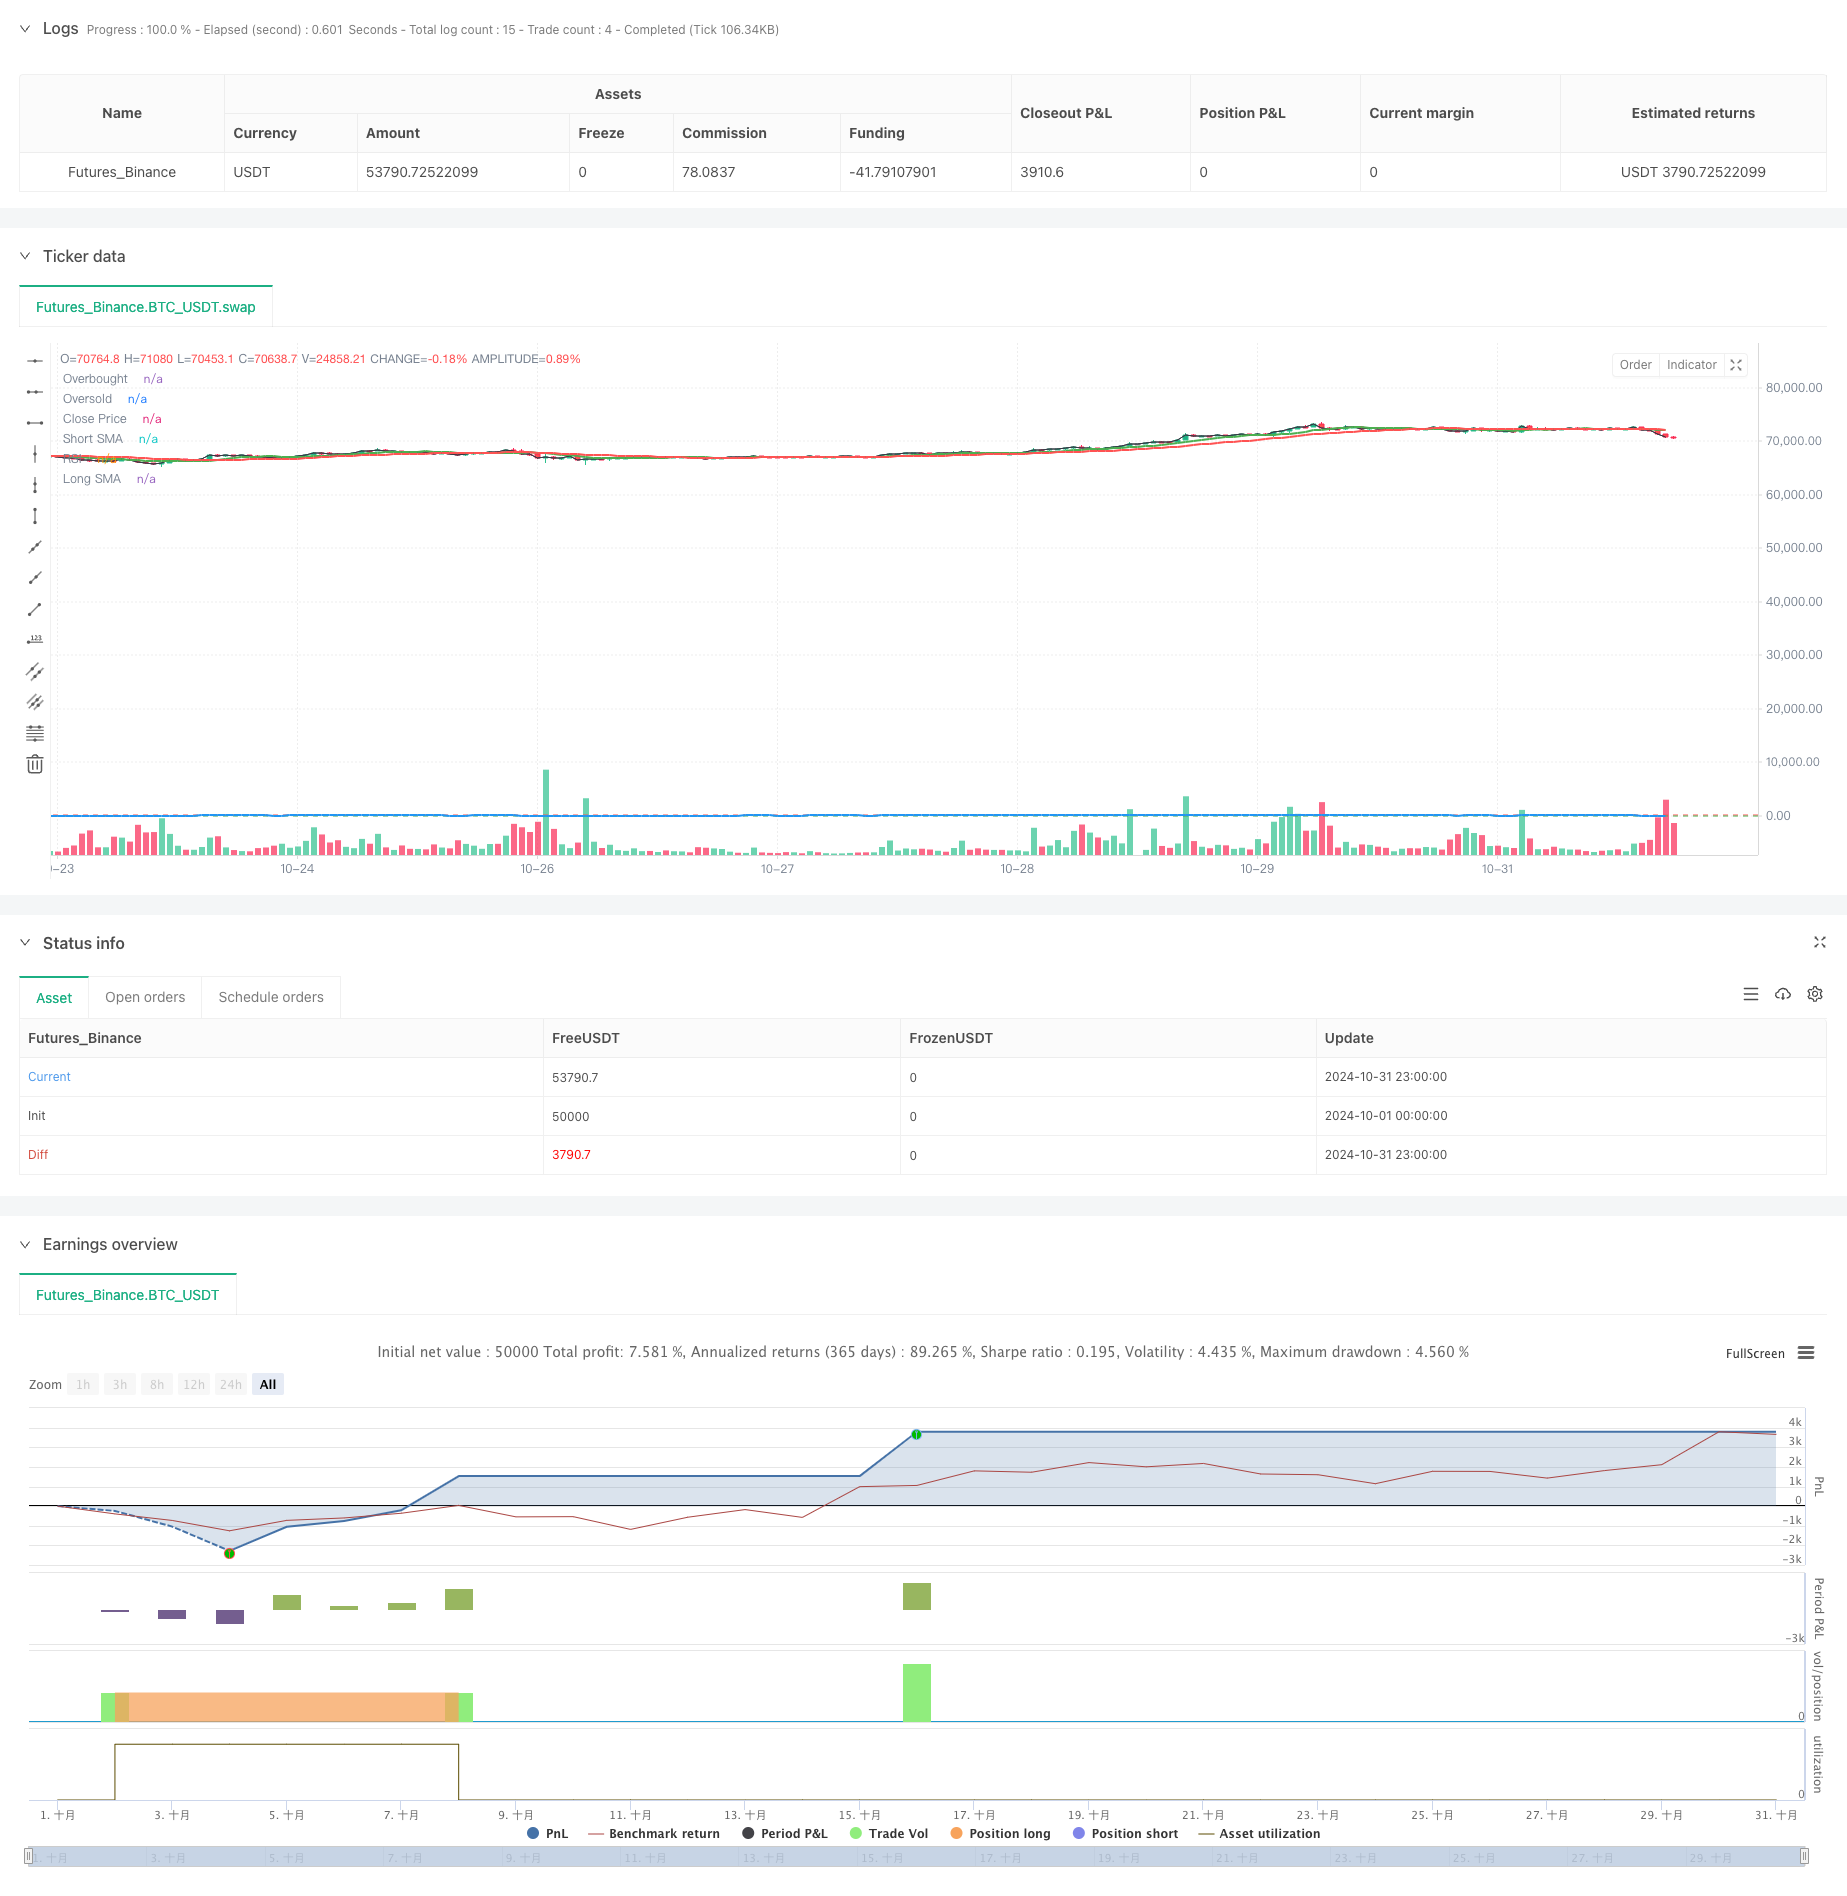
This is a quantitative trading strategy that combines dual moving average crossover, RSI overbought/oversold conditions, and risk-reward ratio management. The strategy determines market trend direction through short-term and long-term moving average crossovers while using RSI indicator to identify overbought/oversold zones for more precise trade signal filtering. It also integrates ATR-based dynamic stop-loss settings and a fixed risk-reward ratio profit target management system.
Strategy Principles
The strategy employs 9-day and 21-day moving averages as the foundation for trend determination, with RSI indicator’s overbought/oversold zones (35⁄65) for signal confirmation. Long entry conditions require the short-term MA above the long-term MA and RSI in oversold territory (below 35); short entry requires the short-term MA below the long-term MA and RSI in overbought territory (above 65). The strategy uses 1.5 times ATR value for stop-loss distance and automatically calculates profit targets based on a 2:1 risk-reward ratio. To prevent overtrading, a minimum 3-hour holding period is implemented.
Strategy Advantages
- Multiple signal confirmation mechanism significantly improves trade reliability
- Dynamic stop-loss settings adapt to market volatility
- Fixed risk-reward ratio aids in long-term stable profitability
- Minimum holding period effectively prevents overtrading
- Visual marking system facilitates strategy monitoring and backtest analysis
- Background color changes intuitively display current position status
Strategy Risks
- Dual MA system may generate false signals in ranging markets
- RSI indicator might miss trading opportunities in strong trends
- Fixed risk-reward ratio may lack flexibility in certain market conditions
- ATR stops may not respond quickly enough to volatility spikes
- Minimum holding period might cause missed stop-loss opportunities
Strategy Optimization Directions
- Introduce adaptive moving average period selection based on market conditions
- Add trend strength filters to improve signal quality
- Develop dynamic risk-reward ratio adjustment system for different market environments
- Integrate volume indicators to enhance signal reliability
- Add market volatility analysis module to optimize trade timing
- Incorporate machine learning algorithms for parameter optimization
Summary
This strategy constructs a relatively complete trading system through the coordination of multiple technical indicators. It focuses not only on entry signal quality but also on risk management and profit target setting. While there are areas for optimization, the overall framework design is reasonable with good practical value and room for expansion. The modular design also provides convenience for subsequent optimizations.
/*backtest
start: 2024-10-01 00:00:00
end: 2024-10-31 23:59:59
period: 1h
basePeriod: 1h
exchanges: [{"eid":"Futures_Binance","currency":"BTC_USDT"}]
*/

//@version=5
strategy("JakeJohn", overlay=true)

// Input parameters
smaShortLength = input(9, title="Short SMA Length")
smaLongLength = input(21, title="Long SMA Length")
lengthRSI = input(14, title="RSI Length")
rsiOverbought = input(65, title="RSI Overbought Level")
rsiOversold = input(35, title="RSI Oversold Level")
riskRewardRatio = input(2, title="Risk/Reward Ratio") // 2:1
atrMultiplier = input(1.5, title="ATR Multiplier") // Multiplier for ATR to set stop loss

// Calculate indicators
smaShort = ta.sma(close, smaShortLength)
smaLong = ta.sma(close, smaLongLength)
rsi = ta.rsi(close, lengthRSI)
atr = ta.atr(14)

// Entry conditions
longCondition = (smaShort > smaLong) and (rsi < rsiOversold) // Buy when short SMA is above long SMA and RSI is oversold
shortCondition = (smaShort < smaLong) and (rsi > rsiOverbought) // Sell when short SMA is below long SMA and RSI is overbought

// Variables for trade management
var float entryPrice = na
var float takeProfit = na
var int entryBarIndex = na

// Entry logic for long trades
if (longCondition and (strategy.position_size == 0))
    entryPrice := close
    takeProfit := entryPrice + (entryPrice - (entryPrice - (atr * atrMultiplier))) * riskRewardRatio
    strategy.entry("Buy", strategy.long)
    entryBarIndex := bar_index // Record the entry bar index
    label.new(bar_index, high, "BUY", style=label.style_label_up, color=color.green, textcolor=color.white, size=size.small)

// Entry logic for short trades
if (shortCondition and (strategy.position_size == 0))
    entryPrice := close
    takeProfit := entryPrice - (entryPrice - (entryPrice + (atr * atrMultiplier))) * riskRewardRatio
    strategy.entry("Sell", strategy.short)
    entryBarIndex := bar_index // Record the entry bar index
    label.new(bar_index, low, "SELL", style=label.style_label_down, color=color.red, textcolor=color.white, size=size.small)

// Manage trade duration and exit after a minimum of 3 hours
if (strategy.position_size != 0)
    // Check if the trade has been open for at least 3 hours (180 minutes)
    if (bar_index - entryBarIndex >= 180) // 3 hours in 1-minute bars
        if (strategy.position_size > 0)
            strategy.exit("Take Profit Long", from_entry="Buy", limit=takeProfit)
        else
            strategy.exit("Take Profit Short", from_entry="Sell", limit=takeProfit)

// Background colors for active trades
var color tradeColor = na
if (strategy.position_size > 0)
    tradeColor := color.new(color.green, 90) // Light green for long trades
else if (strategy.position_size < 0)
    tradeColor := color.new(color.red, 90) // Light red for short trades
else
    tradeColor := na // No color when no trade is active

bgcolor(tradeColor, title="Trade Background")

// Plotting position tools
if (strategy.position_size > 0)
    // Plot long position tool
    strategy.exit("TP Long", limit=takeProfit)

if (strategy.position_size < 0)
    // Plot short position tool
    strategy.exit("TP Short", limit=takeProfit)

// Plotting indicators
plot(smaShort, color=color.green, title="Short SMA", linewidth=2)
plot(smaLong, color=color.red, title="Long SMA", linewidth=2)

// Visual enhancements for RSI
hline(rsiOverbought, "Overbought", color=color.red)
hline(rsiOversold, "Oversold", color=color.green)
plot(rsi, color=color.blue, title="RSI", linewidth=2)

// Ensure there's at least one plot function
plot(close, color=color.black, title="Close Price", display=display.none) // Hidden plot for compliance