Dynamic Trend Quantitative Strategy Based on Bollinger Bands and RSI Cross
Author: ChaoZhang, Date: 2024-11-27 14:49:42Tags: RSISMASD

Overview
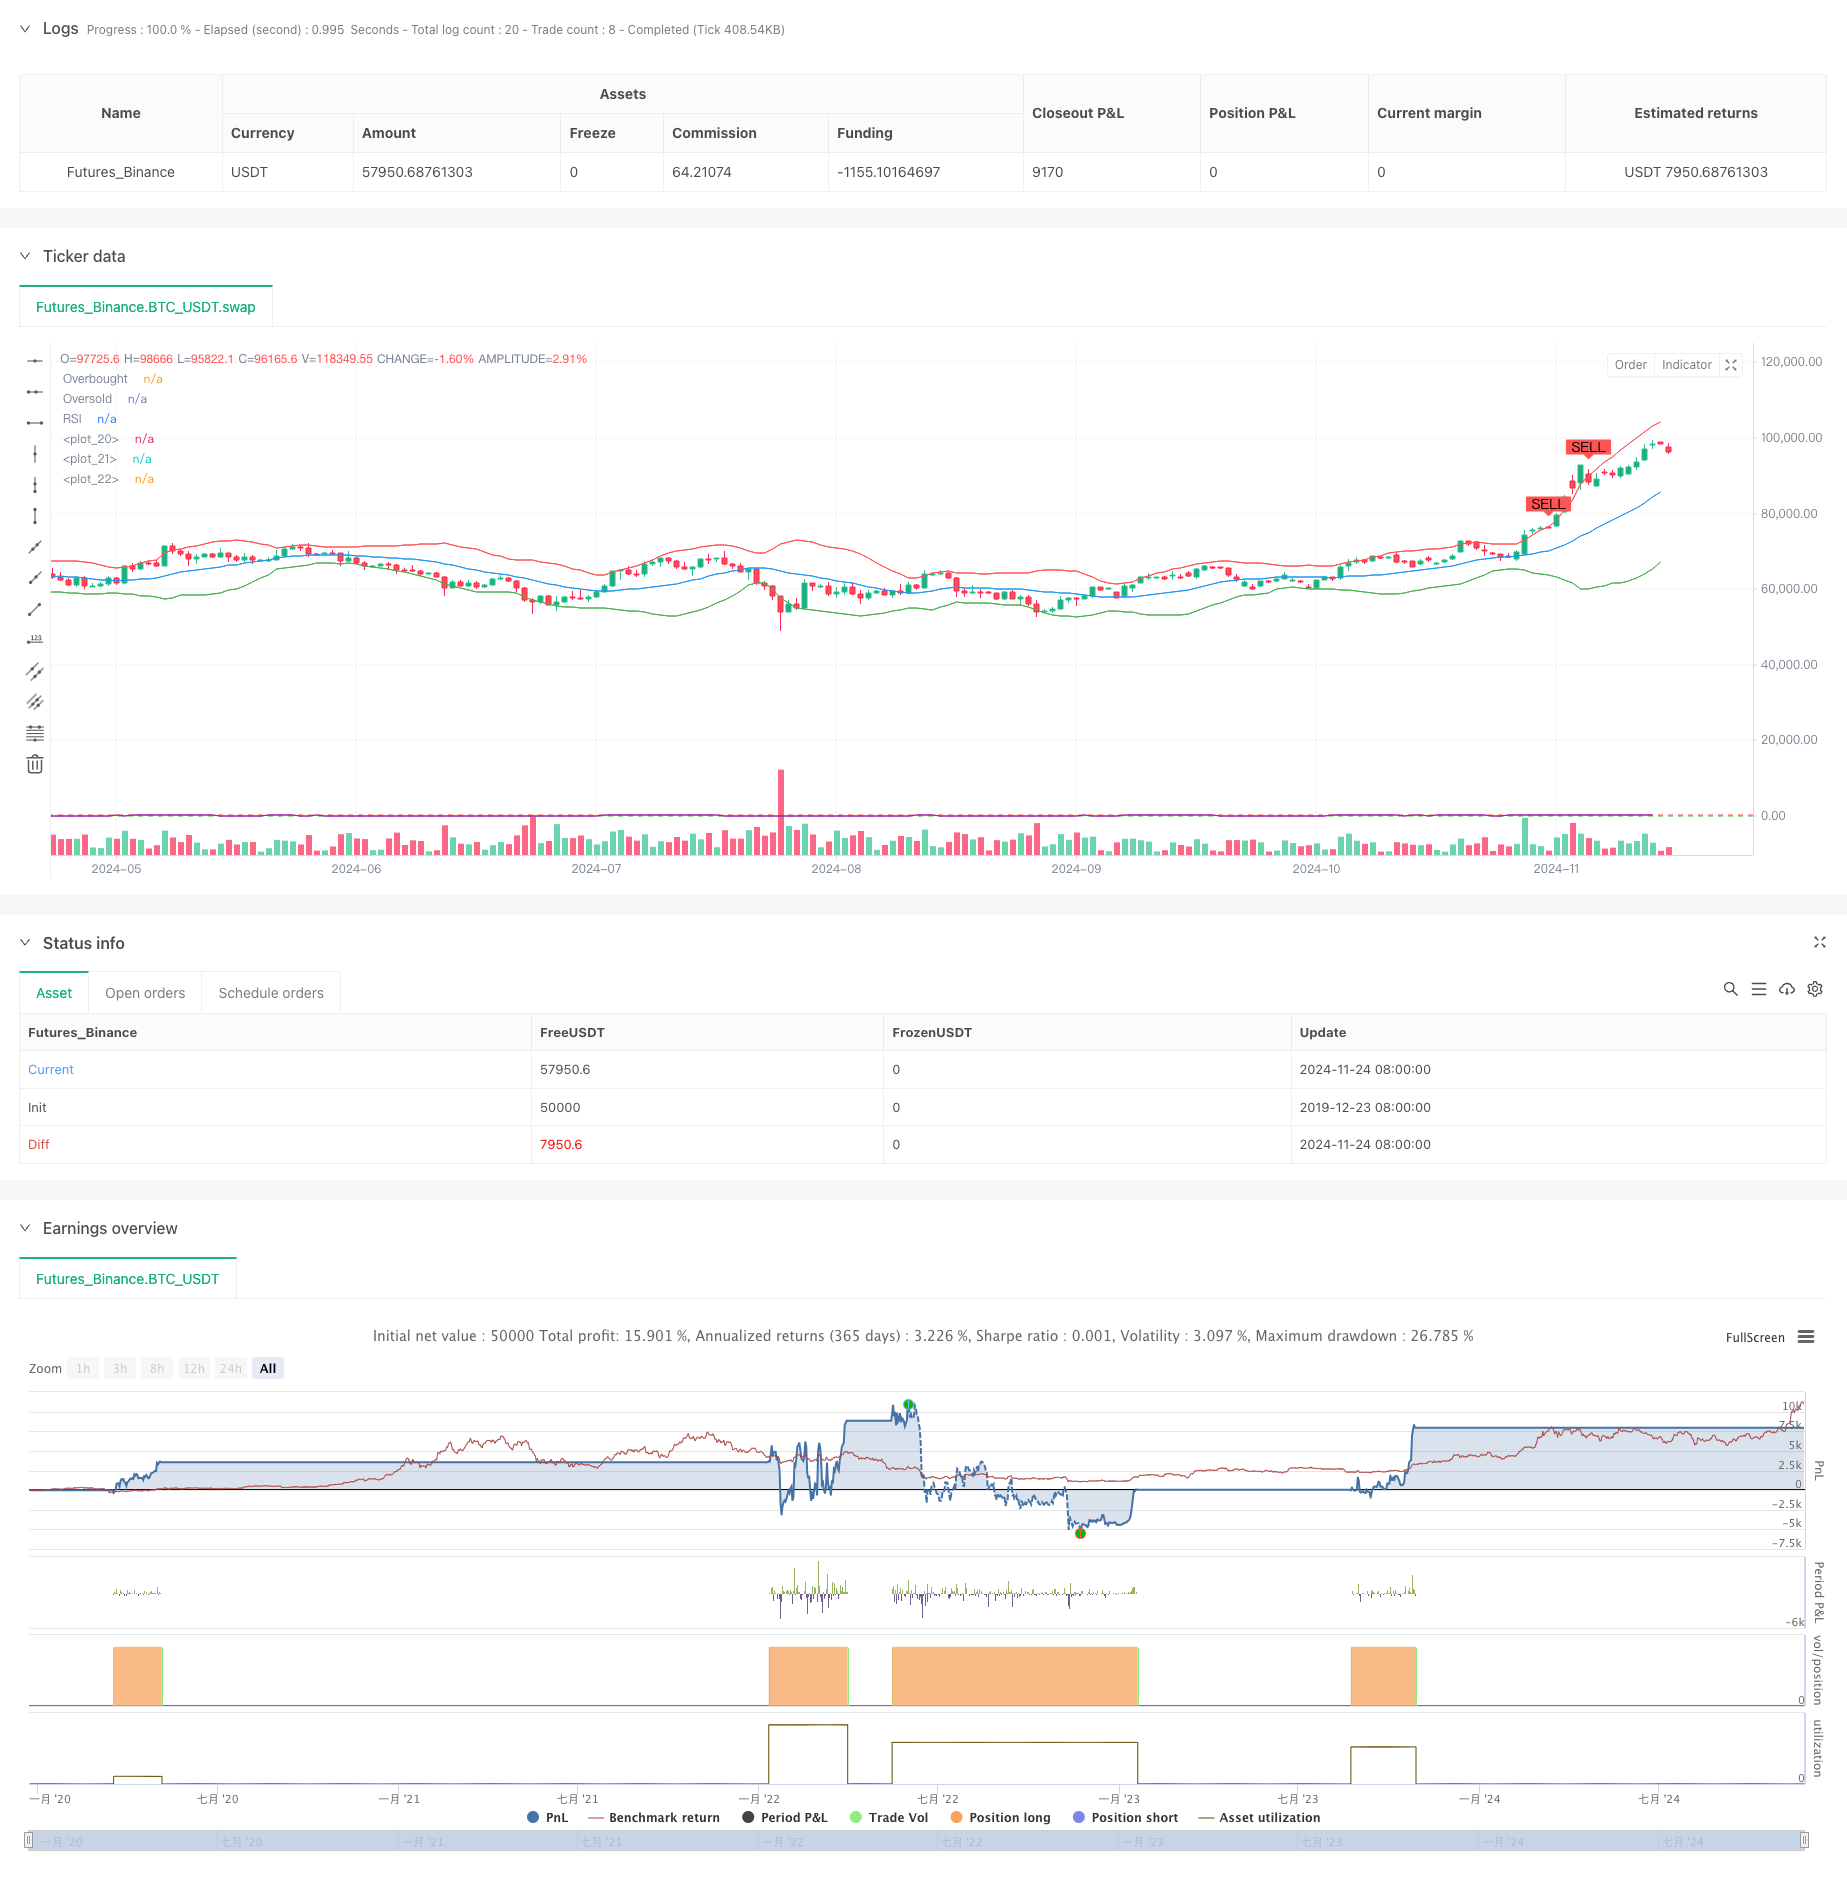
This strategy is a quantitative trading approach that combines Bollinger Bands and Relative Strength Index (RSI). It captures market turning points by coordinating price breakouts of Bollinger Bands with RSI overbought/oversold zones. The strategy employs 20-period Bollinger Bands and 14-period RSI, entering long positions when price breaks below the lower band while RSI is in oversold territory, and closing positions when price breaks above the upper band while RSI is in overbought territory.
Strategy Principles
The core logic is based on the synergy of two technical indicators. Bollinger Bands consist of a middle band (20-period SMA) and upper/lower bands (middle ±2 standard deviations), reflecting price volatility and trends. RSI calculates the relative strength of price movements to identify overbought/oversold conditions. When price touches the lower band and RSI is below 30, it suggests potential oversold conditions and rebound opportunities. When price touches the upper band and RSI is above 70, it indicates potential overbought conditions and correction risks. Cross-validation of these indicators enhances signal reliability.
Strategy Advantages
- High signal reliability: Dual confirmation through Bollinger Bands and RSI effectively filters false signals
- Rational risk control: Achieves adaptive risk management using Bollinger Bands’ statistical properties and RSI’s overbought/oversold judgments
- Scientific parameter selection: Uses widely validated classic parameters with good universality
- Simple calculation method: Clear strategy logic with low computational complexity for real-time execution
- Accurate trend capture: Effectively identifies major market turning points
Strategy Risks
- Oscillation market risk: May generate frequent trading signals in sideways markets, increasing transaction costs
- Trend continuation risk: Early position closing might miss subsequent market movements
- Signal lag: Technical indicators have inherent lag, potentially missing optimal entry points
- False breakout risk: Short-term price breakouts of Bollinger Bands may generate false signals
- Parameter sensitivity: Strategy performance is significantly influenced by indicator parameter selection
Strategy Optimization Directions
- Introduce trend filters: Add moving average trend judgment to reduce false signals in oscillating markets
- Dynamic parameter adjustment: Adaptively adjust Bollinger Bands’ standard deviation multiplier based on market volatility
- Optimize stop-loss settings: Add trailing stop-loss functionality to improve trend capture
- Add volume confirmation: Incorporate volume indicators to enhance signal reliability
- Improve exit mechanism: Design more flexible exit conditions to avoid premature position closing
Summary
This is a quantitative strategy that innovatively combines classic technical indicators Bollinger Bands and RSI. Through the complementary effects of these indicators, it ensures signal reliability while effectively capturing market turning points. The strategy features clear logic and simple calculations with strong practicality. Although there are some inherent risks, the suggested optimization directions can further enhance strategy stability and profitability. This strategy is suitable for trending markets and can provide objective trading signal references for investors.
/*backtest
start: 2019-12-23 08:00:00
end: 2024-11-25 08:00:00
period: 1d
basePeriod: 1d
exchanges: [{"eid":"Futures_Binance","currency":"BTC_USDT"}]
*/

//@version=5
strategy("Bollinger Bands + RSI Strategy", overlay=true)

// Bollinger Bands
length = 20
src = close
mult = 2.0
basis = ta.sma(src, length)
dev = mult * ta.stdev(src, length)
upper = basis + dev
lower = basis - dev

// RSI
rsiLength = 14
rsiOverbought = 70
rsiOversold = 30
rsiValue = ta.rsi(src, rsiLength)

// Plot Bollinger Bands
plot(basis, color=color.blue, linewidth=1)
plot(upper, color=color.red, linewidth=1)
plot(lower, color=color.green, linewidth=1)

// Plot Buy/Sell signals
buySignal = ta.crossover(close, lower) and rsiValue < rsiOversold
sellSignal = ta.crossunder(close, upper) and rsiValue > rsiOverbought

plotshape(series=buySignal, title="Buy Signal", location=location.belowbar, color=color.green, style=shape.labelup, text="BUY")
plotshape(series=sellSignal, title="Sell Signal", location=location.abovebar, color=color.red, style=shape.labeldown, text="SELL")

// Strategy Entry/Exit
if (buySignal)
    strategy.entry("Buy", strategy.long)
if (sellSignal)
    strategy.close("Buy")

// RSI Plot (not on overlay, for reference)
rsiPlot = plot(rsiValue, title="RSI", color=color.purple, linewidth=1, offset=-1)
hline(rsiOverbought, "Overbought", color=color.red)
hline(rsiOversold, "Oversold", color=color.green)
- Bollinger Bands and RSI Combined Trading Strategy
- Adaptive Bollinger Bands Dynamic Position Management Strategy
- Bollinger Bands and RSI Crossover Trading Strategy
- Bollinger Bands and RSI Combined Dynamic Trading Strategy
- Enhanced Mean Reversion Strategy with Bollinger Bands and RSI Integration
- Bollinger Bands Momentum Trend Following Quantitative Strategy
- Multi-Technical Indicator Dynamic Adaptive Trading Strategy (MTDAT)
- Intraday BUY/SELL
- SMA Crossover Strategy with RSI Filter and Alerts
- Dynamic Stop-Loss and Take-Profit Dual Moving Average Trend Following Strategy with Candlestick Reactions
- Adaptive Bollinger Breakout with Moving Average Quantitative Strategy System
- AI-Optimized Adaptive Stop-Loss Trading System with Multiple Technical Indicator Integration
- Multi-Period Moving Average Crossover with Volume Analysis System
- Dual Moving Average Momentum Tracking Quantitative Strategy
- Dual Moving Average Crossover Strategy with Adaptive Stop-Loss and Take-Profit
- Adaptive Trend Following Strategy Based on Momentum Oscillator
- PVT-EMA Trend Crossover Volume-Price Strategy
- MACD-EMA Multi-Period Dynamic Crossover Quantitative Trading System
- MACD Dynamic Oscillation Cross-Prediction Strategy
- VWAP-ATR Dynamic Price Action Trading System
- Mean Reversion Strategy with Bollinger Bands, RSI and ATR-Based Dynamic Stop-Loss System
- Dynamic Trading Strategy System Based on Parabolic SAR Indicator
- Adaptive Volatility and Momentum Quantitative Trading System (AVMQTS)
- Advanced Trend Trading Strategy Based on Bollinger Bands and Candlestick Patterns
- ATR Volatility and Moving Average Based Adaptive Trend Following Exit Strategy
- Dual EMA Momentum Trend Trading Strategy with Full Body Candle Signal System
- Dual Timeframe Supertrend with RSI Optimization System
- Dual Moving Average Crossover Trend Following Strategy with Dynamic Stop-Loss and Take-Profit System
- Multi-Timeframe Trend Following Trading System with ATR and MACD Integration
- Dual Timeframe Supertrend RSI Intelligent Trading Strategy