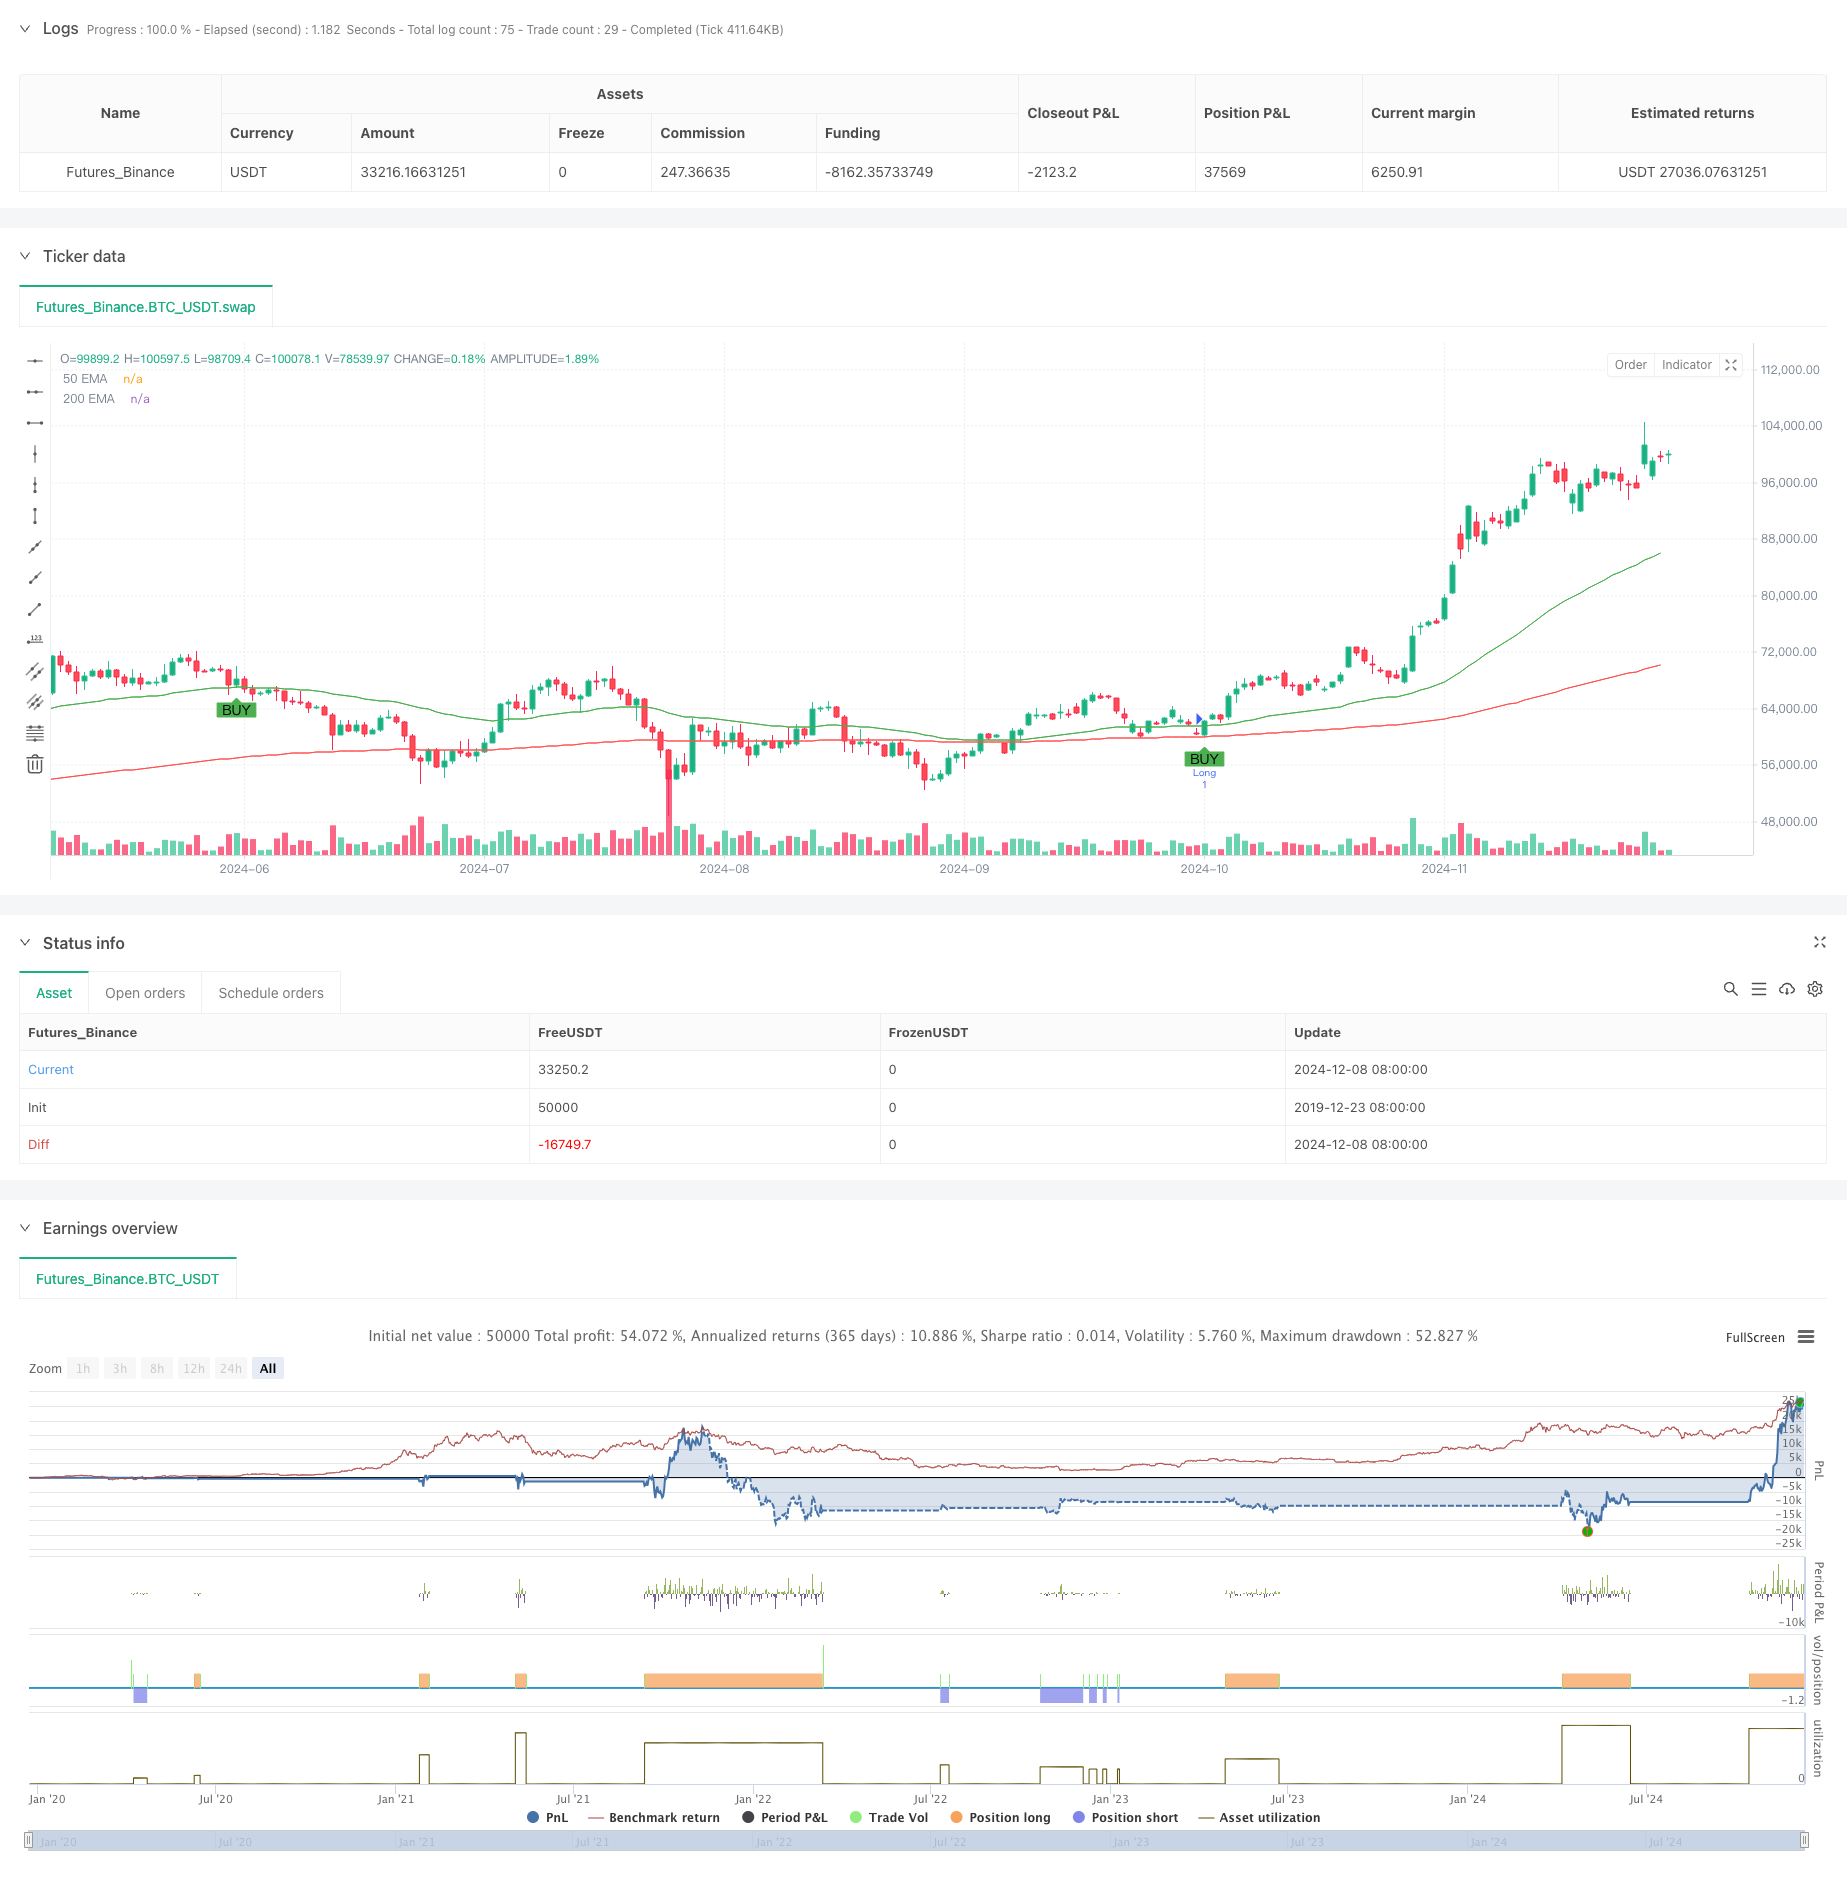
Gold Trend Channel Reversal Momentum Strategy
Author: ChaoZhang, Date: 2024-12-11 17:52:15Tags: EMAATRRSI

Overview
This strategy is a trading system based on trend channels, price reversal patterns, and momentum indicators. It combines the moving average system (EMA) to determine trend direction, uses the Relative Strength Index (RSI) to identify consolidation zones, and employs engulfing patterns to find precise entry points. The strategy manages risk through dynamic volatility indicators (ATR) and implements quick profit-taking.
Strategy Principles
The core logic is built on multi-layer technical indicator validation: 1. Uses 50 and 200-period EMAs to construct trend channels and determine trend direction through crossovers 2. Utilizes RSI(14) neutral zone (45-55) to identify momentum accumulation areas 3. Confirms price reversal signals through engulfing patterns 4. Sets dynamic stop-loss levels based on ATR(14) 5. Implements fixed 20-point profit targets for quick profit realization
Strategy Advantages
- Multiple technical indicator cross-validation improves signal reliability
- Combines trend-following and reversal trading to capture market opportunities
- Filters false signals through RSI neutral zone
- Dynamic stop-loss mechanism adapts to market volatility changes
- Fixed profit targets facilitate disciplined trading
- Clear strategy logic, easy to understand and implement
Strategy Risks
- May generate frequent trading signals in choppy markets
- Fixed profit targets might limit profits in strong trends
- Moving average system may lag in violent fluctuations
- RSI neutral zone judgment might miss some trading opportunities
- Engulfing patterns may produce false signals in high volatility periods
Strategy Optimization Directions
- Introduce volume indicators to validate price breakout validity
- Develop adaptive profit target mechanism to replace fixed points
- Add trend strength filters to reduce false signals in choppy markets
- Optimize RSI range to improve signal capture efficiency
- Incorporate multiple timeframe signals to enhance accuracy
Summary
The strategy constructs a systematic trading approach through comprehensive technical analysis tools. It emphasizes both trend following and price reversal, using multiple indicator validation to improve trade success rates. While it has certain limitations, continuous optimization and risk management can provide traders with reliable trading references.
/*backtest
start: 2019-12-23 08:00:00
end: 2024-12-09 08:00:00
period: 1d
basePeriod: 1d
exchanges: [{"eid":"Futures_Binance","currency":"BTC_USDT"}]
*/

//@version=5
strategy("Gold Scalping Strategy with Precise Entries", overlay=true)

// Inputs for EMAs and ATR
ema50 = ta.ema(close, 50)
ema200 = ta.ema(close, 200)
atr = ta.atr(14)
rsi = ta.rsi(close, 14)

// Set 50 pips for gold (assuming 1 pip = 0.10 movement in XAU/USD)
pip_target = 20 * 0.10

// Bullish/Bearish Engulfing Pattern
bullish_engulfing = close > open and close[1] < open[1] and close > close[1] and open < close[1]
bearish_engulfing = close < open and close[1] > open[1] and close < close[1] and open > close[1]

// Define trend and exact entry conditions
longCondition = (ema50 > ema200) and (rsi >= 45 and rsi <= 55) and (bullish_engulfing) and (close > ema50)
shortCondition = (ema50 < ema200) and (rsi >= 45 and rsi <= 55) and (bearish_engulfing) and (close < ema50)

// ATR-based stop loss
longStopLoss = close - atr
shortStopLoss = close + atr

// Entry Conditions with precise points
if (longCondition)
    strategy.entry("Long", strategy.long)
    strategy.exit("Take Profit/Stop Loss", "Long", limit=close + pip_target, stop=longStopLoss)

if (shortCondition)
    strategy.entry("Short", strategy.short)
    strategy.exit("Take Profit/Stop Loss", "Short", limit=close - pip_target, stop=shortStopLoss)

// Plot EMAs
plot(ema50, color=color.green, title="50 EMA")
plot(ema200, color=color.red, title="200 EMA")

// Plot Buy/Sell Signals
plotshape(series=longCondition, location=location.belowbar, color=color.green, style=shape.labelup, title="Buy Signal", text="BUY")
plotshape(series=shortCondition, location=location.abovebar, color=color.red, style=shape.labeldown, title="Sell Signal", text="SELL")
- EMA RSI Crossover Strategy
- ATR-RSI Enhanced Trend Following Trading System
- Multi-Timeframe Quantitative Trading Strategy Based on EMA-Smoothed RSI and ATR Dynamic Stop-Loss/Take-Profit
- Dynamic Stop-Loss Multi-Period RSI Trend Following Strategy
- Han Yue - Trend Following Trading Strategy Based on Multiple EMAs, ATR and RSI
- 4-Hour Timeframe Engulfing Pattern Trading Strategy with Dynamic Take Profit and Stop Loss Optimization
- Multi-Indicator Intelligent Pyramiding Strategy
- RSI50_EMA Long Only Strategy
- Adaptive Multi-State EMA-RSI Momentum Strategy with Choppiness Index Filter System
- AlphaTradingBot Trading Strategy
- Dual Timeframe Stochastic Momentum Trading Strategy
- Adaptive Bollinger Bands Dynamic Position Management Strategy
- Dynamic RSI Smart Timing Swing Trading Strategy
- Bidirectional Trading Strategy Based on Candlestick Absorption Pattern Analysis
- Bollinger Breakout with Mean Reversion 4H Quantitative Trading Strategy
- Trend Following Dynamic Grid Position Sizing Strategy
- Dual BBI (Bulls and Bears Index) Crossover Strategy
- Dynamic Long/Short Swing Trading Strategy with Moving Average Crossover Signal System
- Multi-Technical Indicator Trend Following Trading Strategy
- Advanced Volatility Mean Reversion Trading Strategy: Multi-Dimensional Quantitative Trading System Based on VIX and Moving Average
- Advanced EMA Momentum Trend Trading Strategy
- Multi-MA Trend Intensity Trading Strategy - A Flexible Smart Trading System Based on MA Deviation
- Volume-Weighted Dual Trend Detection System
- Multi-Factor Counter-Trend Trading Strategy
- Enhanced Momentum Oscillator and Stochastic Divergence Quantitative Trading Strategy
- Multi-Timeframe Fibonacci Retracement with Trend Breakout Trading Strategy
- Multi-Indicator Trend Following Strategy with Profit Optimization
- Fractal Breakout Momentum Trading Strategy with Take Profit Optimization
- Adaptive Mean-Reversion Trading Strategy Based on Chande Momentum Oscillator
- MACD-Supertrend Dual Confirmation Trend Following Trading Strategy