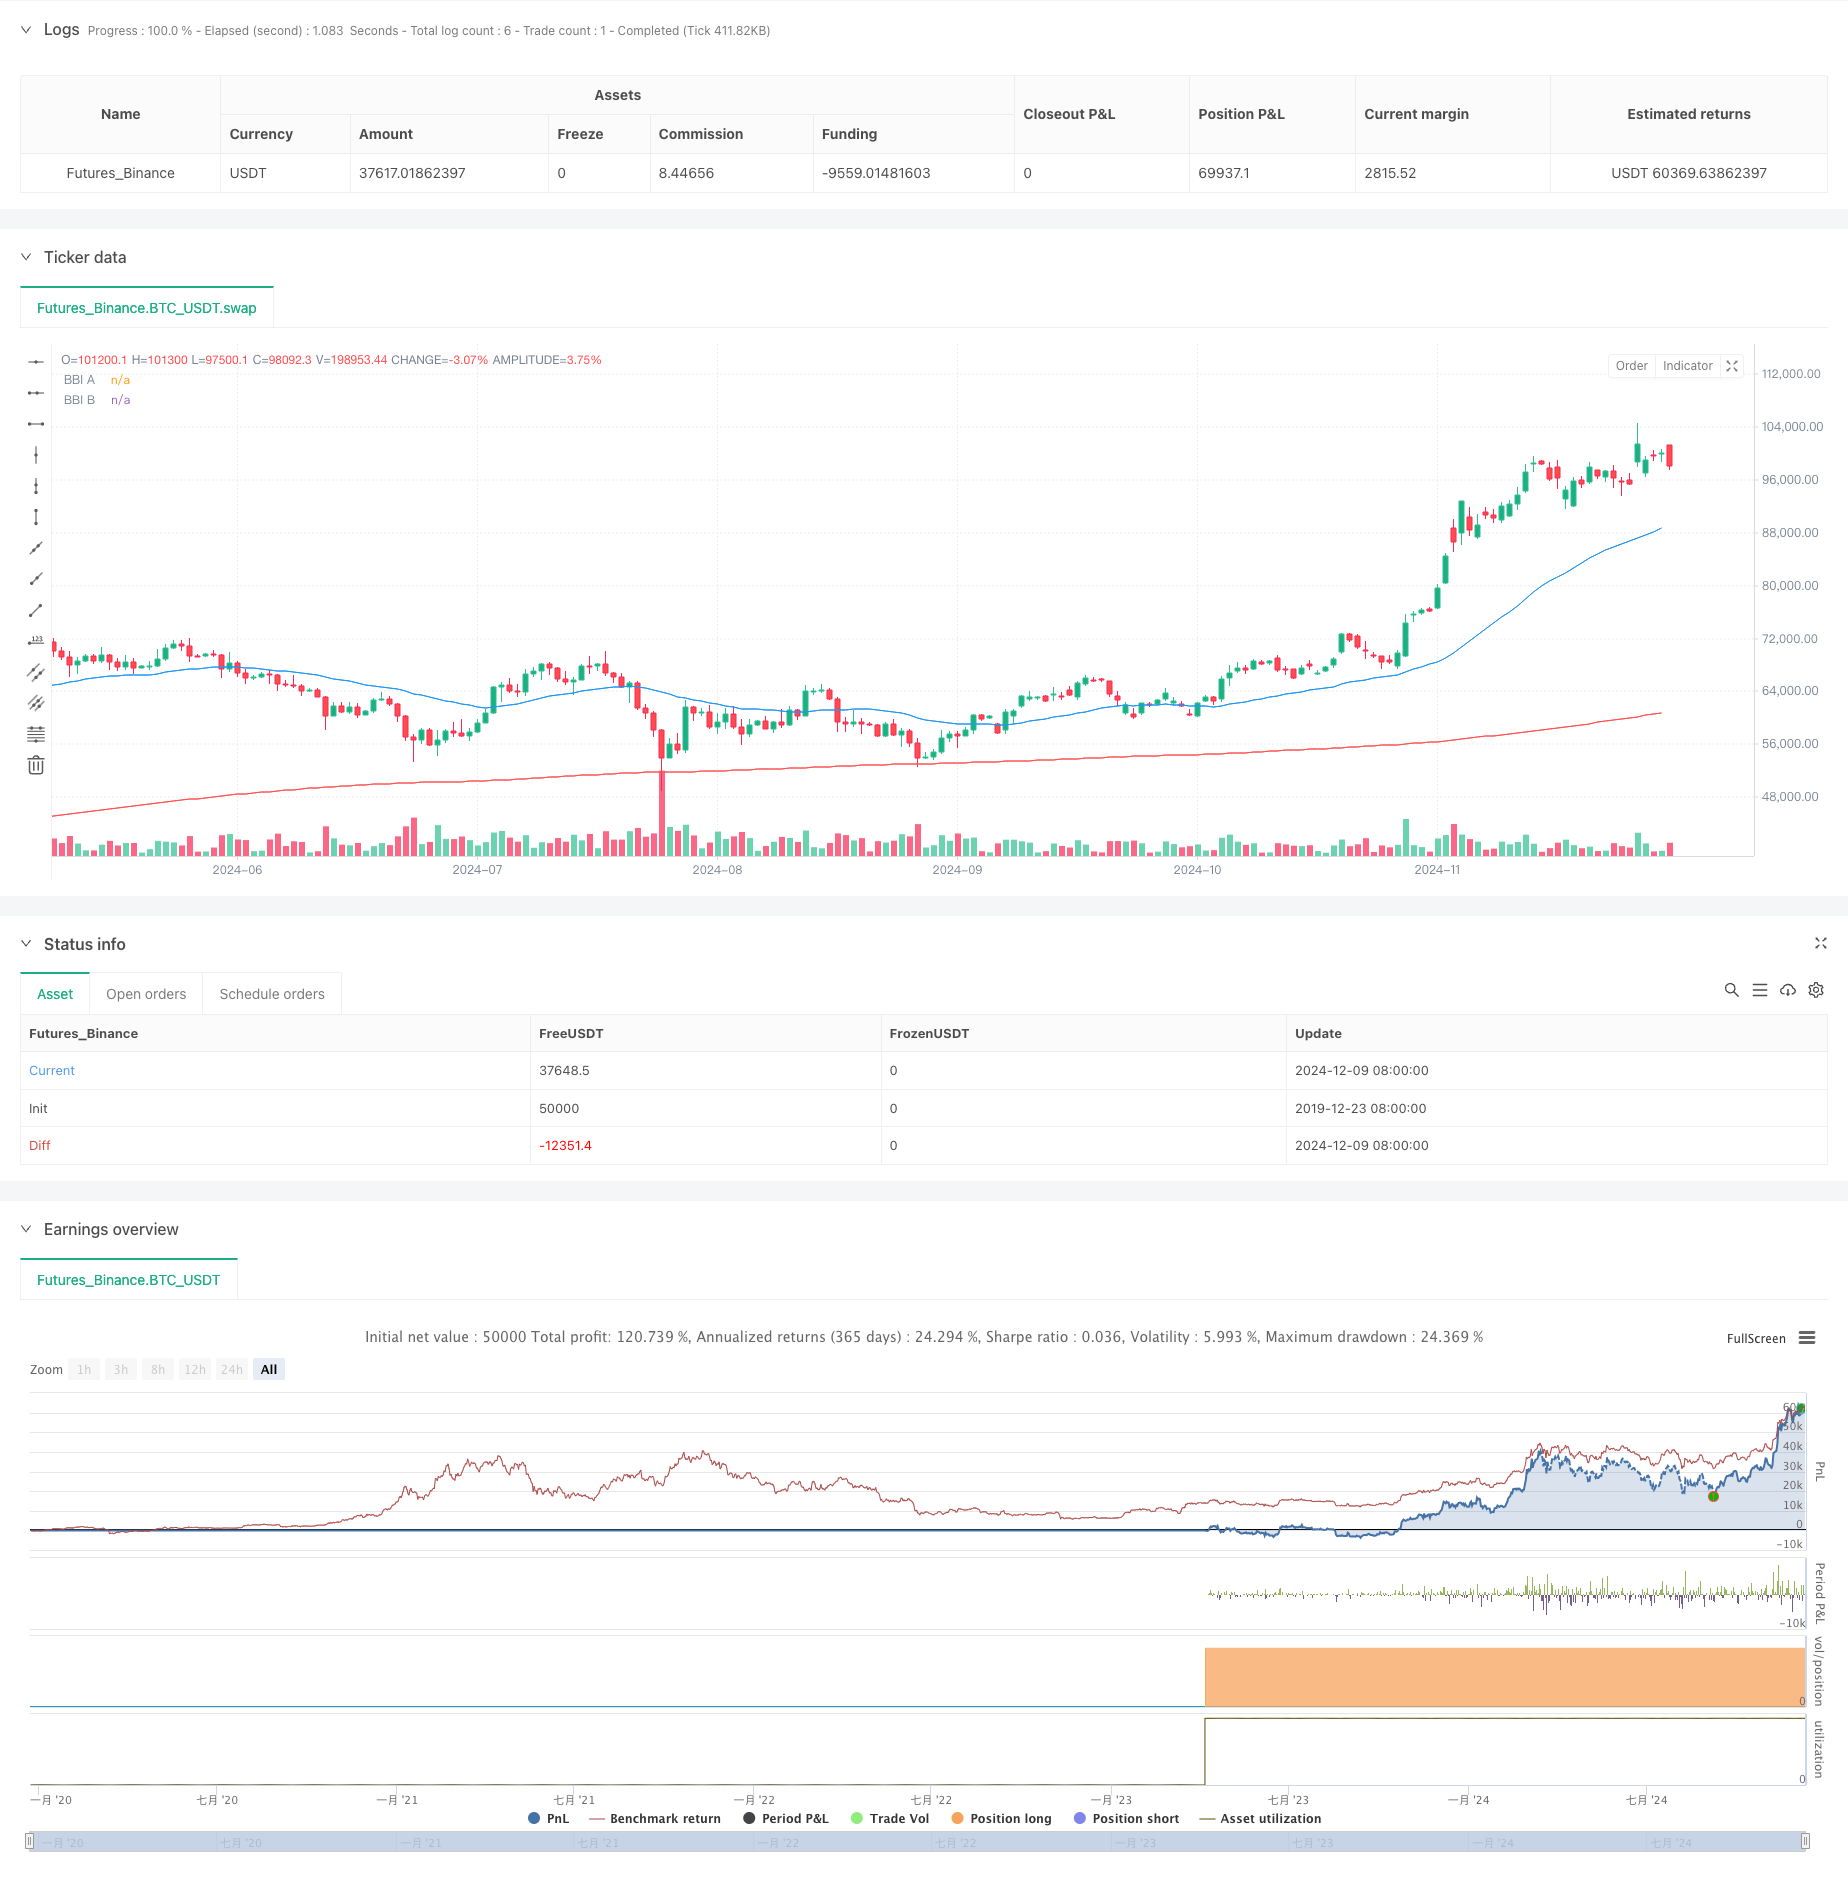
This strategy is based on the crossover signals between two groups of Bulls and Bears Index (BBI) with different periods. It captures market trend changes by comparing the crossover of short-period and long-period BBIs for trading decisions.
Strategy Overview
The strategy employs two groups of BBI indicators, each consisting of 4 Simple Moving Averages (SMA) with different periods. Group A uses shorter periods (12/24/48/80) to capture short-term price trends, while Group B uses longer periods (120/240/480/600) to confirm long-term trends. Long positions are opened when the short-period BBI crosses above the long-period BBI and closed when it crosses below.
Strategy Principle
- Calculate two groups of BBI indicators, each derived from 4 SMAs with different periods
- Group A BBI = (SMA12 + SMA24 + SMA48 + SMA80) / 4
- Group B BBI = (SMA120 + SMA240 + SMA480 + SMA600) / 4
- Enter long positions when Group A BBI crosses above Group B BBI, indicating short-term trend becoming stronger than long-term trend
- Exit positions when Group A BBI crosses below Group B BBI, indicating short-term trend weakening
Strategy Advantages
- Reduces false signals through the use of multiple moving average combinations
- Improves signal reliability by combining short-term and long-term trend analysis
- Simple and clear strategy logic, easy to understand and execute
- Good trend-following characteristics, capable of capturing significant trending movements
Strategy Risks
- May generate frequent crossover signals in ranging markets, leading to overtrading
- Entry and exit signals have inherent lag, potentially missing optimal prices
- Lacks risk control measures such as stop-loss and take-profit settings
- May experience significant drawdowns in highly volatile markets
Strategy Optimization Directions
- Add trend confirmation indicators like RSI or MACD to filter false signals
- Implement stop-loss and take-profit mechanisms to control single-trade risk
- Optimize BBI period parameters based on different market characteristics
- Consider incorporating volume indicators to improve signal reliability
- Add volatility filters to reduce trading frequency during high volatility periods
Summary
This strategy captures market trends by comparing BBI indicators with different periods, featuring clear logic and easy execution. However, it needs additional risk control measures and parameter optimization for different market conditions to improve stability and reliability. It is recommended to conduct thorough backtesting and combine with other technical indicators before live trading.
/*backtest
start: 2019-12-23 08:00:00
end: 2024-12-10 08:00:00
period: 1d
basePeriod: 1d
exchanges: [{"eid":"Futures_Binance","currency":"BTC_USDT"}]
*/

// @version=6
strategy("BBI 多頭策略", overlay=true)

// 自訂參數設置
input_ma1_a = input(12, title="A組 MA1 週期")
input_ma2_a = input(24, title="A組 MA2 週期")
input_ma3_a = input(48, title="A組 MA3 週期")
input_ma4_a = input(80, title="A組 MA4 週期")
input_ma1_b = input(120, title="B組 MA1 週期")
input_ma2_b = input(240, title="B組 MA2 週期")
input_ma3_b = input(480, title="B組 MA3 週期")
input_ma4_b = input(600, title="B組 MA4 週期")

// 設定 A 組 BBI
ma1_a = ta.sma(close, input_ma1_a)
ma2_a = ta.sma(close, input_ma2_a)
ma3_a = ta.sma(close, input_ma3_a)
ma4_a = ta.sma(close, input_ma4_a)
bbi_a = (ma1_a + ma2_a + ma3_a + ma4_a) / 4

// 設定 B 組 BBI
ma1_b = ta.sma(close, input_ma1_b)
ma2_b = ta.sma(close, input_ma2_b)
ma3_b = ta.sma(close, input_ma3_b)
ma4_b = ta.sma(close, input_ma4_b)
bbi_b = (ma1_b + ma2_b + ma3_b + ma4_b) / 4

// 當 A 組 BBI 上穿 B 組 BBI 時,執行做多策略
long_condition = ta.crossover(bbi_a, bbi_b)
if (long_condition)
    strategy.entry("Long", strategy.long)

// 當 A 組 BBI 下穿 B 組 BBI 時,平倉
close_condition = ta.crossunder(bbi_a, bbi_b)
if (close_condition)
    strategy.close("Long")

// 繪製 BBI 指標
plot(bbi_a, color=color.blue, title="BBI A")
plot(bbi_b, color=color.red, title="BBI B")