Aperçu
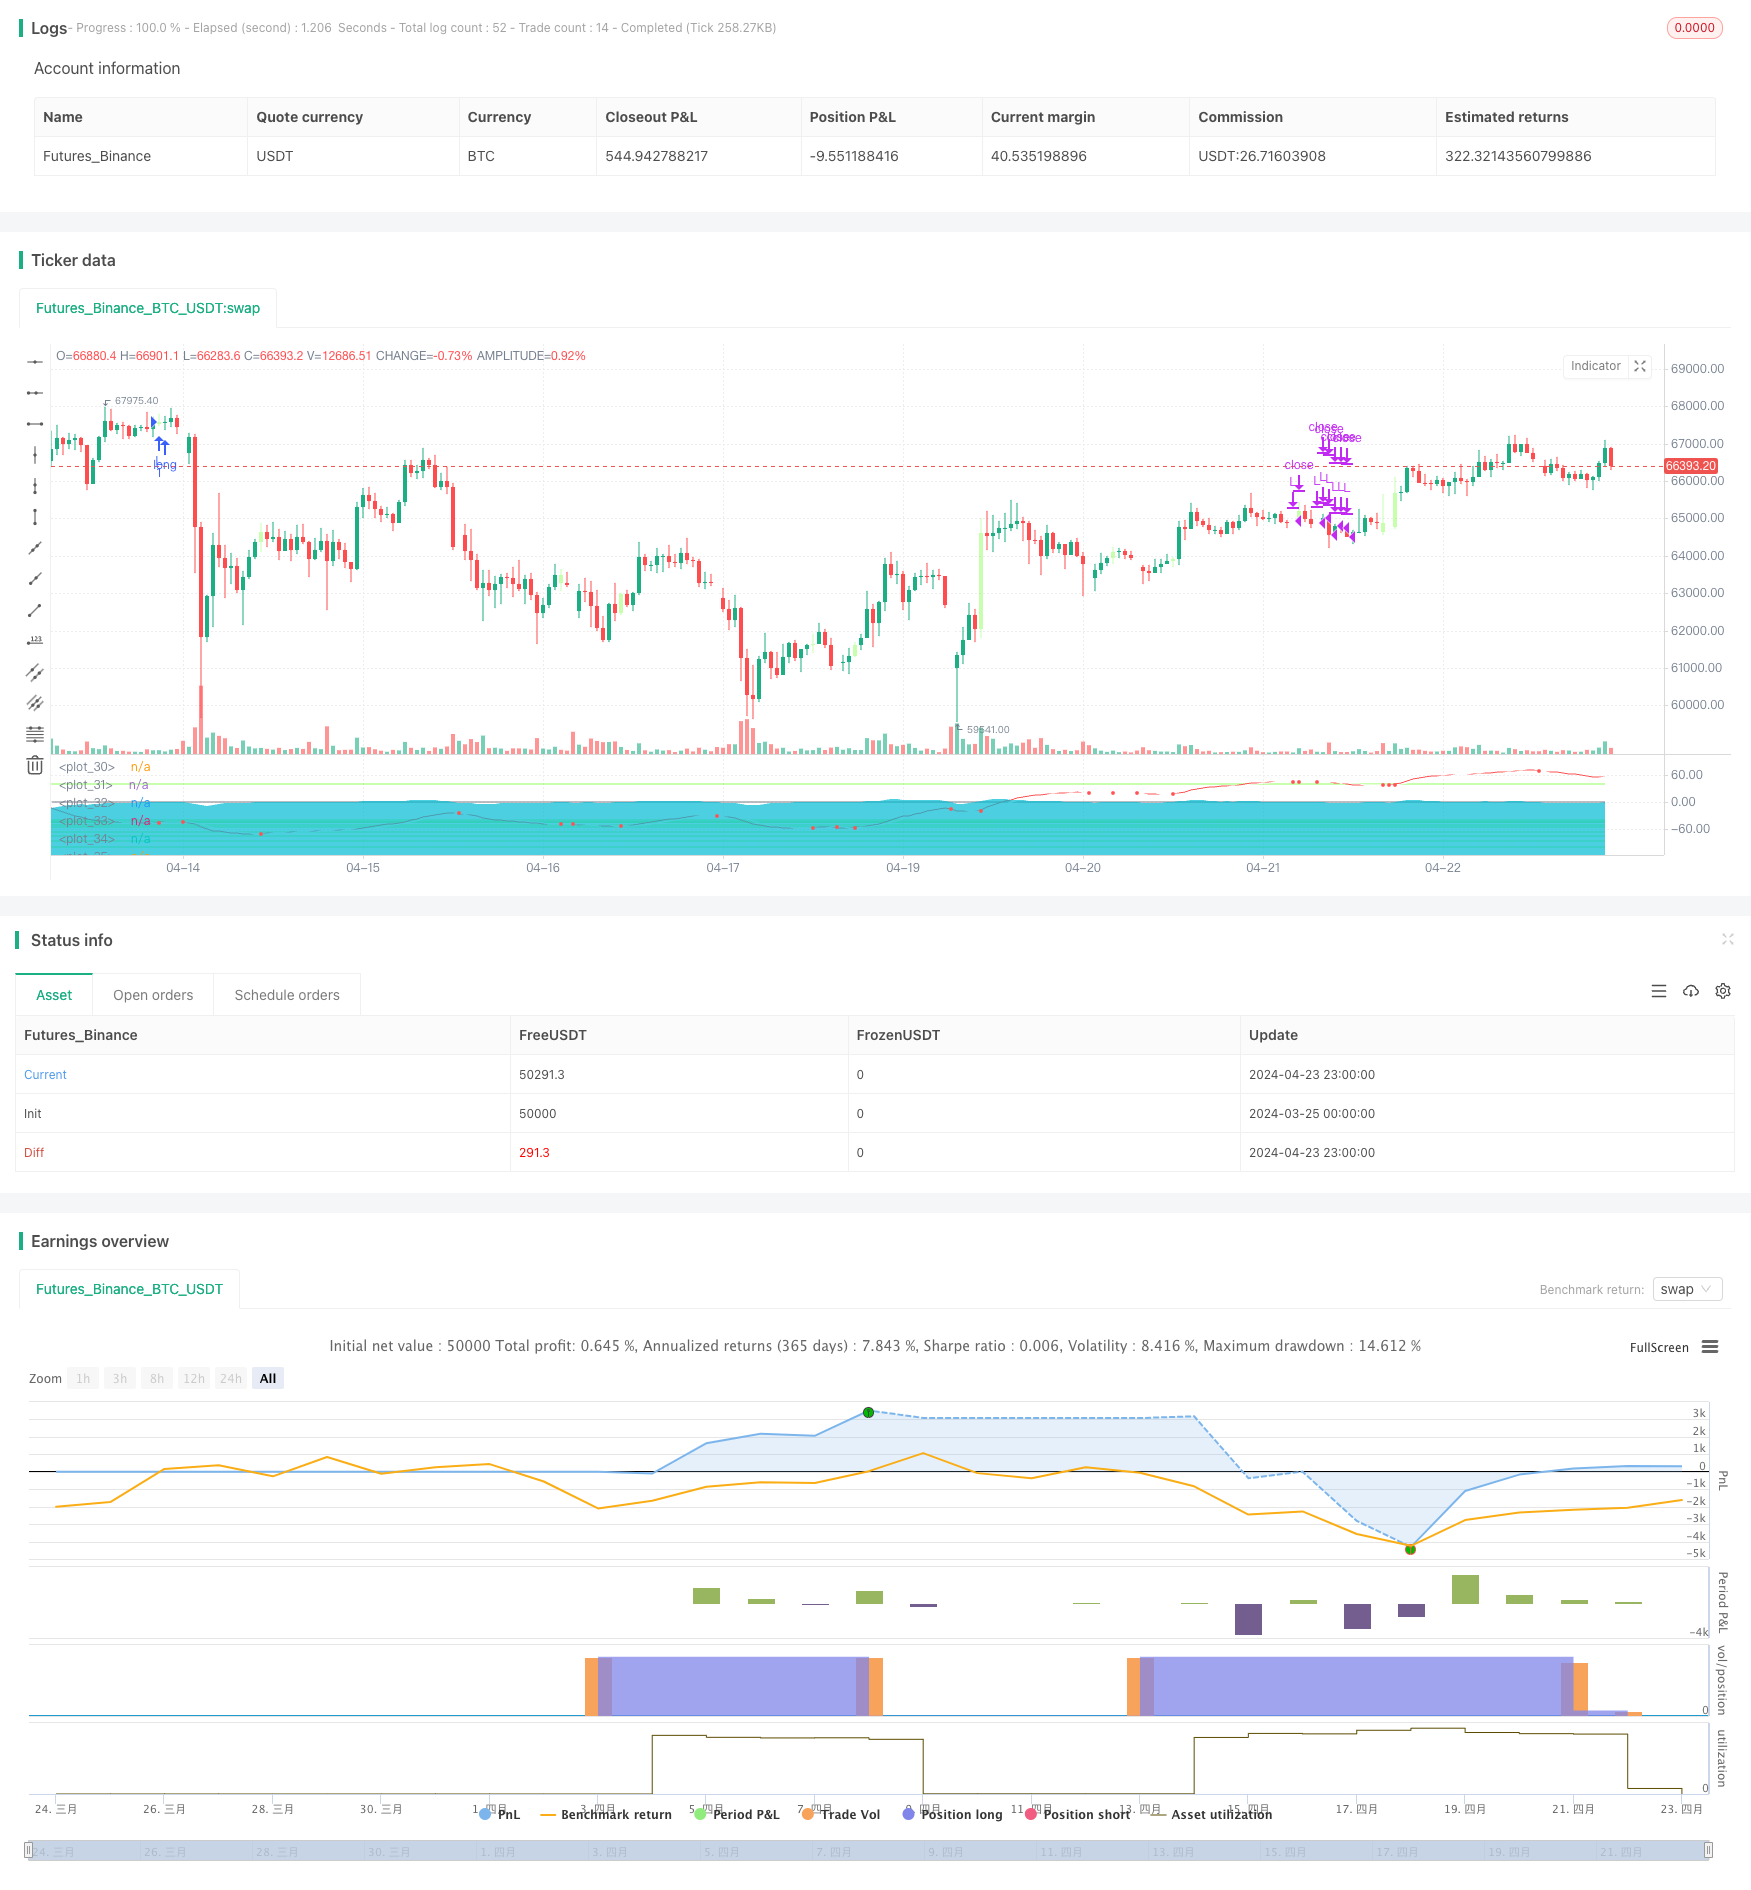
La stratégie est basée sur l’indicateur Wavetrend, qui établit des positions multiples lorsque les prix touchent ces niveaux en définissant plusieurs niveaux de survente et de survente, et qui profite de la position de détente lorsque les prix rebondissent au-dessus des niveaux de survente. Il s’agit d’une stratégie de négociation en grille qui vise à capturer les mouvements de rebond et de rebond supérieurs au marché. Elle s’applique au cycle de 15 minutes des monnaies numériques telles que Bitcoin et Solana.
Principe de stratégie
- Calculer les deux lignes de l’indicateur Wavetrend, l’une pour la valeur brute ((wt1)) et l’autre pour la valeur lisse ((wt2)).
- Configurez plusieurs niveaux de survente (oslevel1 à 8) et de survente (Oblevel1 à 5).
- Lorsque wt1 et wt2 sont à la fois au-dessous d’un certain niveau de survente et que wt1 est au-dessus de wt2, la position plurielle est ouverte. Plus le niveau est bas, plus la position est radicale.
- Lorsque wt1 et wt2 sont à la fois supérieurs au niveau de surachat 1 et que wt1 est en dessous de wt2, les positions multiples de 70% sont effacées.
- Répétez les étapes 3 et 4 pour construire un système de transaction en grille.
Avantages stratégiques
- Capture d’une tendance de rebond sur une baisse: en définissant plusieurs niveaux de survente, ouvrez une position après une forte baisse de prix et tirez profit d’une reprise.
- Construction de lots, contrôle des risques: Selon le niveau de vente par lots, plus le niveau est bas, plus le poids des positions est lourd, il est possible de mieux contrôler les risques.
- Arrêt automatique: les positions sont automatiquement effacées lorsque le prix rebondit dans la zone de survente, bloquant ainsi les bénéfices.
- Les paramètres sont flexibles: les niveaux de survente et de survente peuvent être ajustés en fonction des caractéristiques du marché et des préférences personnelles, pour s’adapter à différentes variétés et périodes de transactions.
Risque stratégique
- Risque de dépréciation: si les prix continuent à baisser, cela déclenchera de plus en plus de signaux de survente et pourrait entraîner la clôture des positions.
- Risque de choc: si les prix se déplacent de façon répétée dans les zones de survente, cela peut entraîner plusieurs ouvertures de positions sans pouvoir les arrêter, ce qui affaiblit l’efficacité de la stratégie.
- Risque paramétrique: les paramètres différents ont une grande influence sur la performance de la stratégie et doivent être optimisés en fonction des retours d’expérience et de l’expérience, sinon des pertes peuvent en résulter.
Orientation de l’optimisation de la stratégie
- Ajouter un filtre de tendance: avant d’ouvrir une position, déterminez si la tendance à grande échelle est à la hausse et évitez d’ouvrir une position dans une tendance à la baisse.
- Optimisation de la gestion des positions: Ajustez la taille des positions d’ouverture en fonction de la distance entre le prix et le niveau de survente, plus les positions sont éloignées.
- Stop-loss dynamique: le niveau de stop-loss est ajusté dynamiquement en fonction du ratio de gain et de perte de la position, plutôt que d’un taux de plafonnement fixe.
- Ajout d’un stop loss: définir un stop loss fixe ou suivi, contrôlant la perte maximale d’une seule transaction.
Résumer
La stratégie de trading sur la grille de rebond Wavetrend est une stratégie quantitative basée sur des signaux de survente et d’achat, qui tente de capturer les tendances de rebond après les surtensions en créant des positions par lots et des arrêts automatiques, afin de profiter des marges de profit. L’avantage de cette stratégie réside dans sa capacité d’adaptation et sa flexibilité pour ajuster les paramètres, mais il existe également un risque de baisse continue du marché, de paramètres mal configurés.
/*backtest
start: 2024-03-25 00:00:00
end: 2024-04-24 00:00:00
period: 1h
basePeriod: 15m
exchanges: [{"eid":"Futures_Binance","currency":"BTC_USDT"}]
*/

//@version=5
// © And Isaac, all rights reserved. If there is any piracy, please call the police immediately.

strategy(title='wavetrend',shorttitle='DCA-High win rate quantitative trading')
n1 = input(40,'channel length')
n2 = input(60,'average length')
Oblevel1 = input(40,'over bought level 1')
Oblevel2 = input(50,'over bought level 1')
Oblevel3 = input(70,'over bought level 1')
Oblevel4 = input(80,'over bought level 1')
Oblevel5 = input(100,'over bought level 2')
oslevel1 = input(-40,'over sold level 1')
oslevel2 = input(-45,'over sold level 1')
oslevel3 = input(-50,'over sold level 1')
oslevel4 = input(-55,'over sold level 1')
oslevel5 = input(-65,'over sold level 1')
oslevel6 = input(-75,'over sold level 1')
oslevel7 = input(-85,'over sold level 1')
oslevel8 = input(-100,'over sold level 2')

ap = input(title="source",defval=hlc3)
esa =ta.ema(ap, n1)
d =ta.ema(math.abs(ap - esa),n1)
ci = (ap - esa)/ (0.015 * d)
tci = ta.ema(ci,n2)

wt1 = tci
wt2 = ta.sma(wt1, 4)

plot(0,color=color.new(#787b86, 0 ))
plot(Oblevel1, color=color.new(#89ff52, 53), linewidth = 2)
plot(oslevel1, color=color.new(#89ff52, 53), linewidth = 2)
plot(oslevel2, color=color.new(#89ff52, 53), linewidth = 2)
plot(oslevel3, color=color.new(#89ff52, 53), linewidth = 2)
plot(oslevel4, color=color.new(#89ff52, 53), linewidth = 2)
plot(oslevel5, color=color.new(#89ff52, 53), linewidth = 2)
plot(oslevel6, color=color.new(#89ff52, 53), linewidth = 2)
plot(oslevel7, color=color.new(#89ff52, 53), linewidth = 2)
plot(oslevel8, color=color.new(#89ff52, 53), linewidth = 2)
plot(oslevel2, color=color.new(#89ff52, 53), linewidth = 2)
plot(wt1, color=color.new(#ff5252,0))
plot(wt2, color=color.new(#ffffff,0))
plot(wt1 - wt2, color=color.new(#00bcd4, 30),style=plot.style_area)

plot(ta.cross(wt1, wt2) ? wt2 : na, color=color.new(#ff5252,0) , style=plot.style_circles, linewidth=4 )

// barcolor(cross(wt1, wt2) ? (wt2 - wt1 > 0 ? aqua : yellow) : na)
barcolor(ta.cross(wt1, wt2) ? (wt2 - wt1 > 0 ? color.new(#ffffff,0) : color.new(#89ff52, 53)) : na)

/////////////
Long1 = wt2 < oslevel1 and wt1 < oslevel1 and wt1>wt2 and wt2 > oslevel3 and wt1>oslevel3
Long5 = wt2 < oslevel5 and wt1 < oslevel5 and wt1>wt2 and wt2 > oslevel6 and wt1>oslevel6

Long7 = wt2 < oslevel7 and wt1 < oslevel7 and wt1>wt2 and wt2 > oslevel8 and wt1>oslevel8
Long8 = wt2 < oslevel8 and wt1 < oslevel8 and wt1>wt2
LS1 = wt2 > Oblevel1 and wt1 > Oblevel1 and wt1<wt2


if Long1
    strategy.entry("L",strategy.long,comment = "做多1")


if Long5
    strategy.entry("L",strategy.long,comment = "做5")

if Long7
    strategy.entry("L",strategy.long,comment = "做多7")
if Long8
    strategy.entry("L",strategy.long,comment = "做多8")
if LS1
    strategy.close("L", qty_percent = 70,comment = "平多")