基于MACD信号线交叉与ATR风险管理的优化趋势跟踪策略
Author: ChaoZhang, Date: 2024-04-18 17:15:00Tags: MACDATR
概述
该策略是一个基于MACD信号线交叉的自动化比特币交易策略。它利用MACD指标来识别趋势的变化,并根据ATR(平均真实波动范围)来设置止损和止盈水平,以管理每笔交易的风险。该策略旨在捕捉强劲的上升趋势,同时通过动态止损和止盈水平来控制风险。
策略原理
该策略的核心是MACD指标,它由两条移动平均线(快线和慢线)之间的差值计算得出。当MACD线从下向上穿过信号线,并且MACD线在零线下方时,就会产生买入信号。这表明股价可能正在转向上升趋势。一旦确认买入信号,该策略就会以当前收盘价进行做多交易。
止损和止盈水平是根据ATR计算得出的。ATR衡量了一段时间内的平均价格波动范围。通过将ATR乘以特定的倍数,可以得到动态的止损和止盈水平。这有助于根据最近的市场波动情况调整这些水平。
策略优势
趋势跟踪:该策略利用MACD指标来识别潜在的趋势变化,使其能够捕捉强劲的上升趋势。
风险管理:通过基于ATR的动态止损和止盈水平,该策略能够管理每笔交易的风险。这有助于限制潜在损失,同时让利润在有利趋势中不断增长。
参数优化:该策略的输入参数(如MACD的长度和ATR的倍数)可以进行优化,以适应不同的市场条件和交易风格。
策略风险
错误信号:MACD指标有时可能产生错误的交易信号,导致无利可图的交易。
趋势逆转:该策略在趋势发生逆转时可能面临风险。如果价格突然反转,止损水平可能无法提供足够的保护。
缺乏多样性:该策略仅依赖于MACD指标和ATR。在某些市场条件下,这可能不足以做出明智的交易决定。
策略优化方向
结合其他指标:考虑将其他技术指标(如RSI或移动平均线)纳入策略,以提高信号的可靠性。
优化参数:使用历史数据对MACD的长度、ATR的倍数和风险百分比等输入参数进行优化,以找到最佳的参数组合。
加入仓位管理:实施更高级的仓位管理方法,根据市场条件和账户余额调整每笔交易的仓位大小。
总结
该优化的MACD趋势跟踪策略展示了如何将动量指标与风险管理技术相结合,以在加密货币市场中进行交易。通过利用MACD信号线交叉来识别潜在的趋势变化,并使用基于ATR的动态止损和止盈水平来管理风险,该策略旨在捕捉有利的价格走势,同时将损失降至最低。然而,在实施该策略之前,还需要进一步的回测、优化和风险评估。
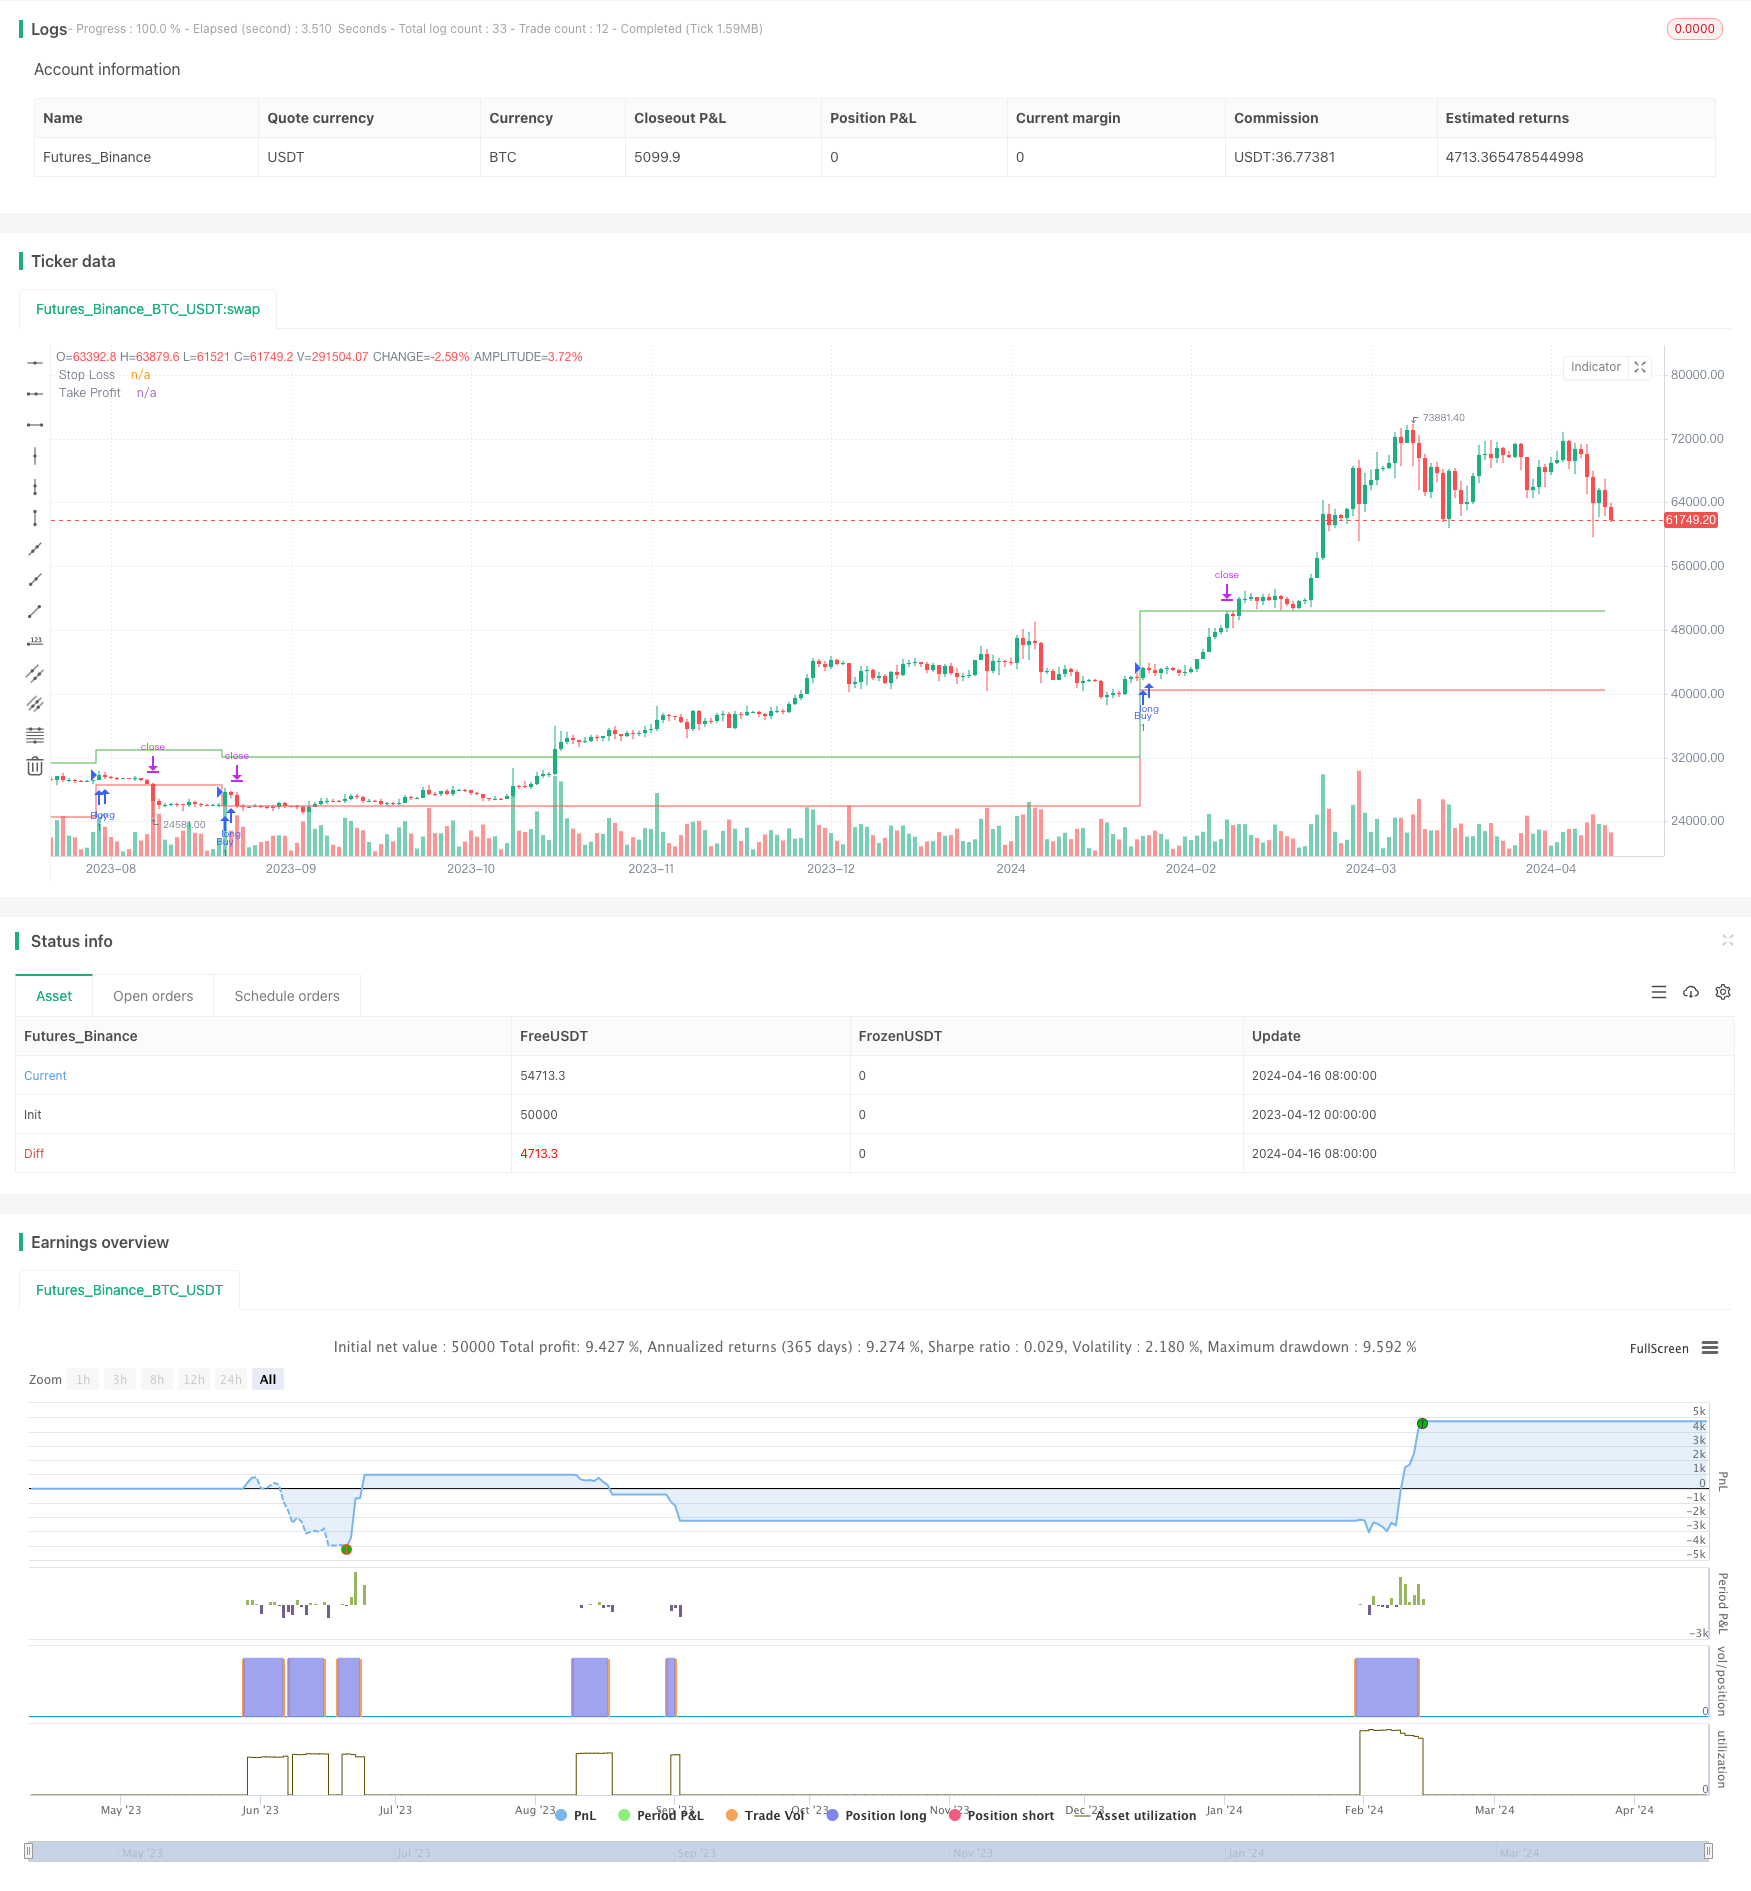
/*backtest
start: 2023-04-12 00:00:00
end: 2024-04-17 00:00:00
period: 1d
basePeriod: 1h
exchanges: [{"eid":"Futures_Binance","currency":"BTC_USDT"}]
*/

//@version=5
strategy("Optimized MACD Trend-Following Strategy with Risk Management", shorttitle="Opt. MACD RM", overlay=true)

// Input parameters
fastLength = input(12)
slowLength = input(26)
signalSmoothing = input(9)
riskPercent = input.float(2, title="Risk Percentage (%)") / 100 // 2% risk per trade
atrMultiplierSL = input.float(2, title="ATR Multiplier for Stop Loss")
atrMultiplierTP = input.float(5, title="ATR Multiplier for Take Profit")

// Calculate ATR for 5-minute timeframe
atr5 = ta.atr(5)

// Calculate stop loss and take profit levels based on ATR
stopLoss = atr5 * atrMultiplierSL
takeProfit = atr5 * atrMultiplierTP

// Initialize trade variables
var float entryPrice = na
var float stopLossPrice = na
var float takeProfitPrice = na

// Calculate MACD
[macdLine, signalLine, _] = ta.macd(close, fastLength, slowLength, signalSmoothing)

// Buy signal
buySignal = ta.crossover(macdLine, signalLine) and macdLine < 0 and not na(close[1]) and close > open

// Long entry
if buySignal and strategy.opentrades == 0
    entryPrice := close
    stopLossPrice := close - stopLoss
    takeProfitPrice := close + takeProfit
    strategy.entry("Buy", strategy.long)
    strategy.exit("Stop Loss/TP", "Buy", stop=stopLossPrice, limit=takeProfitPrice)

// Plot stop loss and take profit levels
plot(entryPrice > 0 ? stopLossPrice : na, color=color.red, style=plot.style_stepline, title="Stop Loss")
plot(entryPrice > 0 ? takeProfitPrice : na, color=color.green, style=plot.style_stepline, title="Take Profit")
- MACD与限制性马丁格尔相结合的高级策略
- 双重MACD价格行为突破追踪策略
- H1趋势偏差+M15 MACD信号+M5快速波动率缺口策略
- 基于MACD与Supertrend的双重验证趋势跟踪交易策略
- EMA-MACD高频量化策略与智能风控系统
- EMA MACD 动量跟踪策略
- 多指标趋势追踪策略
- 趋势跟随与动量过滤相结合的交易策略
- 多指标趋势追踪策略结合布林带和 ATR 动态止损
- 逆向波动率突破策略
- 移动平均线交叉多层获利策略
- MACD金叉死叉策略
- MACD-V和斐波那契多时间框架动态止盈策略
- 趋势捕捉策略
- 滑动平均线和布林带量化交易策略
- 布林带突破策略
- 双时间尺度动量策略
- MACD BB 波段突破策略
- Wavetrend 大幅指标超跌反弹网格交易策略
- MACD 交叉策略
- ZeroLag MACD 多空策略
- Bollinger Bands Stochastic RSI Extreme Strategy
- 基于动量RSI指标的高频反转交易策略
- RSI 相对强弱指数策略
- 布林线突破策略
- 唐奇安通道和拉里威廉斯大交易指数策略
- SPARK动态仓位与双重指标交易策略
- 均线交叉+MACD慢线动量策略
- 交易量动态调整DCA策略
- MACD Valley Detector 策略