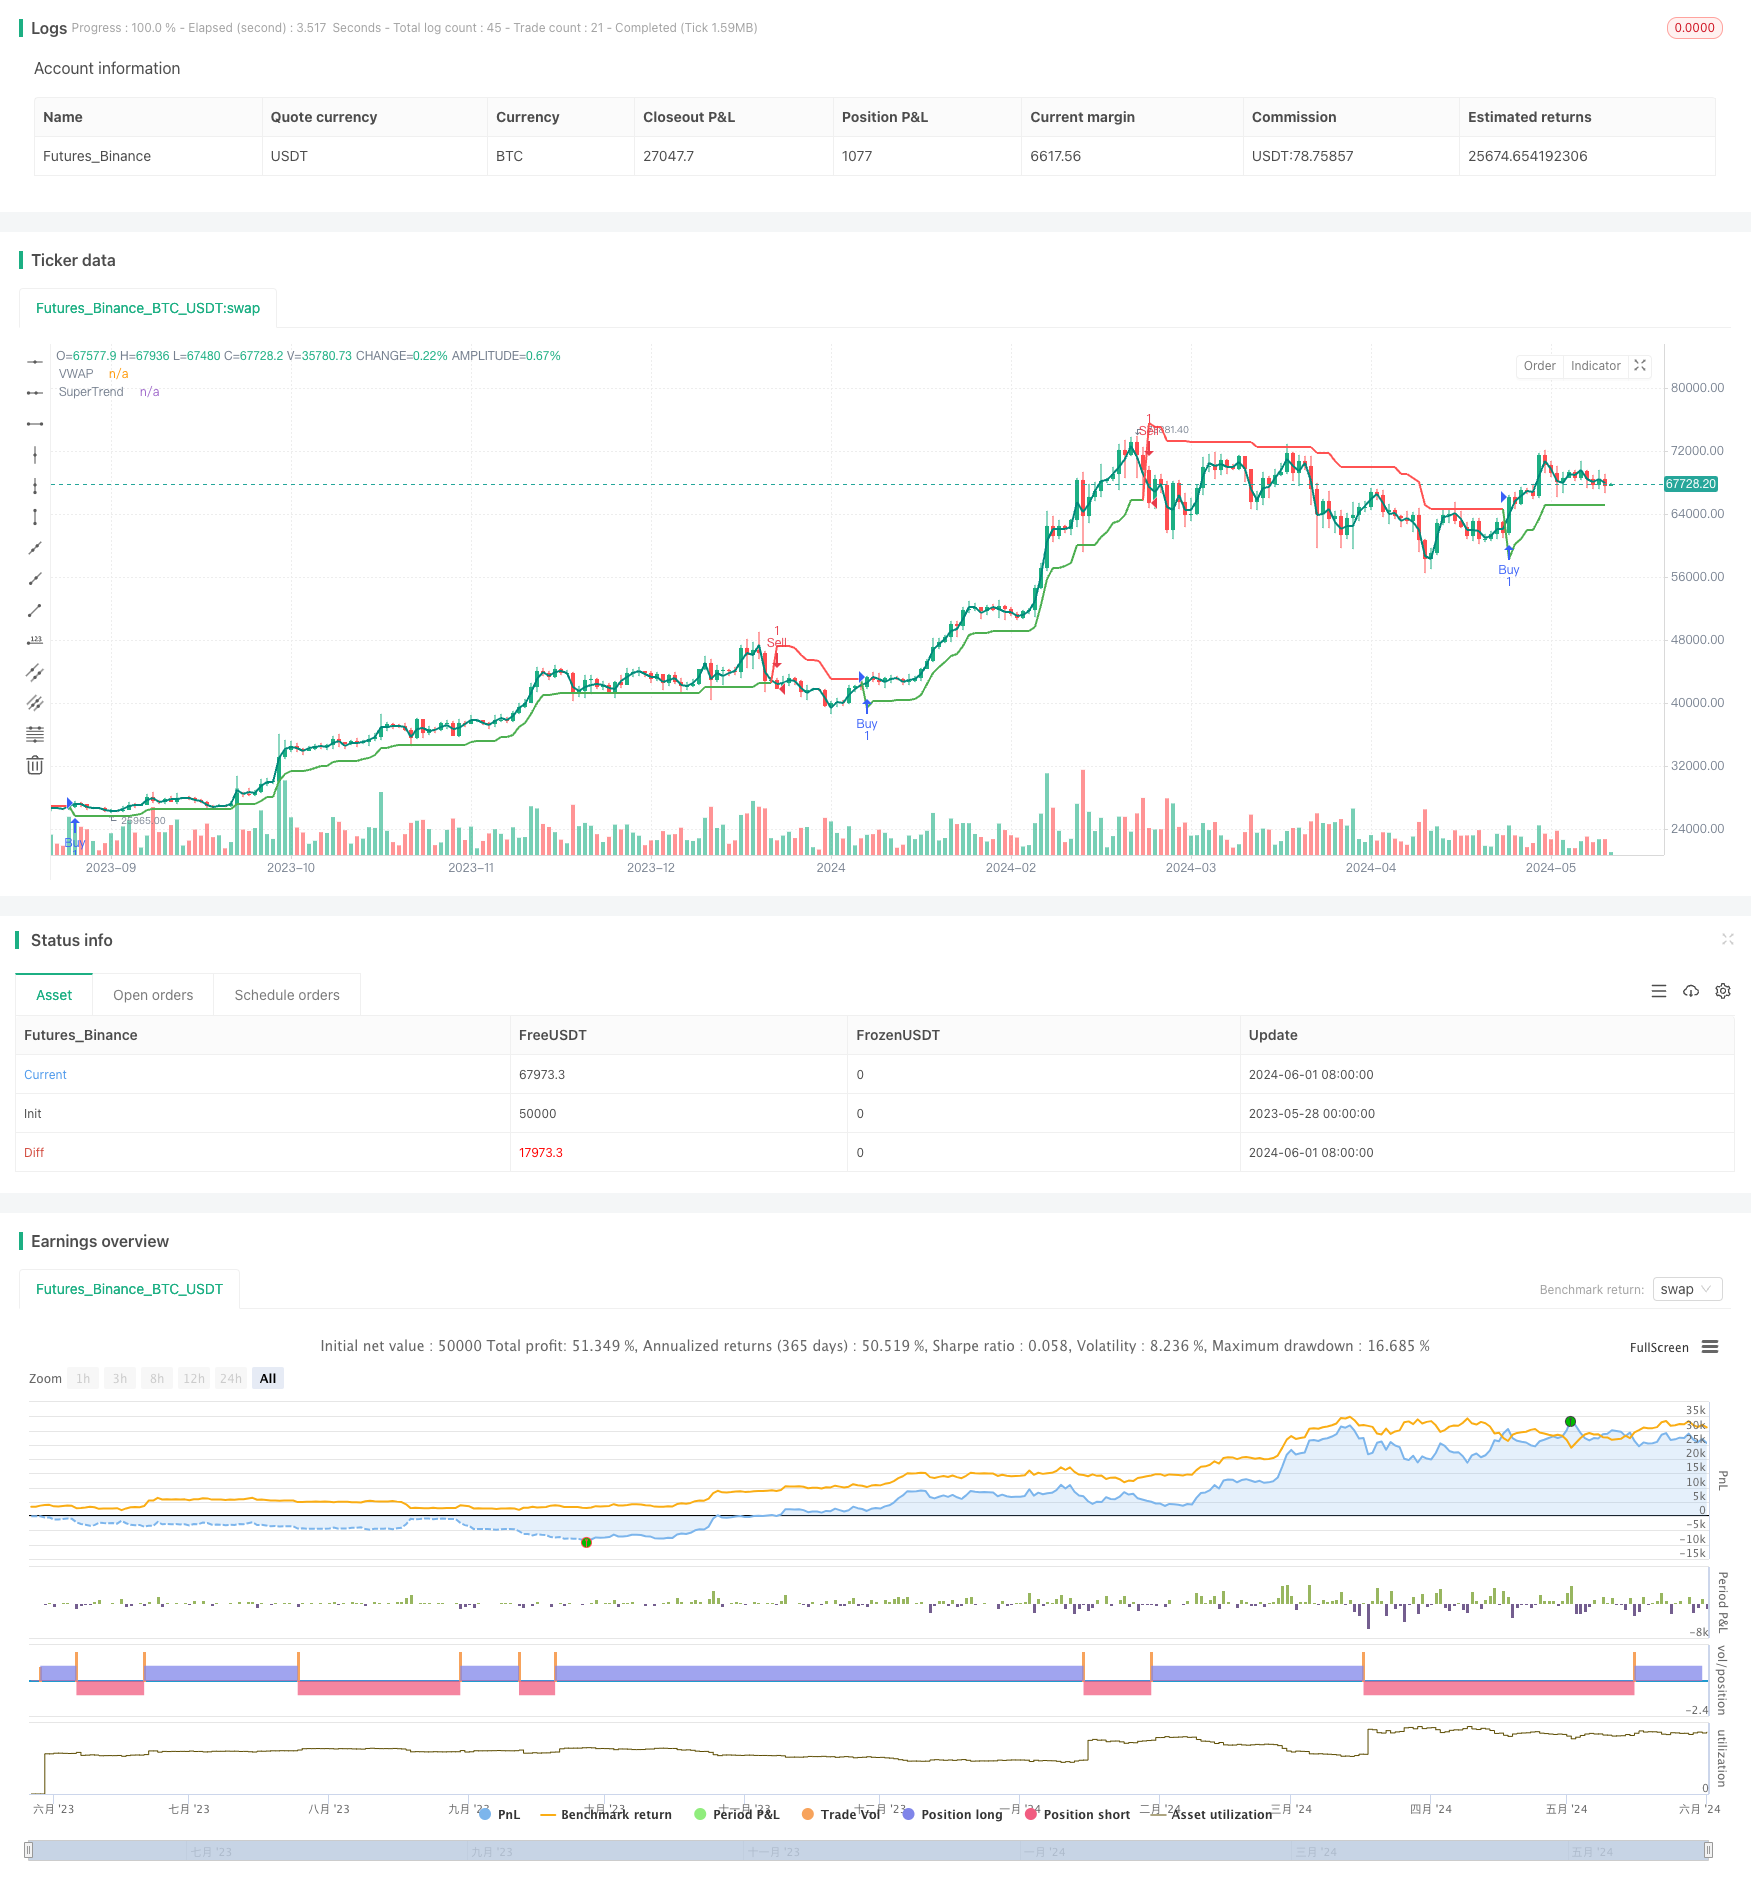
VWAP dan Super Trend Strategi Beli/Jual
Penulis:ChaoZhang, Tanggal: 2024-06-03 10:45:14Tag:VWAPATR

Gambaran umum
Strategi ini menggabungkan indikator VWAP (Volume Weighted Average Price) dan Supertrend. Ini menentukan sinyal beli dan jual dengan membandingkan posisi harga relatif terhadap VWAP dan arah indikator Supertrend. Sinyal beli dihasilkan ketika harga melintasi di atas VWAP dan Supertrend positif, sementara sinyal jual dihasilkan ketika harga melintasi di bawah VWAP dan Supertrend negatif. Strategi ini juga menghindari menghasilkan sinyal duplikat dengan merekam keadaan sinyal sebelumnya sampai sinyal sebaliknya muncul.
Prinsip Strategi
- Menghitung indikator VWAP menggunakan fungsi ta.vwap, dengan panjang VWAP yang dapat disesuaikan.
- Menghitung indikator Supertrend menggunakan fungsi ta.supertrend, dengan periode ATR dan pengganda yang dapat disesuaikan.
- Tentukan kondisi beli: harga saat ini melintasi di atas VWAP dan arah Supertrend positif.
- Tentukan kondisi jual: harga saat ini melintasi di bawah VWAP dan arah Supertrend negatif.
- Mencatat keadaan sinyal sebelumnya untuk menghindari sinyal berturut-turut ke arah yang sama.
Keuntungan Strategi
- Menggabungkan indikator VWAP dan Supertrend untuk penilaian yang lebih komprehensif tentang tren pasar dan titik balik potensial.
- Indikator VWAP mempertimbangkan volume, yang lebih mencerminkan pergerakan pasar yang sebenarnya.
- Indikator Supertrend memiliki karakteristik mengikuti tren dan menyaring osilasi, membantu menangkap tren utama.
- Mekanisme untuk menghindari sinyal duplikat mengurangi frekuensi perdagangan dan menurunkan biaya transaksi.
Risiko Strategi
- Selama periode volatilitas pasar yang tinggi atau tren yang tidak jelas, strategi dapat menghasilkan lebih banyak sinyal palsu.
- Kinerja strategi tergantung pada pilihan parameter VWAP dan Supertrend; pengaturan yang berbeda dapat menghasilkan hasil yang berbeda.
- Strategi ini tidak memasukkan manajemen risiko dan ukuran posisi, yang perlu dikombinasikan dengan langkah-langkah lain untuk mengendalikan risiko dalam aplikasi praktis.
Arah Optimasi Strategi
- Memperkenalkan mekanisme konfirmasi tren, seperti menggunakan rata-rata bergerak atau indikator tren lainnya, untuk lebih menyaring sinyal.
- Mengoptimalkan pemilihan parameter dengan melakukan backtesting data historis untuk menemukan kombinasi terbaik dari panjang VWAP, periode ATR, dan pengganda.
- Menerapkan langkah-langkah manajemen risiko, seperti stop-loss dan take-profit, untuk mengendalikan risiko perdagangan individu.
- Pertimbangkan untuk memasukkan strategi manajemen uang, seperti pecahan tetap atau Kriteria Kelly, untuk mengoptimalkan ukuran posisi.
Ringkasan
Strategi VWAP dan Supertrend Buy/Sell bertujuan untuk menangkap secara komprehensif tren pasar dan titik balik potensial dengan menggabungkan dua jenis indikator yang berbeda. Logika strategi jelas dan mudah diimplementasikan dan dioptimalkan. Namun, kinerja strategi tergantung pada pemilihan parameter dan tidak memiliki langkah-langkah manajemen risiko. Dalam aplikasi praktis, optimasi dan penyempurnaan lebih lanjut diperlukan untuk beradaptasi dengan kondisi pasar dan persyaratan perdagangan yang berbeda.
/*backtest
start: 2023-05-28 00:00:00
end: 2024-06-02 00:00:00
period: 1d
basePeriod: 1h
exchanges: [{"eid":"Futures_Binance","currency":"BTC_USDT"}]
*/

//@version=5
strategy(title="VWAP and Super Trend Buy/Sell Strategy", shorttitle="VWAPST", overlay=true)


//===== VWAP =====
showVWAP = input.bool(title="Show VWAP", defval=true, group="VWAP")
VWAPSource = input.source(title="VWAP Source", defval=hl2, group="VWAP")
VWAPrice = ta.vwap(VWAPSource)
plot(showVWAP ? VWAPrice : na, color=color.teal, title="VWAP", linewidth=2)


//===== Super Trend =====
showST = input.bool(true, "Show SuperTrend Indicator", group="Super Trend")
Period = input.int(title="ATR Period", defval=10, group="Super Trend")
Multiplier = input.float(title="ATR Multiplier", defval=2.0, group="Super Trend")


// Super Trend ATR
Up = hl2 - (Multiplier * ta.atr(Period))
Dn = hl2 + (Multiplier * ta.atr(Period))
var float TUp = na
var float TDown = na
TUp := na(TUp[1]) ? Up : close[1] > TUp[1] ? math.max(Up, TUp[1]) : Up
TDown := na(TDown[1]) ? Dn : close[1] < TDown[1] ? math.min(Dn, TDown[1]) : Dn
var int Trend = na
Trend := na(Trend[1]) ? 1 : close > TDown[1] ? 1 : close < TUp[1] ? -1 : Trend[1]


Tsl = Trend == 1 ? TUp : TDown
linecolor = Trend == 1 ? color.green : color.red
plot(showST ? Tsl : na, color=linecolor, style=plot.style_line, linewidth=2, title="SuperTrend")


// Buy/Sell Conditions
var bool previousBuysignal = false
var bool previousSellsignal = false


buysignal = not previousBuysignal and Trend == 1 and close > VWAPrice
sellsignal = not previousSellsignal and Trend == -1 and close < VWAPrice


// Ensure the signals are not repetitive
if (buysignal)
    previousBuysignal := true
    previousSellsignal := false
else if (sellsignal)
    previousBuysignal := false
    previousSellsignal := true


// Execute buy and sell orders
if (buysignal)
    strategy.entry("Buy", strategy.long)
if (sellsignal)
    strategy.entry("Sell", strategy.short)


// Plot Buy/Sell Labels
//plotshape(buysignal, title="Buy Signal", location=location.belowbar, color=color.green, style=shape.labelup, text="BUY", textcolor=color.white, size=size.normal)
//plotshape(sellsignal, title="Sell Signal", location=location.abovebar, color=color.red, style=shape.labeldown, text="SELL", textcolor=color.white, size=size.normal)
- VWAP-ATR Sistem Perdagangan Aksi Harga Dinamis
- VWAP-ATR Mengikuti Tren dan Strategi Pembalikan Harga
- VWAP dan RSI Dynamic Bollinger Bands Take Profit dan Stop Loss Strategi
- Big Red Candle Breakout Strategi Beli
- Strategi Perdagangan Teknis untuk BTC Bagan 15 Menit
- Strategi crossover rata-rata bergerak multi-indikator frekuensi tinggi
- Strategi Trading Rata-rata Bergerak Cerdas Penembusan Tren Multi-Filter
- Tren Komposit Multi-Indikator Mengikuti Strategi
- Tren Dinamis Mengikuti Strategi
- SUPERTREND Posisi Long yang mengikuti tren dengan strategi Stop-loss dan Take-profit
- RSI dan Strategi Perdagangan Saluran Regresi Linear
- Double Vegas Channel Volatility-Adjusted SuperTrend Strategi Perdagangan Kuantitatif
- EMA RSI Crossover Strategi
- Moving Average Convergence Momentum Cloud Strategi
- Dual Moving Average Crossover Stop Loss dan Take Profit Strategi
- Strategi TEMA Dual Moving Average Crossover
- Trend SMA Multi-Timeframe Mengikuti Strategi dengan Stop Loss Dinamis
- Bollinger Bands Akurat Entry Dan Strategi Pengendalian Risiko
- Bollinger Bands + RSI + Strategi RSI Stochastic Berdasarkan Indikator Volatilitas dan Momentum
- Turtle-ATR Bollinger Bands Breakout Strategi
- Strategi MACD Lanjutan dengan Martingale Terbatas
- Keltner Channels EMA Strategi ATR
- MA MACD BB Multi-Indikator Trading Strategy Backtesting Tool
- RSI+Supertrend Strategi Trading Mengikuti Tren
- Ichimoku Kumo Strategi Perdagangan
- Strategi Crossover Rata-rata Gerak Dinamis ATR Stop Loss and Take Profit
- EMA Trend Momentum Candlestick Pattern Strategi
- Strategi Deteksi Tren G-Channel
- Moving Average Crossover dengan Strategi Stop Loss Trailing
- EMA Crossover Trading Strategy dengan Dynamic Take Profit dan Stop Loss