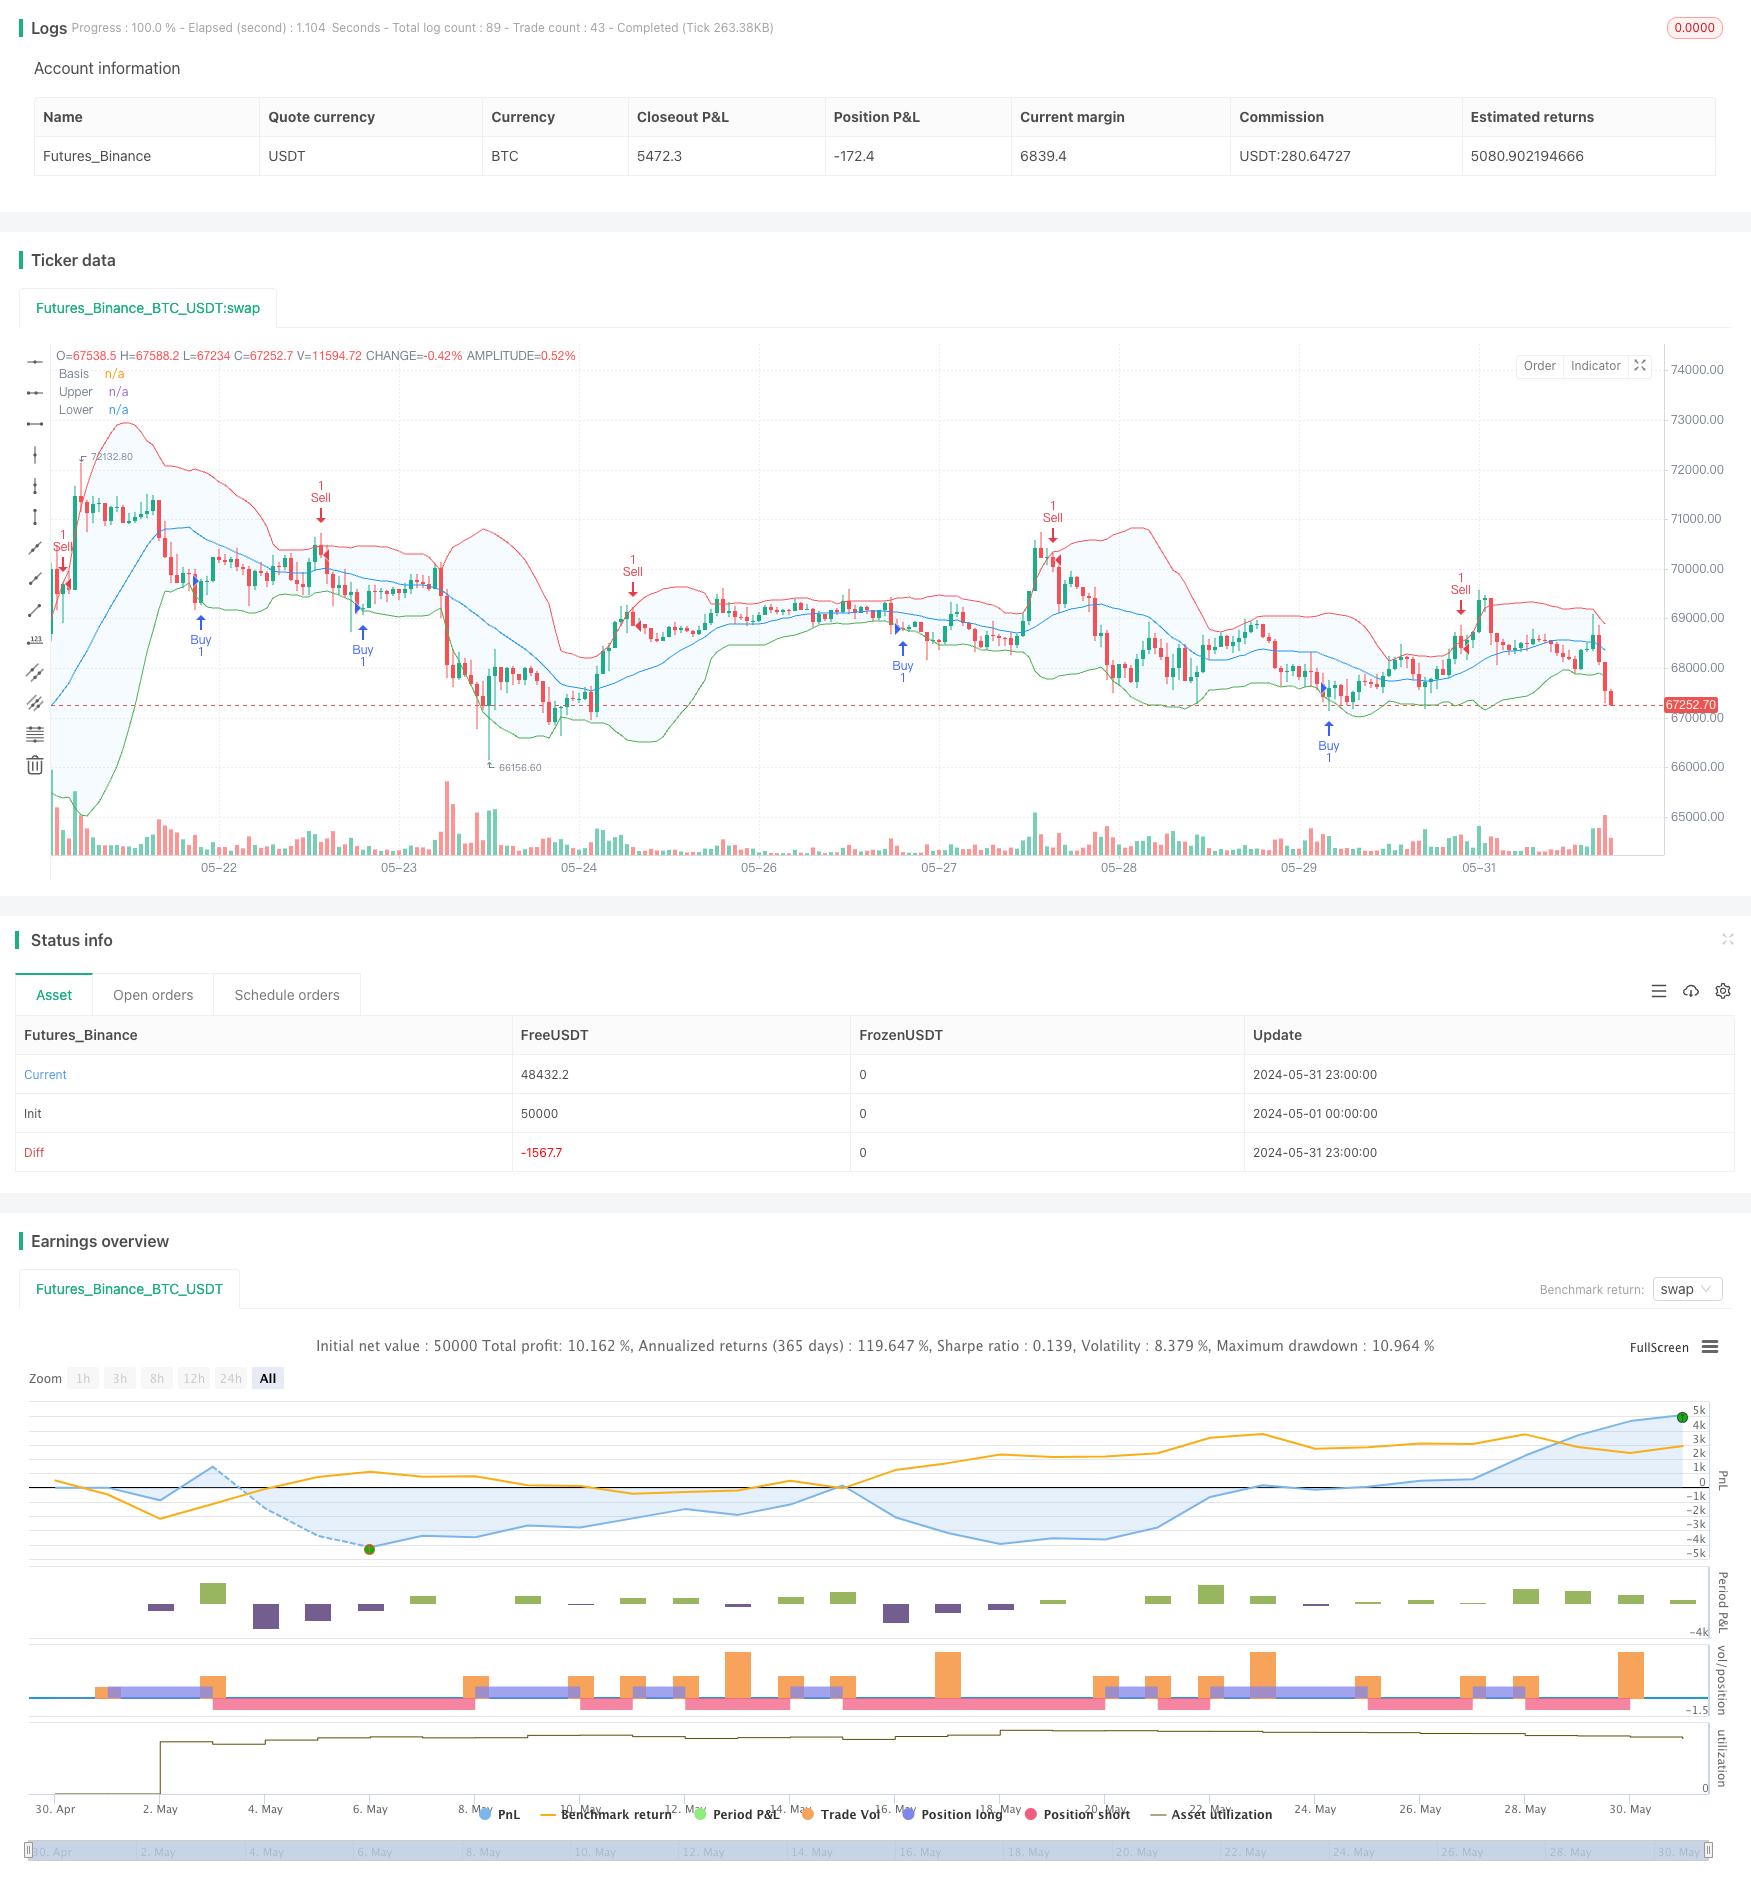
ボリンジャー帯と移動平均クロスオーバー戦略
作者: リン・ハーンチャオチャン,日付: 2024-06-07 14:52:49タグ:SMAエイマSMMARMAWMAVWMAマルチBB

概要
この戦略は,ボリンジャーバンドと移動平均線という2つの技術指標を組み合わせ,ボリンジャーバンドに対する価格の相対位置と,スピードとスロームービング平均線のクロスオーバーシグナルに基づいて市場動向を決定し,時宜の買い売りを実現する.価格がボリンジャーバンドの下帯を突破すると,ロングポジションを開く.上帯を突破すると,ショートポジションを開く.同時に,高速移動平均線がスロームービング平均線を突破すると,ロングポジションを開く,下帯を突破すると,ポジションを閉じる.この戦略は投資家に市場の動向を理解し,安定した投資収益を達成するのに役立ちます.
戦略原則
- ボリンジャー帯は,中帯,上帯,下帯という3つの線から構成される.中帯は移動平均線であり,上帯と下帯は標準偏差の一定倍数プラスまたはマイナスの中帯である.価格が上帯を突破すると,市場は過剰に購入され,引き下げを経験することがあり,下帯を突破すると,市場は過剰に販売され,リバウンドを経験することがありを示します.
- 急速移動平均と遅移動平均のクロスオーバーは,傾向を判断するために一般的に使用される方法でもあります.高速移動平均がスロー移動平均を上回ると,それは市場が強くなる可能性があることを示す"黄金十字"と呼ばれ,高速移動平均がスロー移動平均を下回ると,それは市場が弱くなる可能性があることを示す"死亡十字"と呼ばれます.
- この戦略は,ボリンジャーバンドを使用してオーバー購入およびオーバーセール条件を判断し,移動平均クロスオーバーを使用してトレンドを判断する.両者の組み合わせは比較的信頼できる取引信号を形成することができます.価格がボリンジャーバンドの下部バンドを突破し,急速移動平均がスロームービング平均を超えると,価格が上部バンドを突破するか,急速移動平均がスロームービング平均を下回るまで長く続きます.その時点でポジションを閉じる.
利点分析
- ボリンジャー帯は,価格変動の大きさに応じて適応的に調整することができ,変動の変化により敏感です.
- 移動平均のシステムは,市場の動向を効果的に追跡し,投資家が主要な動向方向を理解するのを助けます.
- ボリンジャーバンドと移動平均を組み合わせて,トレードシステムをフォローするブレイクアウト+トレンドを形成することで,取引頻度とコストを効果的に削減し,システムの安定性を向上させることができます.
- このコードは,移動平均の種類や期間などの複数のパラメータを設定し,異なる市場状況に柔軟に調整できます.
リスク分析
- 市場の変動が急激に増加すると ボリンジャー帯のチャネルは急激に拡大し,より多くのストップ・ロスは発生する可能性があります
- 移動平均値システムによる動向判断は遅れており,入出タイミングが不正確になる可能性があります.
- トレンドフォローする戦略は,一般的に範囲限定市場で機能し,他の方法と組み合わせて最適化する必要があります.
- 不適切なパラメータ設定は戦略の失敗を引き起こし,継続的な最適化とテストを必要とします.
最適化方向
- 移動平均のクロスオーバーに基づいて,MACDなどの他のトレンドインジケーターが追加され,トレンドシグナルをさらに確認できます.
- Bollinger Band のブレイクアウトは,引き下げリスクを制御するために ATR などのストップ・ロスの指標と組み合わせることができます.
- 傾向判断に基づいて,市場差異やパターン認識などの方法が追加され,傾向転換点を早期に判断できます.
- 異なる裏付け資産や期間に対して,適切なパラメータ組み合わせを見つけるためにパラメータを最適化する必要があります.
概要
ボリンジャーバンドと移動平均クロスオーバー戦略は,ボリンジャーバンドを使用して過買い・過売り状況と移動平均クロスオーバーを使用してトレンドを判断し,市場のトレンドを効果的に把握し,安定したリターンを達成できる古典的なトレンドフォロー戦略である.しかし,実用的な応用では,引き下げを制御し,パラメータを最適化し,変化する市場環境に適応するために他の方法と組み合わせて継続的に改善する必要があります.
/*backtest
start: 2024-05-01 00:00:00
end: 2024-05-31 23:59:59
period: 1h
basePeriod: 15m
exchanges: [{"eid":"Futures_Binance","currency":"BTC_USDT"}]
*/

//@version=5
strategy(shorttitle="BB Strategy", title="Bollinger Bands Strategy", overlay=true)

// Input parameters
length = input.int(20, minval=1)
maType = input.string("SMA", "Basis MA Type", options=["SMA", "EMA", "SMMA (RMA)", "WMA", "VWMA"])
src = input(close, title="Source")
mult = input.float(2.0, minval=0.001, maxval=50, title="StdDev")
offset = input.int(0, "Offset", minval=-500, maxval=500)

// Moving average function
ma(source, length, _type) =>
    switch _type
        "SMA" => ta.sma(source, length)
        "EMA" => ta.ema(source, length)
        "SMMA (RMA)" => ta.rma(source, length)
        "WMA" => ta.wma(source, length)
        "VWMA" => ta.vwma(source, length)

// Calculate Bollinger Bands
basis = ma(src, length, maType)
dev = mult * ta.stdev(src, length)
upper = basis + dev
lower = basis - dev

// Plot Bollinger Bands
plot(basis, "Basis", color=color.blue, offset=offset)
p1 = plot(upper, "Upper", color=color.red, offset=offset)
p2 = plot(lower, "Lower", color=color.green, offset=offset)
fill(p1, p2, title="Background", color=color.rgb(33, 150, 243, 95))

// Strategy entry and exit conditions
if (ta.crossover(close, lower))
    strategy.entry("Buy", strategy.long)

if (ta.crossunder(close, upper))
    strategy.entry("Sell", strategy.short)
関連性
- 変動フィルター付き戦略をフォローする多動平均クロスオーバートレンド
- 適応型移動平均のクロスオーバー戦略
- 多期移動平均のクロスオーバートレンド 戦略に従って
- 二重移動平均勢力の追跡量的な戦略
- RSIのダイバージェンスと移動平均を組み合わせた高度な定量取引戦略
- ダイナミック RSI スマートタイム スウィング トレーディング 戦略
- Bollinger Bands と ATR に基づく多レベルインテリジェント・ダイナミック・トレリングストップ戦略
- BBの脱出戦略
- MACD と RSI の組み合わせた自然取引戦略
- ボリンジャー・バンド 勢い ブレイク 戦略をフォローする適応傾向
もっと
- VWAP トレーディング 戦略とボリューム アノマリー検出
- スーパートレンドとEMAの組み合わせ戦略
- TGT 価格下落に基づいた買い上げ戦略
- EMAクロスオーバーとRSIフィルターによる二重トレンド戦略
- EMAとパラボリックSARの組み合わせ戦略
- MACDとRSI 多フィルター・イントラデイ・トレーディング・戦略
- 2つの市場間の価格関係に基づく仲裁取引戦略
- RSIに基づく取引戦略で 利回りとストップロスを パーセントベースにする
- 最適化されたロング取引のためのMACDとマルティンゲール組み合わせ戦略
- エリオット・ウェーブストカスティックEMA戦略
- SMAの二重移動平均のクロスオーバー戦略
- 10SMAとMACDの二重トレンド
- MACD と RSI の組み合わせた自然取引戦略
- ダイナミック・タイムフレーム 高低脱出戦略
- 戦略をフォローするダイナミックな傾向
- トレンドフィルターと例外出口のスムーズな移動平均ストップ・ロスト&テイク・プロフィート戦略
- R:R,日額制限,ストップロスの強化によるMACD収束戦略
- スターライト移動平均クロスオーバー戦略
- % 制限量的な取引戦略
- 動向平均のクロスオーバー戦略は,二重動向平均に基づいている