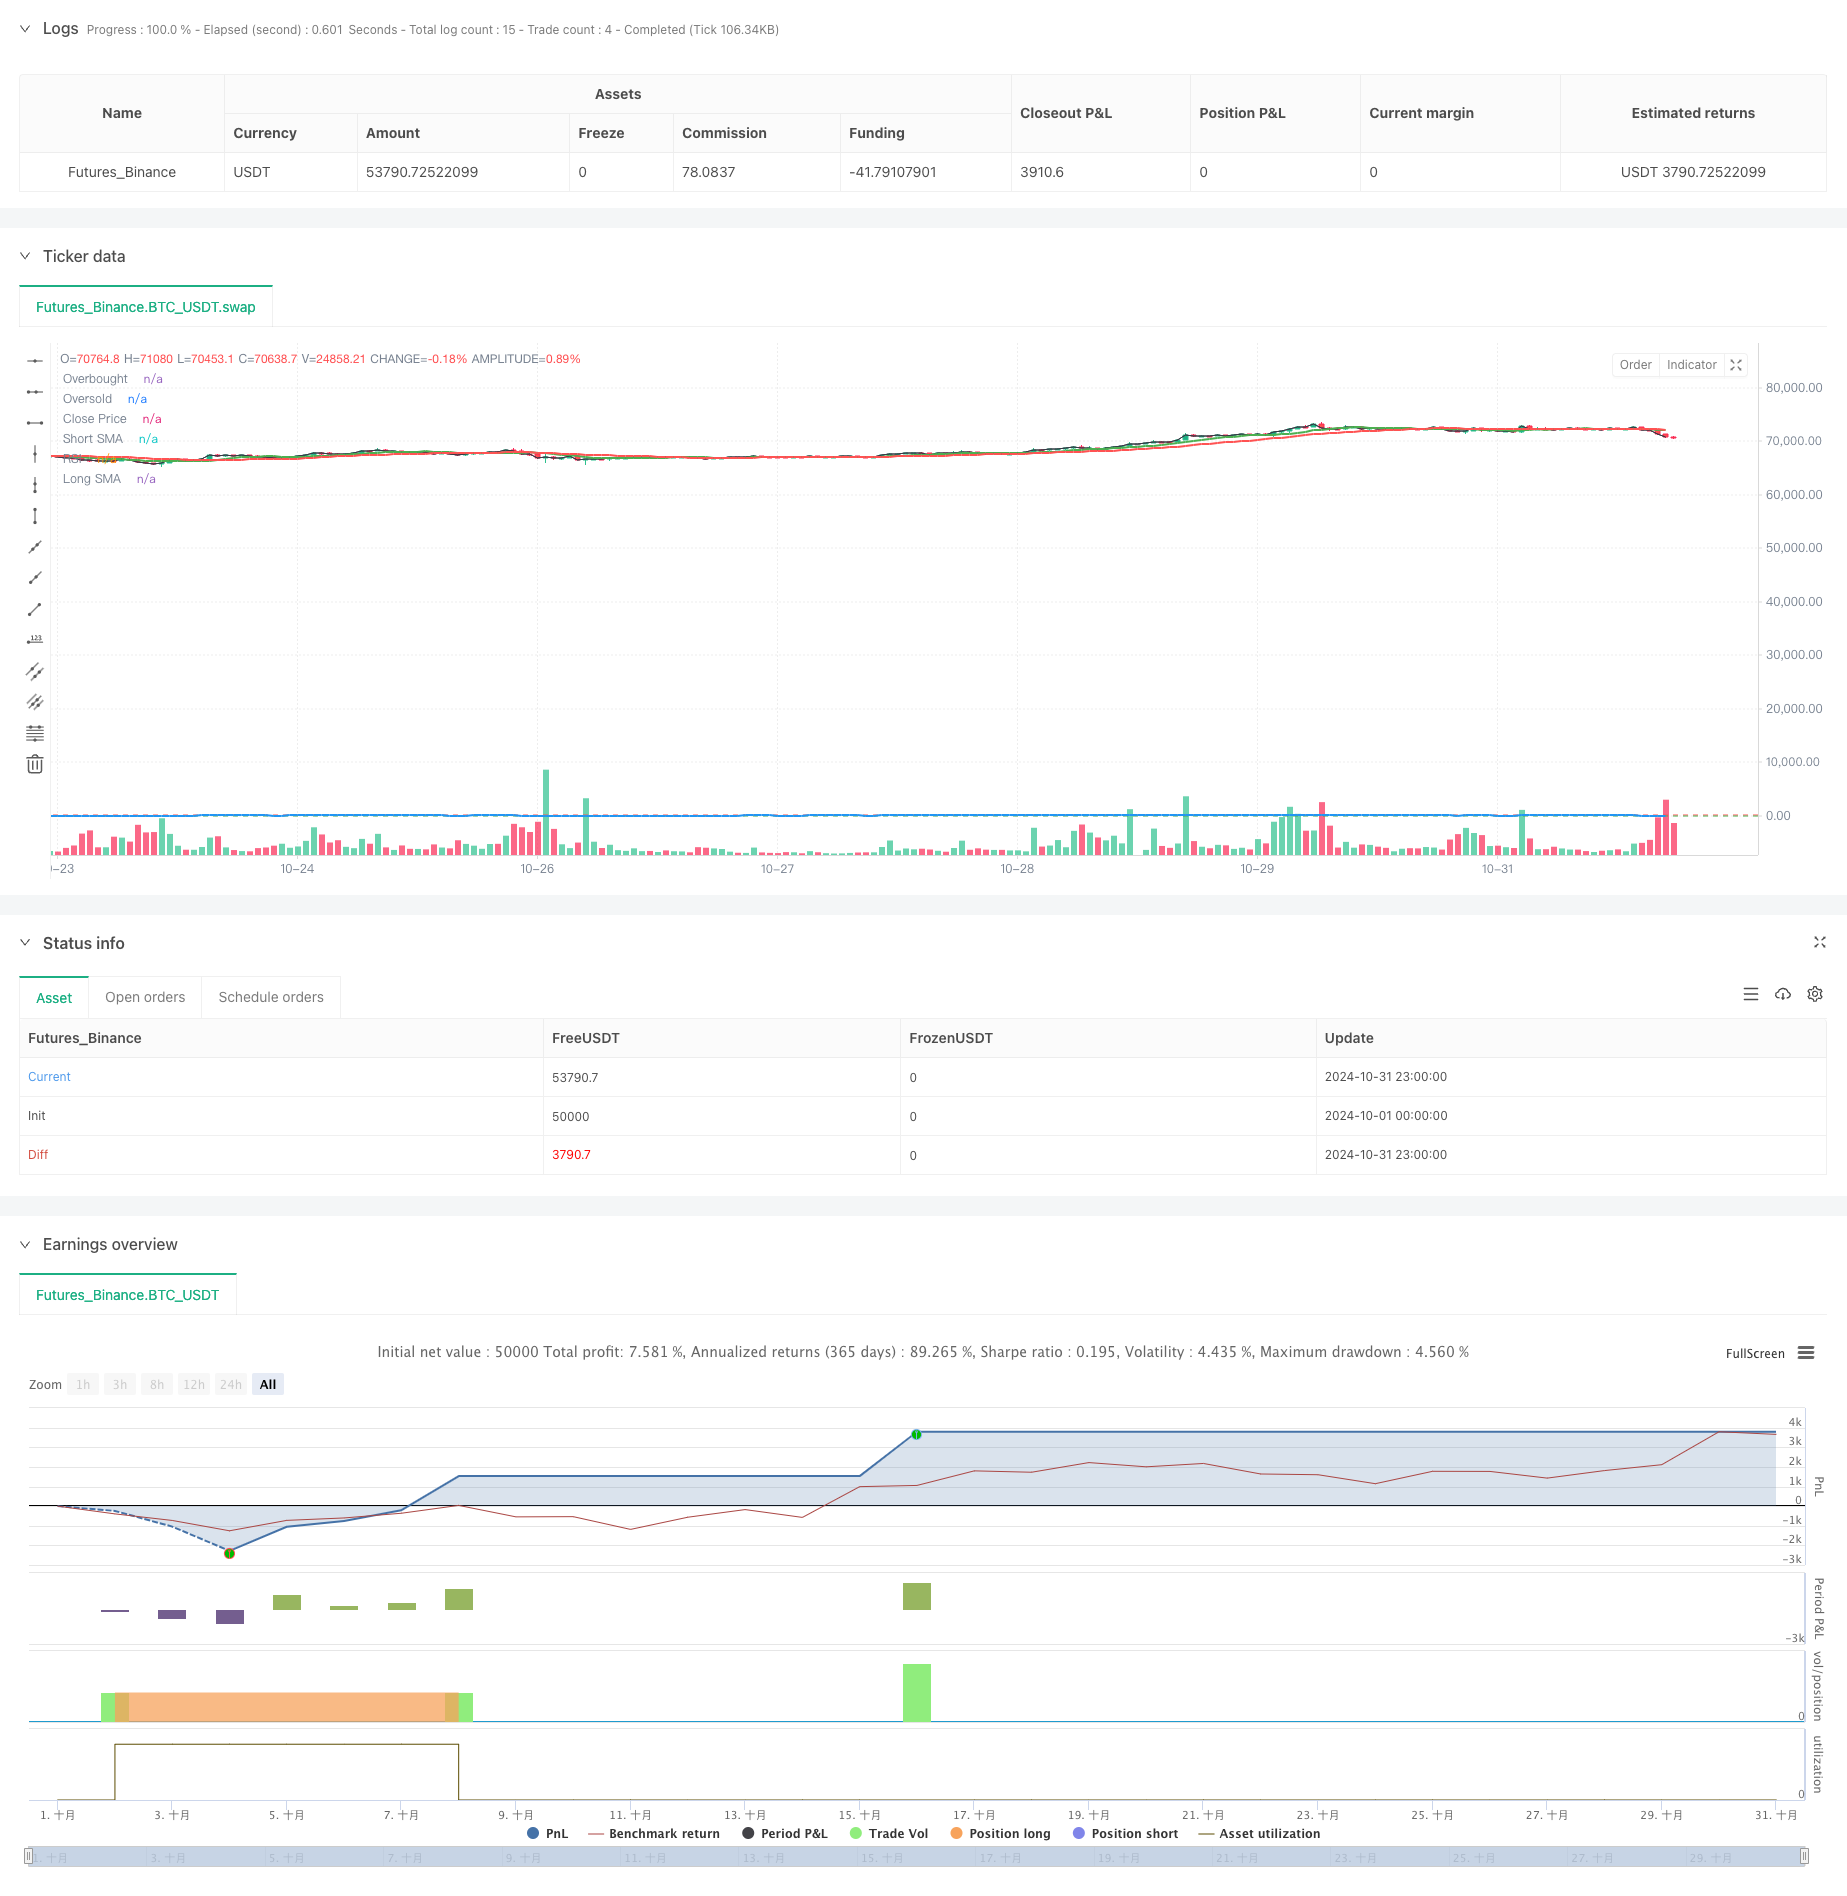
概要
これは,双均線交差,RSI超買超売,およびリスク対利益比を組み合わせた量化取引戦略である.この戦略は,短期および長期の移動平均の交差によって市場のトレンド方向を決定し,RSI指標を使用して超買超売領域を特定し,より精密な取引信号フィルタリングを実現する.この戦略は,ATRベースのダイナミックな止損設定と固定リスク対利益比の利益目標管理システムも統合している.
戦略原則
9日と21日の2つの移動平均線をトレンド判断の基礎として採用し,RSI指標の超買い超売り領域 ((35⁄65) を通じて信号確認を行う.多頭入場条件では,短期平均線が長期平均線上にあり,RSIが超売り領域 (以下) にあることを要求する.空頭入場は,短期平均線が長期平均線下にあり,RSIが超買い領域 (以下) にあることを要求する.戦略は,1.5倍ATR値の設定ストップロスを使用し, 2:1のリスク収益比利益目標に基づいて自動計算する.過剰なポジションを防ぐために,戦略は,最低3時間のポジション時間制限を設定する.
戦略的優位性
- 多重シグナル認証メカニズムにより,取引の信頼性が著しく向上しました.
- ダイナミック・ストップ・ロスの設定は,市場の変動に自律的に調整できます.
- 固定リスク/利益の比率は,長期にわたる安定した利益に貢献します.
- 最短保有期間制限は過剰取引を防ぎました.
- ビジュアルマークシステムは,戦略の監視とフィードバックの分析を容易にする
- バックグラウンドの色が変化し,現在のポジションを直感的に表示します.
戦略リスク
- 双線均一システムは,震動の市で偽信号を生じさせる可能性がある
- RSIは強気なトレンドで取引の機会を逃している可能性がある
- 固定リスク/利益の比率は,特定の市場環境では柔軟性がない可能性があります.
- ATRの停止は,波動性突発の時に不十分である可能性がある
- 最短の保有期間が,時効性のある停止機会を逃す可能性があります.
戦略最適化の方向性
- 市場状況に応じて動的に調整する自己適応の均線周期選択メカニズムを導入
- トレンド強度フィルターを増やし,信号品質を向上させる
- 変化する市場環境に適応するダイナミックなリスク・リターン比調整システムを開発する
- 交差量指標を統合し,信号の信頼性を向上させる
- 市場変動分析モジュールを追加し,取引タイミングを最適化
- パラメータ選択を最適化する機械学習アルゴリズムの導入
要約する
この戦略は,複数の技術指標の協調的な配合によって,比較的完全な取引システムを構築しています. 入場信号の質だけでなく,リスク管理と利益目標の設定にも重点を置いています. いくつかの最適化が必要な場所があるものの,全体的なフレームワークの設計は合理的で,良い実用価値と拡張スペースを持っています. 戦略のモジュール化設計は,後続的な最適化にも便利です.
ストラテジーソースコード
/*backtest
start: 2024-10-01 00:00:00
end: 2024-10-31 23:59:59
period: 1h
basePeriod: 1h
exchanges: [{"eid":"Futures_Binance","currency":"BTC_USDT"}]
*/

//@version=5
strategy("JakeJohn", overlay=true)

// Input parameters
smaShortLength = input(9, title="Short SMA Length")
smaLongLength = input(21, title="Long SMA Length")
lengthRSI = input(14, title="RSI Length")
rsiOverbought = input(65, title="RSI Overbought Level")
rsiOversold = input(35, title="RSI Oversold Level")
riskRewardRatio = input(2, title="Risk/Reward Ratio") // 2:1
atrMultiplier = input(1.5, title="ATR Multiplier") // Multiplier for ATR to set stop loss

// Calculate indicators
smaShort = ta.sma(close, smaShortLength)
smaLong = ta.sma(close, smaLongLength)
rsi = ta.rsi(close, lengthRSI)
atr = ta.atr(14)

// Entry conditions
longCondition = (smaShort > smaLong) and (rsi < rsiOversold) // Buy when short SMA is above long SMA and RSI is oversold
shortCondition = (smaShort < smaLong) and (rsi > rsiOverbought) // Sell when short SMA is below long SMA and RSI is overbought

// Variables for trade management
var float entryPrice = na
var float takeProfit = na
var int entryBarIndex = na

// Entry logic for long trades
if (longCondition and (strategy.position_size == 0))
    entryPrice := close
    takeProfit := entryPrice + (entryPrice - (entryPrice - (atr * atrMultiplier))) * riskRewardRatio
    strategy.entry("Buy", strategy.long)
    entryBarIndex := bar_index // Record the entry bar index
    label.new(bar_index, high, "BUY", style=label.style_label_up, color=color.green, textcolor=color.white, size=size.small)

// Entry logic for short trades
if (shortCondition and (strategy.position_size == 0))
    entryPrice := close
    takeProfit := entryPrice - (entryPrice - (entryPrice + (atr * atrMultiplier))) * riskRewardRatio
    strategy.entry("Sell", strategy.short)
    entryBarIndex := bar_index // Record the entry bar index
    label.new(bar_index, low, "SELL", style=label.style_label_down, color=color.red, textcolor=color.white, size=size.small)

// Manage trade duration and exit after a minimum of 3 hours
if (strategy.position_size != 0)
    // Check if the trade has been open for at least 3 hours (180 minutes)
    if (bar_index - entryBarIndex >= 180) // 3 hours in 1-minute bars
        if (strategy.position_size > 0)
            strategy.exit("Take Profit Long", from_entry="Buy", limit=takeProfit)
        else
            strategy.exit("Take Profit Short", from_entry="Sell", limit=takeProfit)

// Background colors for active trades
var color tradeColor = na
if (strategy.position_size > 0)
    tradeColor := color.new(color.green, 90) // Light green for long trades
else if (strategy.position_size < 0)
    tradeColor := color.new(color.red, 90) // Light red for short trades
else
    tradeColor := na // No color when no trade is active

bgcolor(tradeColor, title="Trade Background")

// Plotting position tools
if (strategy.position_size > 0)
    // Plot long position tool
    strategy.exit("TP Long", limit=takeProfit)

if (strategy.position_size < 0)
    // Plot short position tool
    strategy.exit("TP Short", limit=takeProfit)

// Plotting indicators
plot(smaShort, color=color.green, title="Short SMA", linewidth=2)
plot(smaLong, color=color.red, title="Long SMA", linewidth=2)

// Visual enhancements for RSI
hline(rsiOverbought, "Overbought", color=color.red)
hline(rsiOversold, "Oversold", color=color.green)
plot(rsi, color=color.blue, title="RSI", linewidth=2)

// Ensure there's at least one plot function
plot(close, color=color.black, title="Close Price", display=display.none) // Hidden plot for compliance