金のトレンドチャネル逆転のモメンタム戦略
作者: リン・ハーンチャオチャン開催日:2024年12月11日 17時52分15秒タグ:エイマATRRSI

概要
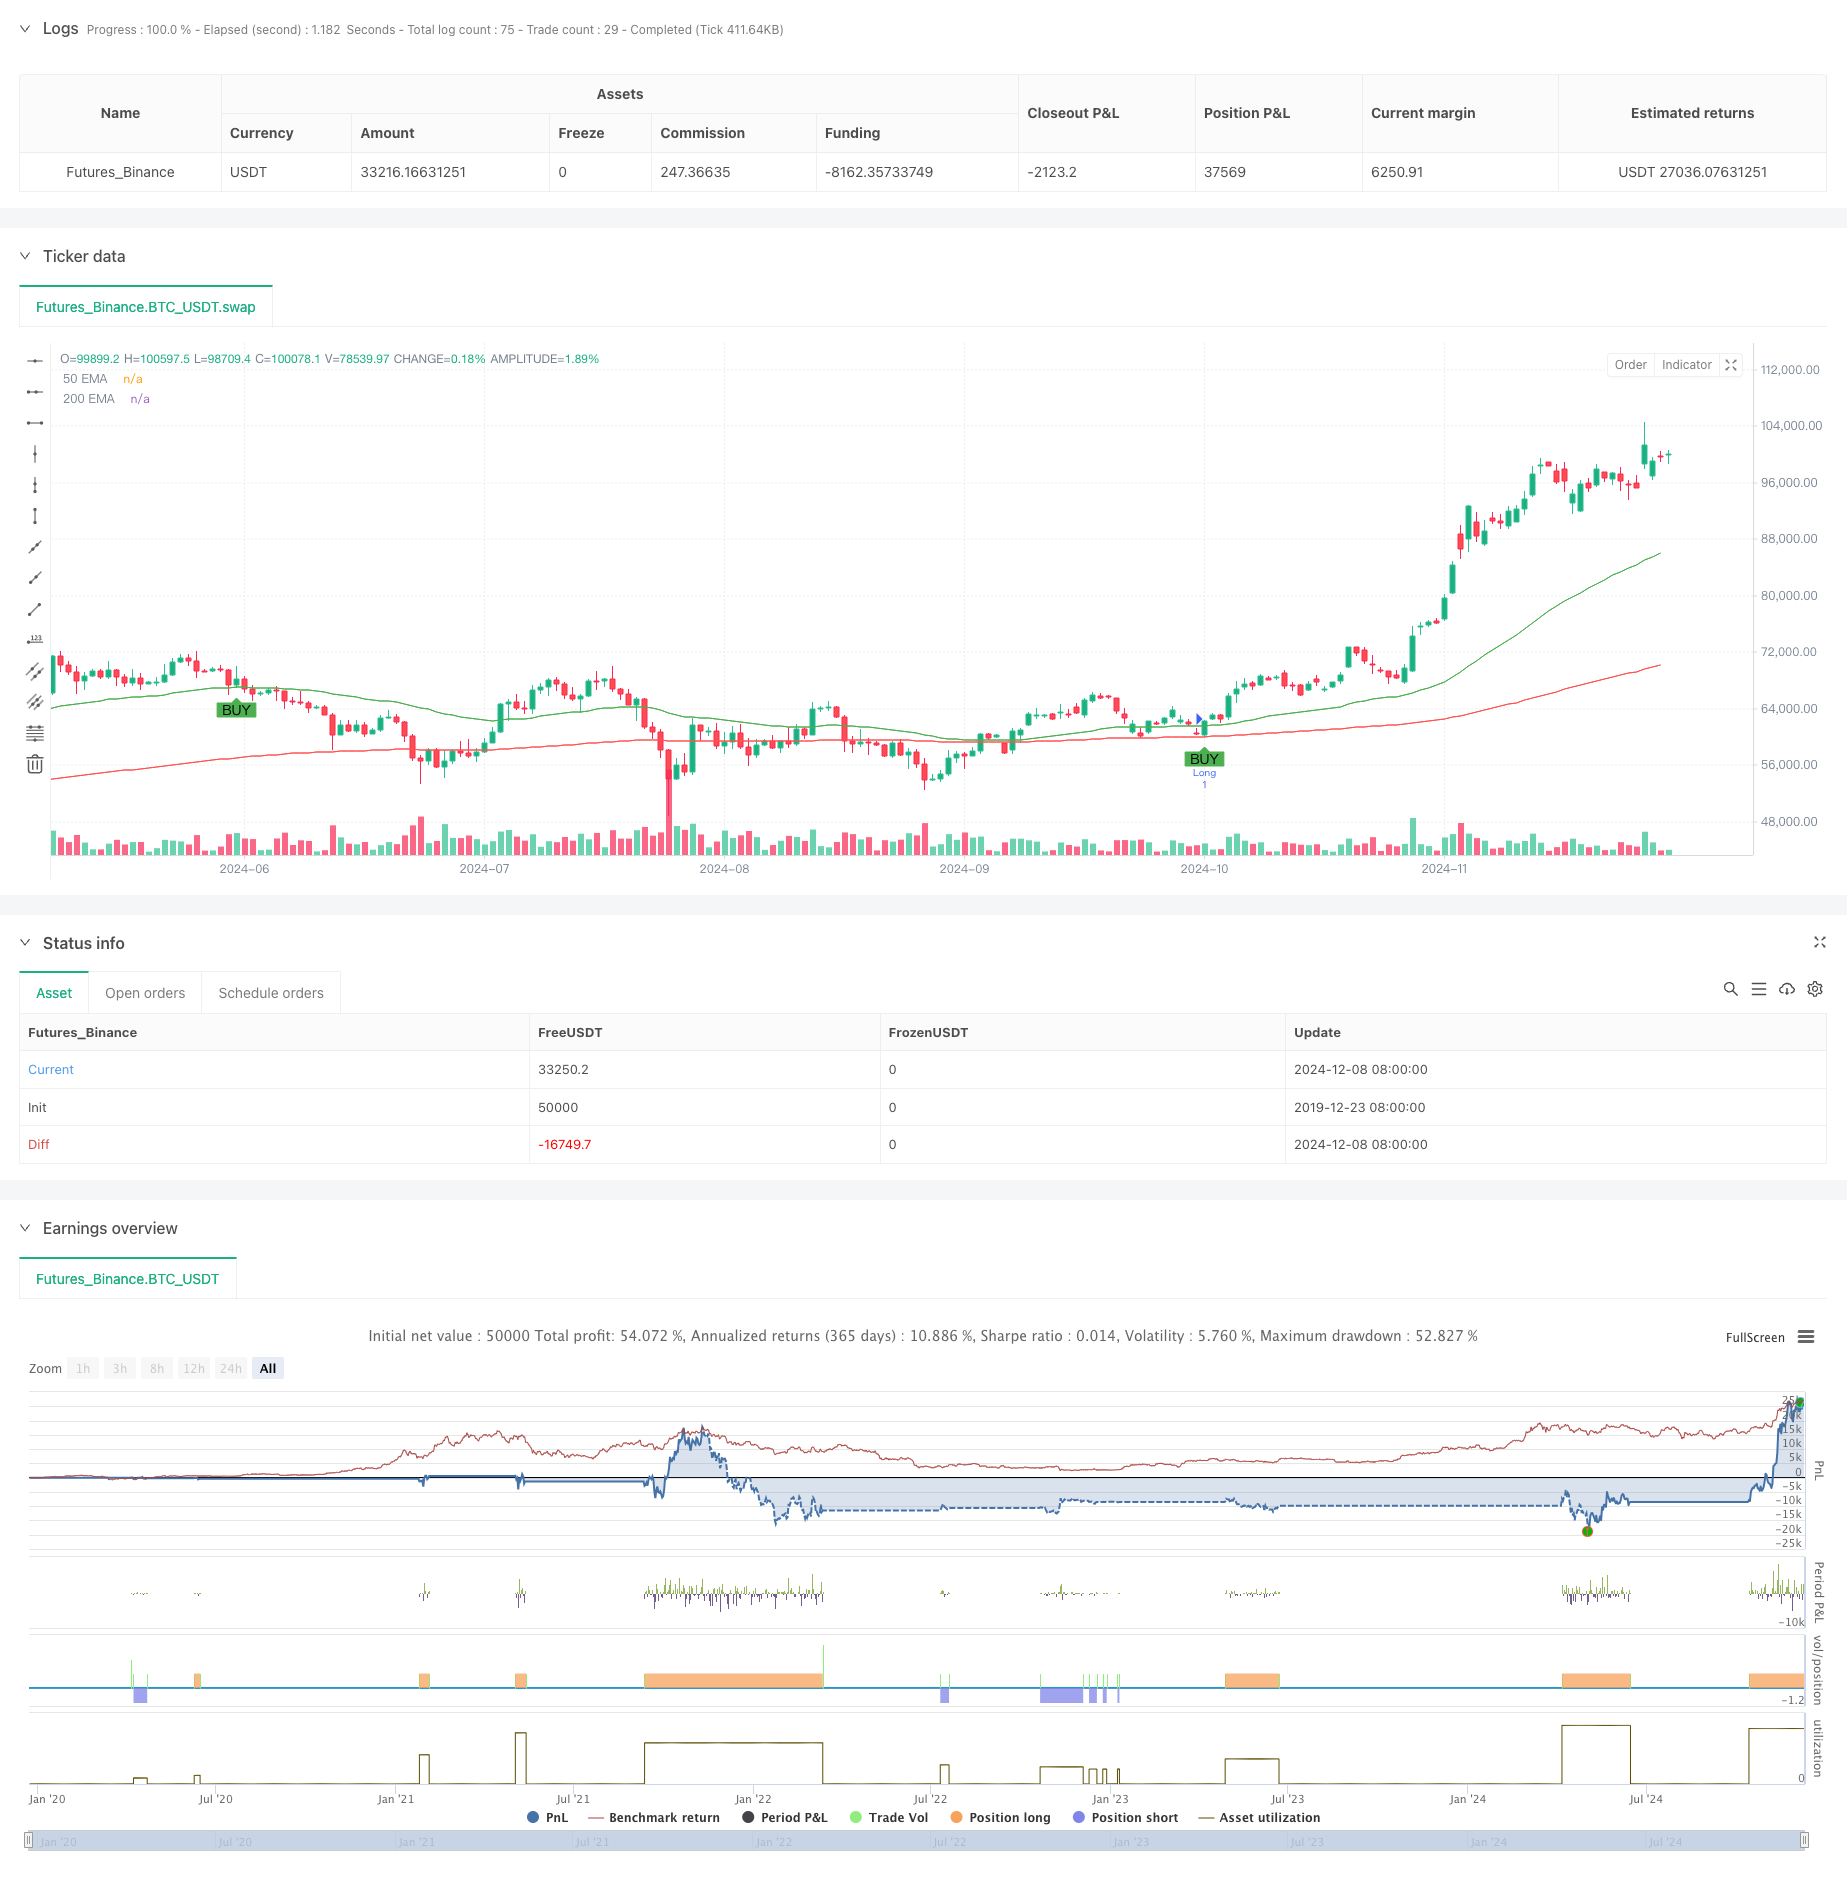
この戦略は,トレンドチャネル,価格逆転パターン,インパルス指標に基づいた取引システムである.トレンド方向を決定するために移動平均システム (EMA) を組み合わせ,統合ゾーンを特定するために相対強度指数 (RSI) を使用し,正確なエントリーポイントを見つけるためにエングロフィングパターンを採用する.この戦略は動的変動指標 (ATR) によりリスクを管理し,迅速な利益を取ることを実装する.
戦略の原則
基本論理は,複数の層の技術指標の検証に基づいています. 1. トレンドチャネルを構築し,クロスオーバーを通じてトレンド方向を決定するために50期と200期EMAを使用する 2. RSIを利用します. ニュートラルゾーン (45-55) を用いて,モメント蓄積領域を特定します. 3. 価格逆転の信号を,吸収パターンによって確認する 4. ATR をベースに動的ストップロスのレベルを設定する (※14) 5. 迅速な利益実現のために 20 ポイントの固定利益目標を実施する
戦略 の 利点
- 複数の技術指標のクロスバリダーションは信号の信頼性を向上させる
- トレンドフォローと逆転取引を組み合わせて市場機会を把握する
- RSI中性ゾーンを通って偽信号をフィルターします
- ダイナミックストップ・ロスのメカニズムは,市場の変動変化に適応する
- 固定利益目標が 規律的な取引を促進する
- 明確な戦略論理,理解し実行しやすい
戦略リスク
- 不安定な市場で頻繁に取引信号を生む可能性があります
- 固定利益目標が強い傾向で利益を制限する可能性がある
- 移動平均系は激しい変動に遅れることがあります.
- RSI中立ゾーン判断は,いくつかの取引機会を逃す可能性があります
- 流動性の高い時期では,吸収パターンが誤った信号を生む可能性があります.
戦略の最適化方向
- 価格ブレイクの有効性を検証するための量指標を導入する
- 固定ポイントの代替のための適応性のある利益目標メカニズムを開発する
- トレンド強度フィルターを追加して,不安定な市場での誤った信号を減らす
- 信号捕捉効率を向上させるため,RSI範囲を最適化
- 精度を高めるために複数のタイムフレーム信号を組み込む
概要
この戦略は,包括的な技術分析ツールを通じて体系的な取引アプローチを構築する.トレンドフォローと価格逆転の両方を強調し,複数の指標の検証を使用して取引成功率を改善する.一定の制限があるものの,継続的な最適化とリスク管理は,トレーダーに信頼できる取引参照を提供することができます.
/*backtest
start: 2019-12-23 08:00:00
end: 2024-12-09 08:00:00
period: 1d
basePeriod: 1d
exchanges: [{"eid":"Futures_Binance","currency":"BTC_USDT"}]
*/

//@version=5
strategy("Gold Scalping Strategy with Precise Entries", overlay=true)

// Inputs for EMAs and ATR
ema50 = ta.ema(close, 50)
ema200 = ta.ema(close, 200)
atr = ta.atr(14)
rsi = ta.rsi(close, 14)

// Set 50 pips for gold (assuming 1 pip = 0.10 movement in XAU/USD)
pip_target = 20 * 0.10

// Bullish/Bearish Engulfing Pattern
bullish_engulfing = close > open and close[1] < open[1] and close > close[1] and open < close[1]
bearish_engulfing = close < open and close[1] > open[1] and close < close[1] and open > close[1]

// Define trend and exact entry conditions
longCondition = (ema50 > ema200) and (rsi >= 45 and rsi <= 55) and (bullish_engulfing) and (close > ema50)
shortCondition = (ema50 < ema200) and (rsi >= 45 and rsi <= 55) and (bearish_engulfing) and (close < ema50)

// ATR-based stop loss
longStopLoss = close - atr
shortStopLoss = close + atr

// Entry Conditions with precise points
if (longCondition)
    strategy.entry("Long", strategy.long)
    strategy.exit("Take Profit/Stop Loss", "Long", limit=close + pip_target, stop=longStopLoss)

if (shortCondition)
    strategy.entry("Short", strategy.short)
    strategy.exit("Take Profit/Stop Loss", "Short", limit=close - pip_target, stop=shortStopLoss)

// Plot EMAs
plot(ema50, color=color.green, title="50 EMA")
plot(ema200, color=color.red, title="200 EMA")

// Plot Buy/Sell Signals
plotshape(series=longCondition, location=location.belowbar, color=color.green, style=shape.labelup, title="Buy Signal", text="BUY")
plotshape(series=shortCondition, location=location.abovebar, color=color.red, style=shape.labeldown, title="Sell Signal", text="SELL")
関連性
- EMAのRSIクロスオーバー戦略
- ATR-RSI強化トレンドフォロー取引システム
- EMA-スムーズなRSIとATRダイナミックストップ・ロス/テイク・プロフィートに基づいた多時間枠量的な取引戦略
- ストップ・ロスの動的多期RSIトレンド 戦略に従う
- ハンユ - 多重EMA,ATRおよびRSIに基づくトレンドフォロー・トレード戦略
- ダイナミックな取利益とストップ・ロスの最適化
- 複数の指標を備えた インテリジェントピラミッド戦略
- RSI50_EMA ロングのみ戦略
- 適性多態EMA-RSIモメントストラテジーは,ショッピネスインデックスフィルターシステム
- AlphaTradingBotの取引戦略
もっと
- 2つのタイムフレームストーカスティックモメンタム取引戦略
- アダプティブ・ボリンガー・バンド ダイナミック・ポジション・マネジメント・戦略
- ダイナミック RSI スマートタイム スウィング トレーディング 戦略
- 2方向取引戦略 キャンドルスティック吸収パターン分析に基づく
- Bollinger Breakout with Mean Reversion 4H 定量取引戦略
- ダイナミックグリッド位置サイズ戦略の傾向
- 双重BBI (bulls and bears index) クロスオーバー戦略
- 動的ロング/ショート・スウィング・トレーディング・ストラテジー
- 取引戦略をフォローするマルチテクニカル指標傾向
- 先進的な波動性平均逆転取引戦略:VIXと移動平均値に基づく多次元量的な取引システム
- 先進的なEMAモメンタムトレンド取引戦略
- マルチMAトレンド・インテニシティ・トレーディング・戦略 - MA偏差に基づく柔軟なスマート・トレーディング・システム
- ボリューム重量化二重傾向検出システム
- 多要素対トレンド取引戦略
- 強化されたモメントオシレーターとストカスティックディバージェンスの定量取引戦略
- トレンドブレイク・トレード戦略によるマルチタイムフレームフィボナッチ・リトラセメント
- 多指標の傾向 利益の最適化による戦略
- フラクタル・ブレイクアウト・モメンタム・トレーディング・戦略
- チェンデ・モメンタム・オシレーターに基づいた適応型平均逆転取引戦略
- 取引戦略をフォローするMACD-スーパートレンド 双重確認傾向