개요
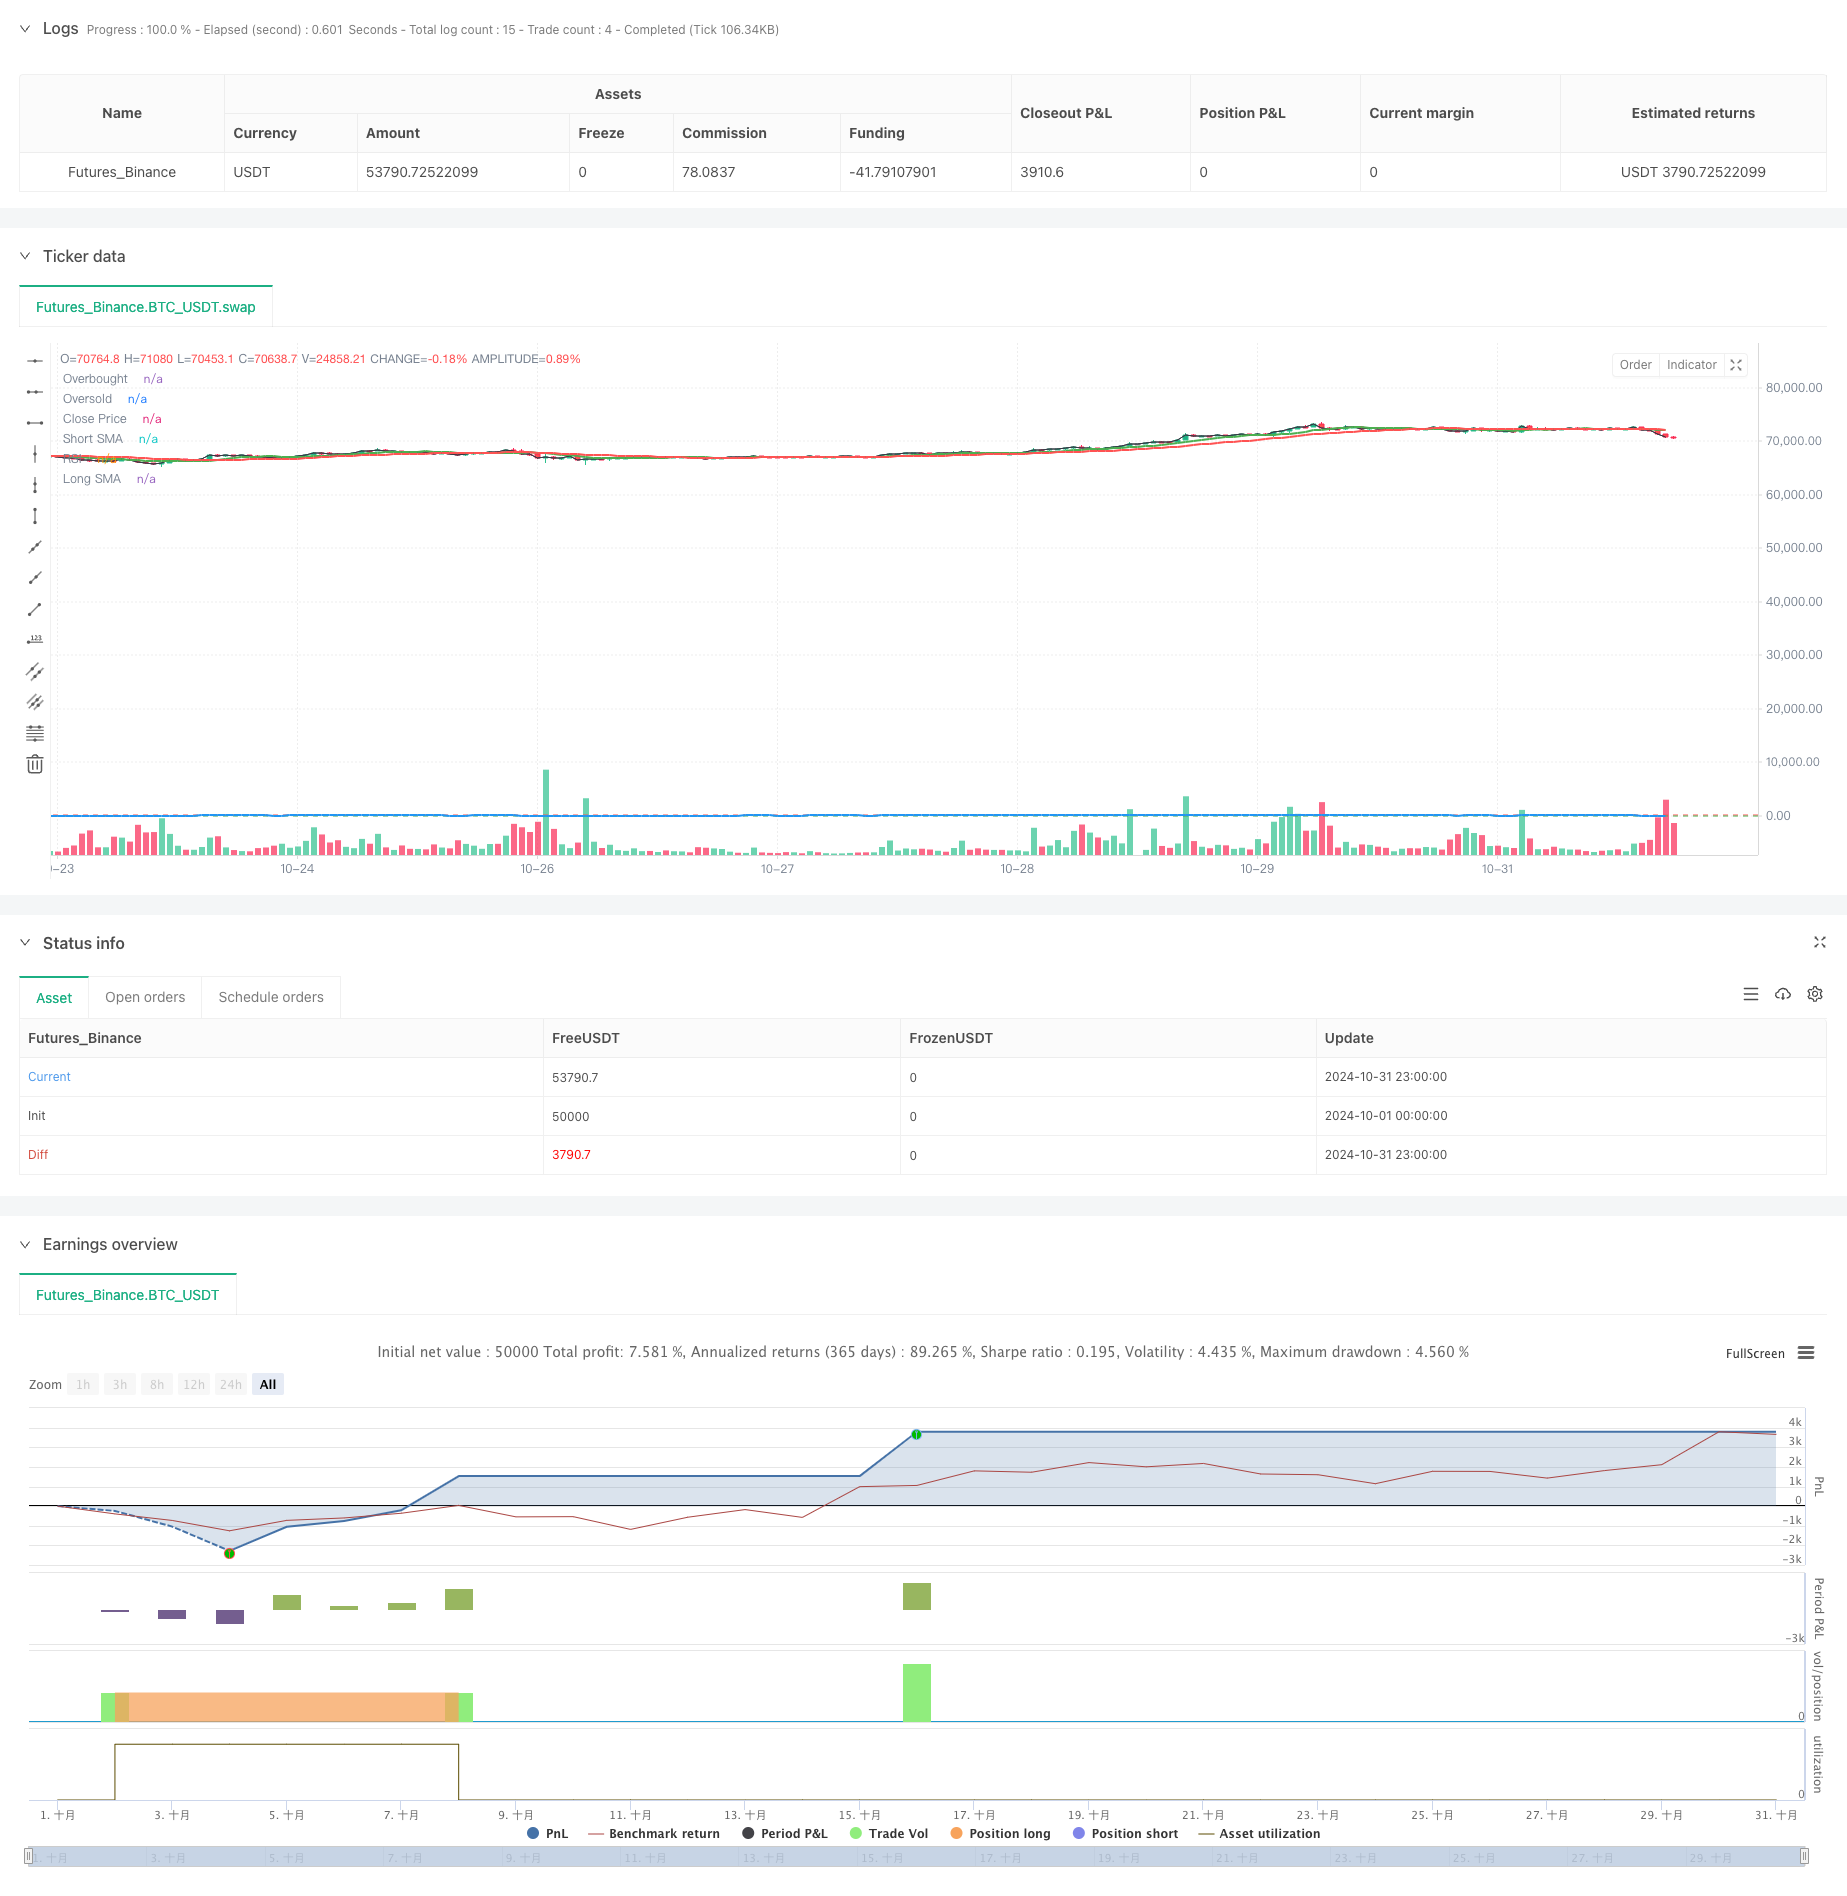
이 전략은 양평선 교차, RSI 오버 바이 오버 세일, 그리고 리스크 수익률을 결합한 양적 거래 전략이다. 이 전략은 단기 및 장기 이동 평균의 교차를 통해 시장 추세 방향을 결정하고, RSI 지표를 사용하여 오버 바이 오버 세일 지역을 식별하여 더 정확한 거래 신호 필터링을 가능하게 한다. 이 전략은 또한 ATR 기반의 동적 중지 손실 설정과 고정 리스크 수익률을위한 수익 목표 관리 시스템을 통합한다.
전략 원칙
전략은 9일과 21일 두 개의 이동 평균을 트렌드 판단의 기초로 삼고, RSI 지표의 오버 바이 오버 세 지역 ((35⁄65) 을 통해 신호 확인한다. 다중 입점 조건에서, 단기 평균선이 장기 평균선 위에 있고 RSI가 오버 세 지역 (<35) 에 있어야 한다. 공허 입점에서는 단기 평균선이 장기 평균선 아래에 있고 RSI가 오버 바이 지역 (<65) 에 있어야 한다. 전략은 1.5배의 ATR 값을 설정한 중지 손실 거리를 사용하고, 2:1의 위험 수익보다 자동으로 계산된 수익 목표를 기반으로 한다. 과도한 지분을 방지하기 위해, 전략은 최소 3시간의 지분 제한을 설정했다.
전략적 이점
- 다중 신호 확인 메커니즘은 거래의 신뢰성을 크게 향상시킵니다.
- 동적 중지 손실 설정은 시장의 변동성에 따라 적응할 수 있습니다.
- 고정된 리스크/이익 비율은 장기적으로 안정적인 수익을 창출하는데 도움이 됩니다.
- 최소 보유 기간 제한은 과도한 거래를 방지하는 데 효과적입니다.
- 시각적 표기 시스템은 정책 모니터링과 피드백 분석을 용이하게 합니다.
- 백그라운드 색상 변경 직관적으로 현재 포지션 상태를 표시합니다
전략적 위험
- 이중 평선 시스템은 흔들리는 시장에서 잘못된 신호를 발생시킬 수 있습니다.
- RSI 지표가 강세를 보인다면 거래 기회를 놓칠 수 있습니다.
- 고정된 리스크/이익 비율은 특정 시장 환경에서 충분히 유연하지 않을 수 있습니다.
- ATR 정지는 변동성 돌연변이에 적절하지 않을 수 있습니다.
- 최단 기간 지분 보유는 적당한 시간 내에 손실을 감수할 수 있습니다.
전략 최적화 방향
- 시장 상황에 따라 동적으로 조정하는 적응형 평형 주기 선택 메커니즘을 도입합니다.
- 트렌드 강도 필터를 증가시켜 신호 품질을 향상시킵니다.
- 역동적인 리스크/이익을 개발하고 다양한 시장 환경에 적응하는 시스템
- 교통량 지표 통합, 신호 신뢰성 향상
- 시장 변동성 분석 모듈을 추가하여 거래 시기를 최적화합니다.
- 매개변수 선택을 최적화하기 위한 머신 러닝 알고리즘 소개
요약하다
이 전략은 여러 기술 지표의 협동 협동으로 비교적 완전한 거래 시스템을 구축한다. 그것은 진입 신호의 품질뿐만 아니라 위험 관리 및 수익 목표의 설정에 초점을 맞추고 있다. 일부 최적화가 필요한 곳이 있지만 전체적인 프레임 워크는 합리적으로 설계되어 있으며 실용적인 가치와 확장 공간을 가지고 있다. 전략의 모듈화 설계는 또한 후속 최적화에 대한 편의를 제공합니다.
/*backtest
start: 2024-10-01 00:00:00
end: 2024-10-31 23:59:59
period: 1h
basePeriod: 1h
exchanges: [{"eid":"Futures_Binance","currency":"BTC_USDT"}]
*/

//@version=5
strategy("JakeJohn", overlay=true)

// Input parameters
smaShortLength = input(9, title="Short SMA Length")
smaLongLength = input(21, title="Long SMA Length")
lengthRSI = input(14, title="RSI Length")
rsiOverbought = input(65, title="RSI Overbought Level")
rsiOversold = input(35, title="RSI Oversold Level")
riskRewardRatio = input(2, title="Risk/Reward Ratio") // 2:1
atrMultiplier = input(1.5, title="ATR Multiplier") // Multiplier for ATR to set stop loss

// Calculate indicators
smaShort = ta.sma(close, smaShortLength)
smaLong = ta.sma(close, smaLongLength)
rsi = ta.rsi(close, lengthRSI)
atr = ta.atr(14)

// Entry conditions
longCondition = (smaShort > smaLong) and (rsi < rsiOversold) // Buy when short SMA is above long SMA and RSI is oversold
shortCondition = (smaShort < smaLong) and (rsi > rsiOverbought) // Sell when short SMA is below long SMA and RSI is overbought

// Variables for trade management
var float entryPrice = na
var float takeProfit = na
var int entryBarIndex = na

// Entry logic for long trades
if (longCondition and (strategy.position_size == 0))
    entryPrice := close
    takeProfit := entryPrice + (entryPrice - (entryPrice - (atr * atrMultiplier))) * riskRewardRatio
    strategy.entry("Buy", strategy.long)
    entryBarIndex := bar_index // Record the entry bar index
    label.new(bar_index, high, "BUY", style=label.style_label_up, color=color.green, textcolor=color.white, size=size.small)

// Entry logic for short trades
if (shortCondition and (strategy.position_size == 0))
    entryPrice := close
    takeProfit := entryPrice - (entryPrice - (entryPrice + (atr * atrMultiplier))) * riskRewardRatio
    strategy.entry("Sell", strategy.short)
    entryBarIndex := bar_index // Record the entry bar index
    label.new(bar_index, low, "SELL", style=label.style_label_down, color=color.red, textcolor=color.white, size=size.small)

// Manage trade duration and exit after a minimum of 3 hours
if (strategy.position_size != 0)
    // Check if the trade has been open for at least 3 hours (180 minutes)
    if (bar_index - entryBarIndex >= 180) // 3 hours in 1-minute bars
        if (strategy.position_size > 0)
            strategy.exit("Take Profit Long", from_entry="Buy", limit=takeProfit)
        else
            strategy.exit("Take Profit Short", from_entry="Sell", limit=takeProfit)

// Background colors for active trades
var color tradeColor = na
if (strategy.position_size > 0)
    tradeColor := color.new(color.green, 90) // Light green for long trades
else if (strategy.position_size < 0)
    tradeColor := color.new(color.red, 90) // Light red for short trades
else
    tradeColor := na // No color when no trade is active

bgcolor(tradeColor, title="Trade Background")

// Plotting position tools
if (strategy.position_size > 0)
    // Plot long position tool
    strategy.exit("TP Long", limit=takeProfit)

if (strategy.position_size < 0)
    // Plot short position tool
    strategy.exit("TP Short", limit=takeProfit)

// Plotting indicators
plot(smaShort, color=color.green, title="Short SMA", linewidth=2)
plot(smaLong, color=color.red, title="Long SMA", linewidth=2)

// Visual enhancements for RSI
hline(rsiOverbought, "Overbought", color=color.red)
hline(rsiOversold, "Oversold", color=color.green)
plot(rsi, color=color.blue, title="RSI", linewidth=2)

// Ensure there's at least one plot function
plot(close, color=color.black, title="Close Price", display=display.none) // Hidden plot for compliance