금 트렌드 채널 역전 동력 전략
저자:차오장, 날짜: 2024-12-11 17:52:15태그:EMAATRRSI

전반적인 설명
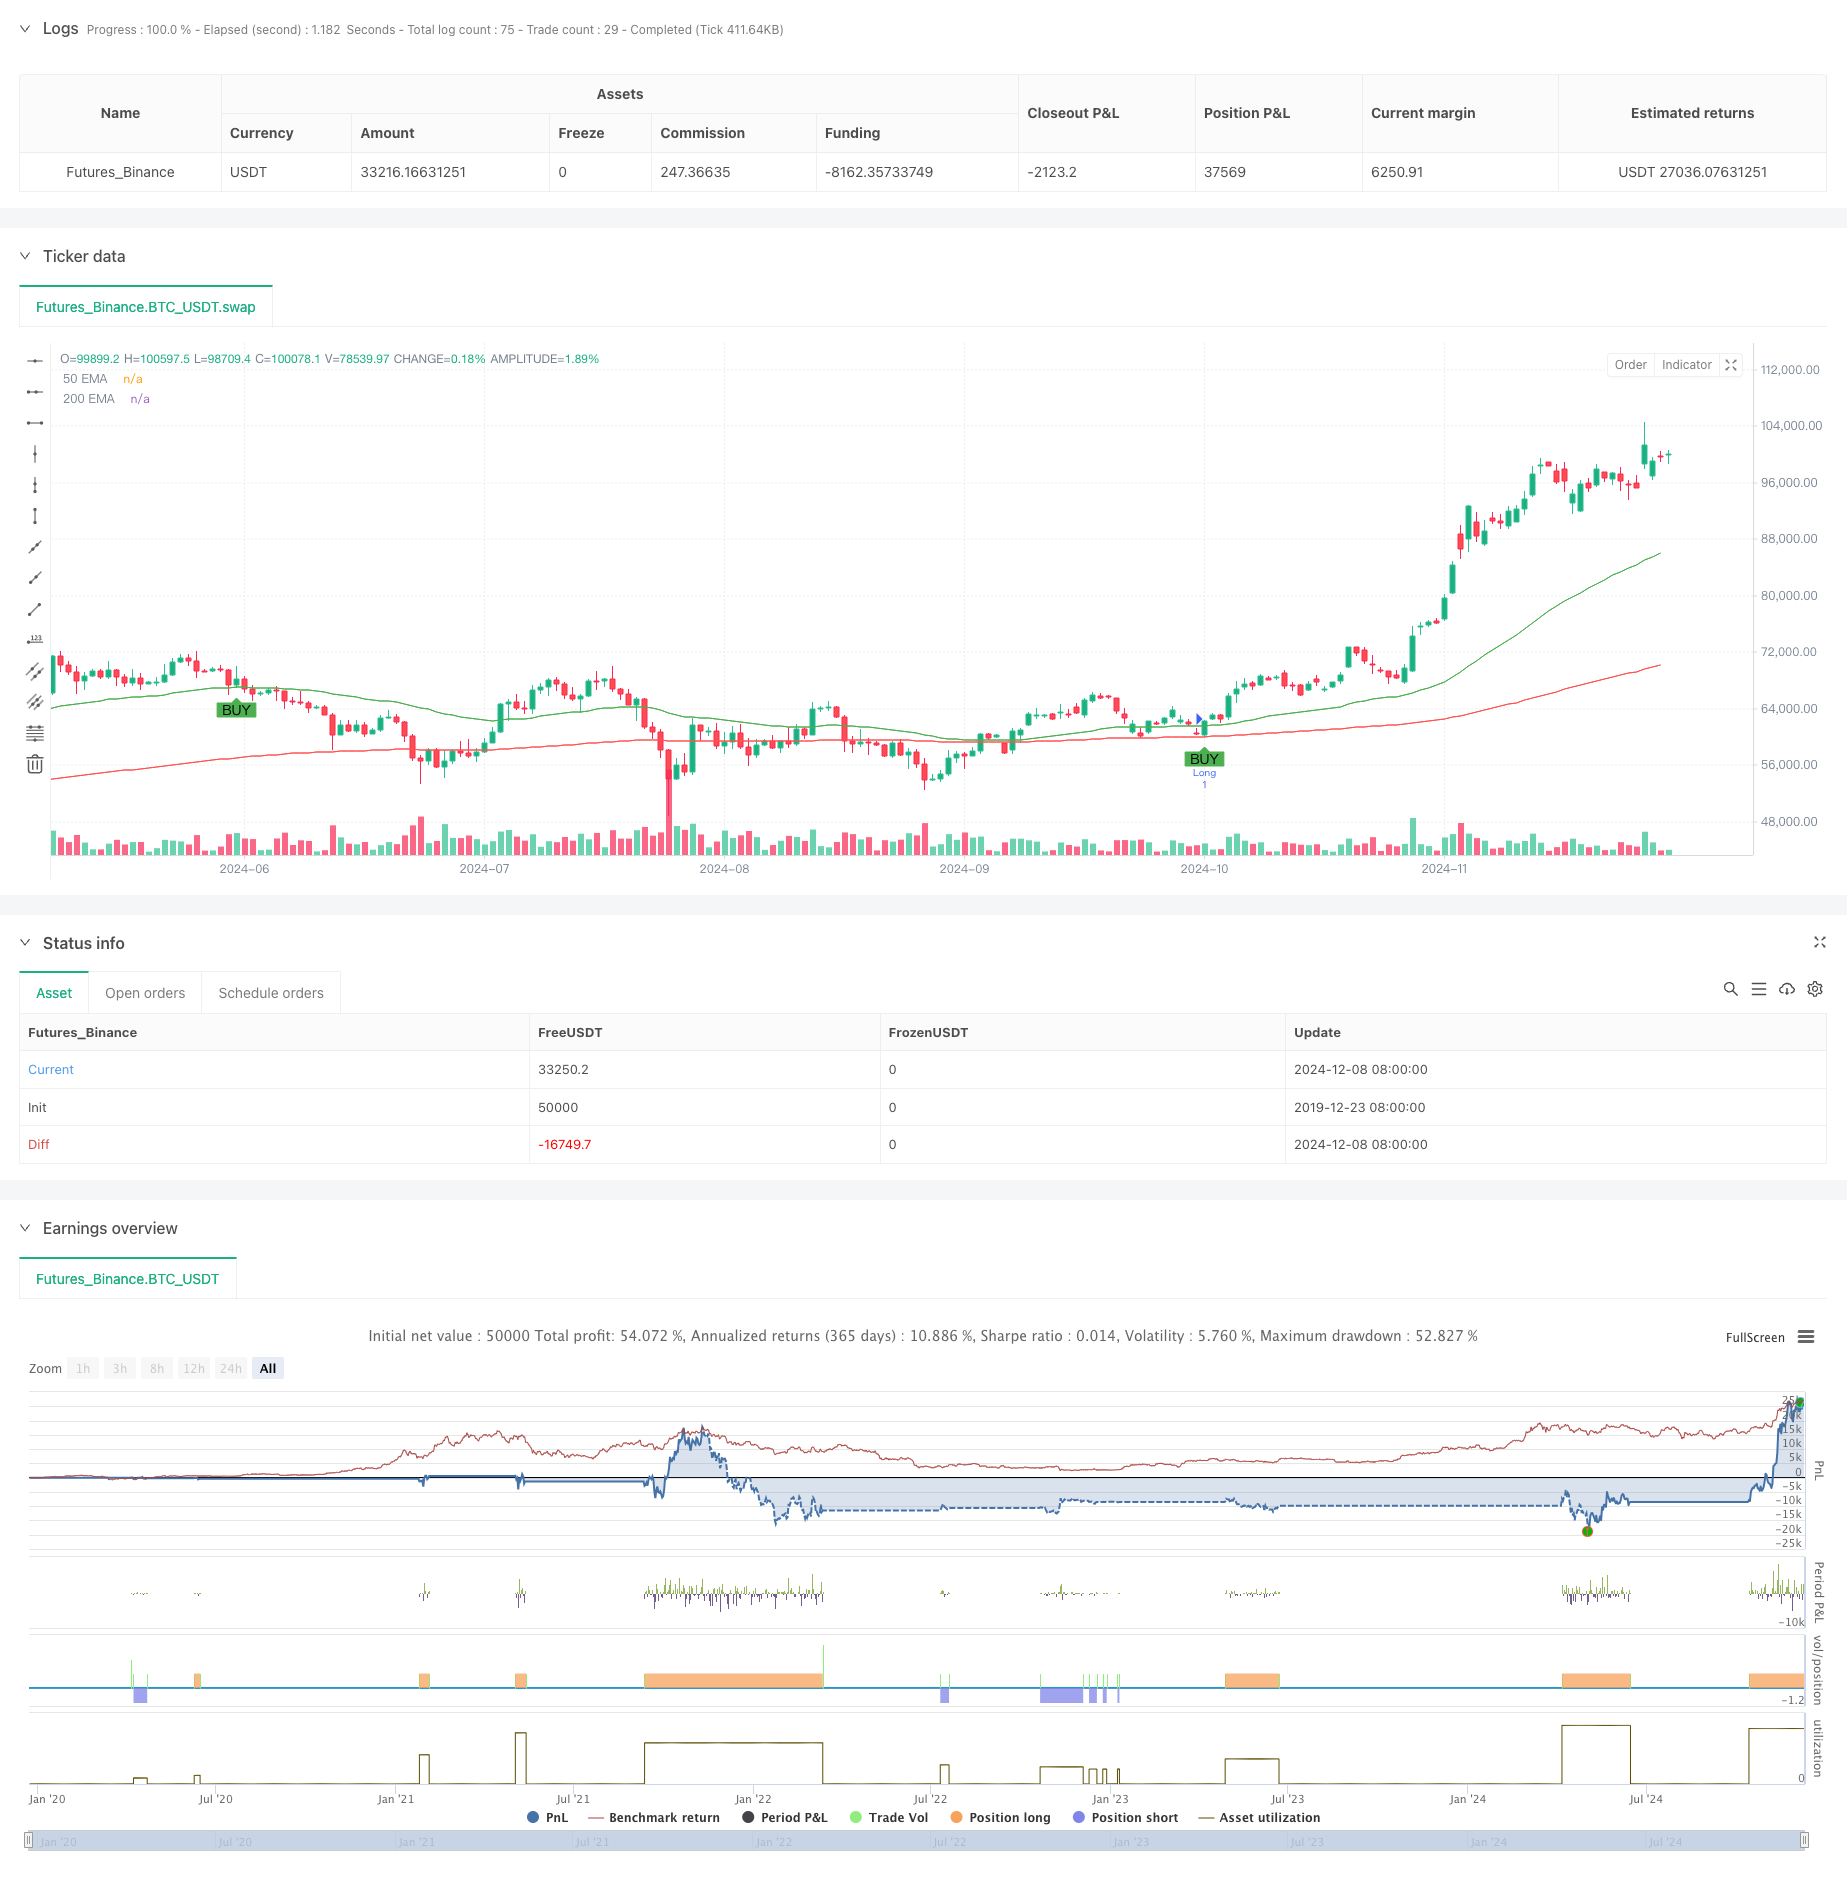
이 전략은 트렌드 채널, 가격 역전 패턴 및 추진력 지표에 기반한 거래 시스템이다. 트렌드 방향을 결정하기 위해 이동 평균 시스템 (EMA) 을 결합하고, 연대 강도 지표 (RSI) 를 사용하여 통합 구역을 식별하고, 정확한 입구 지점을 찾기 위해 포용 패턴을 사용합니다. 이 전략은 동적 변동성 지표 (ATR) 를 통해 위험을 관리하고 빠른 수익을 구현합니다.
전략 원칙
핵심 논리는 다단계 기술 지표 검증에 기반합니다. 1. 50 및 200 기간 EMA를 사용하여 트렌드 채널을 구성하고 크로스오버를 통해 트렌드 방향을 결정합니다. 2. RSI를 이용합니다. 14 중립 구역 (45-55) 을 이용해서 운동량 축적 영역을 식별합니다. 3. 포식 패턴을 통해 가격 반전 신호를 확인 4. ATR에 기초한 동적 스톱 로스 레벨을 설정합니다. 5. 신속한 수익 실현을 위해 고정된 20 포인트 수익 목표를 구현합니다.
전략적 장점
- 여러 기술 지표의 교차 검증은 신호 신뢰성을 향상시킵니다.
- 트렌드 추적 및 역전 거래를 결합하여 시장 기회를 포착합니다.
- RSI 중립 구역을 통해 잘못된 신호를 필터
- 동적 스톱 로스 메커니즘은 시장 변동성 변화에 적응합니다.
- 고정 수익 목표가 규율된 거래를 촉진합니다.
- 명확한 전략 논리, 이해하기 쉽고 실행하기 쉽다
전략 위험
- 불안한 시장에서 빈번한 거래 신호를 생성 할 수 있습니다.
- 고정 수익 목표가 강한 추세에서 수익을 제한 할 수 있습니다.
- 이동평균 시스템은 격렬한 변동에 지연할 수 있습니다.
- RSI 중립 구역 판단은 일부 거래 기회를 놓칠 수 있습니다.
- 흡수 패턴은 높은 변동성 기간에 잘못된 신호를 일으킬 수 있습니다.
전략 최적화 방향
- 가격 분산의 유효성을 검증하기 위한 부피 지표를 도입
- 일정한 점수를 대체하기 위한 적응성 있는 수익 목표 메커니즘을 개발
- 트렌드 강도 필터를 추가하여 불안한 시장에서 잘못된 신호를 줄이십시오.
- 신호 캡처 효율을 향상시키기 위해 RSI 범위를 최적화
- 정확도를 높이기 위해 여러 시간 프레임 신호를 통합
요약
이 전략은 포괄적인 기술 분석 도구를 통해 체계적인 거래 접근 방식을 구축합니다. 트렌드 따라와 가격 역전을 강조하며 거래 성공률을 향상시키기 위해 여러 지표 검증을 사용합니다. 특정 한계가 있지만 지속적인 최적화 및 위험 관리는 거래자에게 신뢰할 수있는 거래 참조를 제공할 수 있습니다.
/*backtest
start: 2019-12-23 08:00:00
end: 2024-12-09 08:00:00
period: 1d
basePeriod: 1d
exchanges: [{"eid":"Futures_Binance","currency":"BTC_USDT"}]
*/

//@version=5
strategy("Gold Scalping Strategy with Precise Entries", overlay=true)

// Inputs for EMAs and ATR
ema50 = ta.ema(close, 50)
ema200 = ta.ema(close, 200)
atr = ta.atr(14)
rsi = ta.rsi(close, 14)

// Set 50 pips for gold (assuming 1 pip = 0.10 movement in XAU/USD)
pip_target = 20 * 0.10

// Bullish/Bearish Engulfing Pattern
bullish_engulfing = close > open and close[1] < open[1] and close > close[1] and open < close[1]
bearish_engulfing = close < open and close[1] > open[1] and close < close[1] and open > close[1]

// Define trend and exact entry conditions
longCondition = (ema50 > ema200) and (rsi >= 45 and rsi <= 55) and (bullish_engulfing) and (close > ema50)
shortCondition = (ema50 < ema200) and (rsi >= 45 and rsi <= 55) and (bearish_engulfing) and (close < ema50)

// ATR-based stop loss
longStopLoss = close - atr
shortStopLoss = close + atr

// Entry Conditions with precise points
if (longCondition)
    strategy.entry("Long", strategy.long)
    strategy.exit("Take Profit/Stop Loss", "Long", limit=close + pip_target, stop=longStopLoss)

if (shortCondition)
    strategy.entry("Short", strategy.short)
    strategy.exit("Take Profit/Stop Loss", "Short", limit=close - pip_target, stop=shortStopLoss)

// Plot EMAs
plot(ema50, color=color.green, title="50 EMA")
plot(ema200, color=color.red, title="200 EMA")

// Plot Buy/Sell Signals
plotshape(series=longCondition, location=location.belowbar, color=color.green, style=shape.labelup, title="Buy Signal", text="BUY")
plotshape(series=shortCondition, location=location.abovebar, color=color.red, style=shape.labeldown, title="Sell Signal", text="SELL")
관련
- EMA RSI 크로스오버 전략
- ATR-RSI 증강 트렌드 트레이딩 시스템
- EMA-Smoothed RSI 및 ATR 동적 스톱 로스/익스피스 취득에 기초한 다중 시간 프레임 양적 거래 전략
- 동적 스톱 로스 다 기간 RSI 트렌드 전략
- Han Yue - 다중 EMA, ATR 및 RSI를 기반으로 한 트렌드 다음 거래 전략
- 4시간 시간 프레임 포괄 패턴 거래 전략 동적 취득 및 중지 손실 최적화
- 다중 지표 지능형 피라미드 전략
- RSI50_EMA 장기 전용 전략
- 호프니스 인덱스 필터 시스템으로 적응 가능한 다국적 EMA-RSI 모멘텀 전략
- AlphaTradingBot 거래 전략
더 많은
- 이중 시간 프레임 스토카스틱 모멘텀 거래 전략
- 적응적인 볼링거 밴드 역동적 포지션 관리 전략
- 동적 RSI 스마트 타이밍 스윙 거래 전략
- 촛불 흡수 패턴 분석에 기초한 양방향 거래 전략
- 평균 반전 4H 양적 거래 전략과 함께 볼링거 브레이크
- 동적 격자 위치 크기 전략을 따르는 경향
- 이중적인 BBI (Bulls and Bears Index) 크로스오버 전략
- 이동 평균 크로스오버 신호 시스템으로 동적 장기/단기 스윙 거래 전략
- 거래 전략에 따른 다기술 지표 트렌드
- 고급 변동성 평균 회전 거래 전략: VIX와 이동 평균에 기반한 다차원적 양적 거래 시스템
- 고급 EMA 모멘텀 트렌드 거래 전략
- 다중 MA 트렌드 강도 거래 전략 - MA 오차에 기반한 유연한 스마트 거래 시스템
- 부피 가중화된 이중 경향 감지 시스템
- 다중 요인 역동 트렌드 거래 전략
- 강화된 모멘텀 오시레이터 및 스토카스틱 디버전스 양적 거래 전략
- 트렌드 브레이크 트레이딩 전략으로 멀티 타임프레임 피보나치 리트레이싱
- 다중 지표 트렌드 수익 최적화 전략
- 프랙탈 브레이크업 모멘텀 거래 전략
데 모멘텀 오시레이터 기반의 적응적 평균 역전 거래 전략 - 거래 전략에 따른 MACD-Supertrend 이중 확인 트렌드