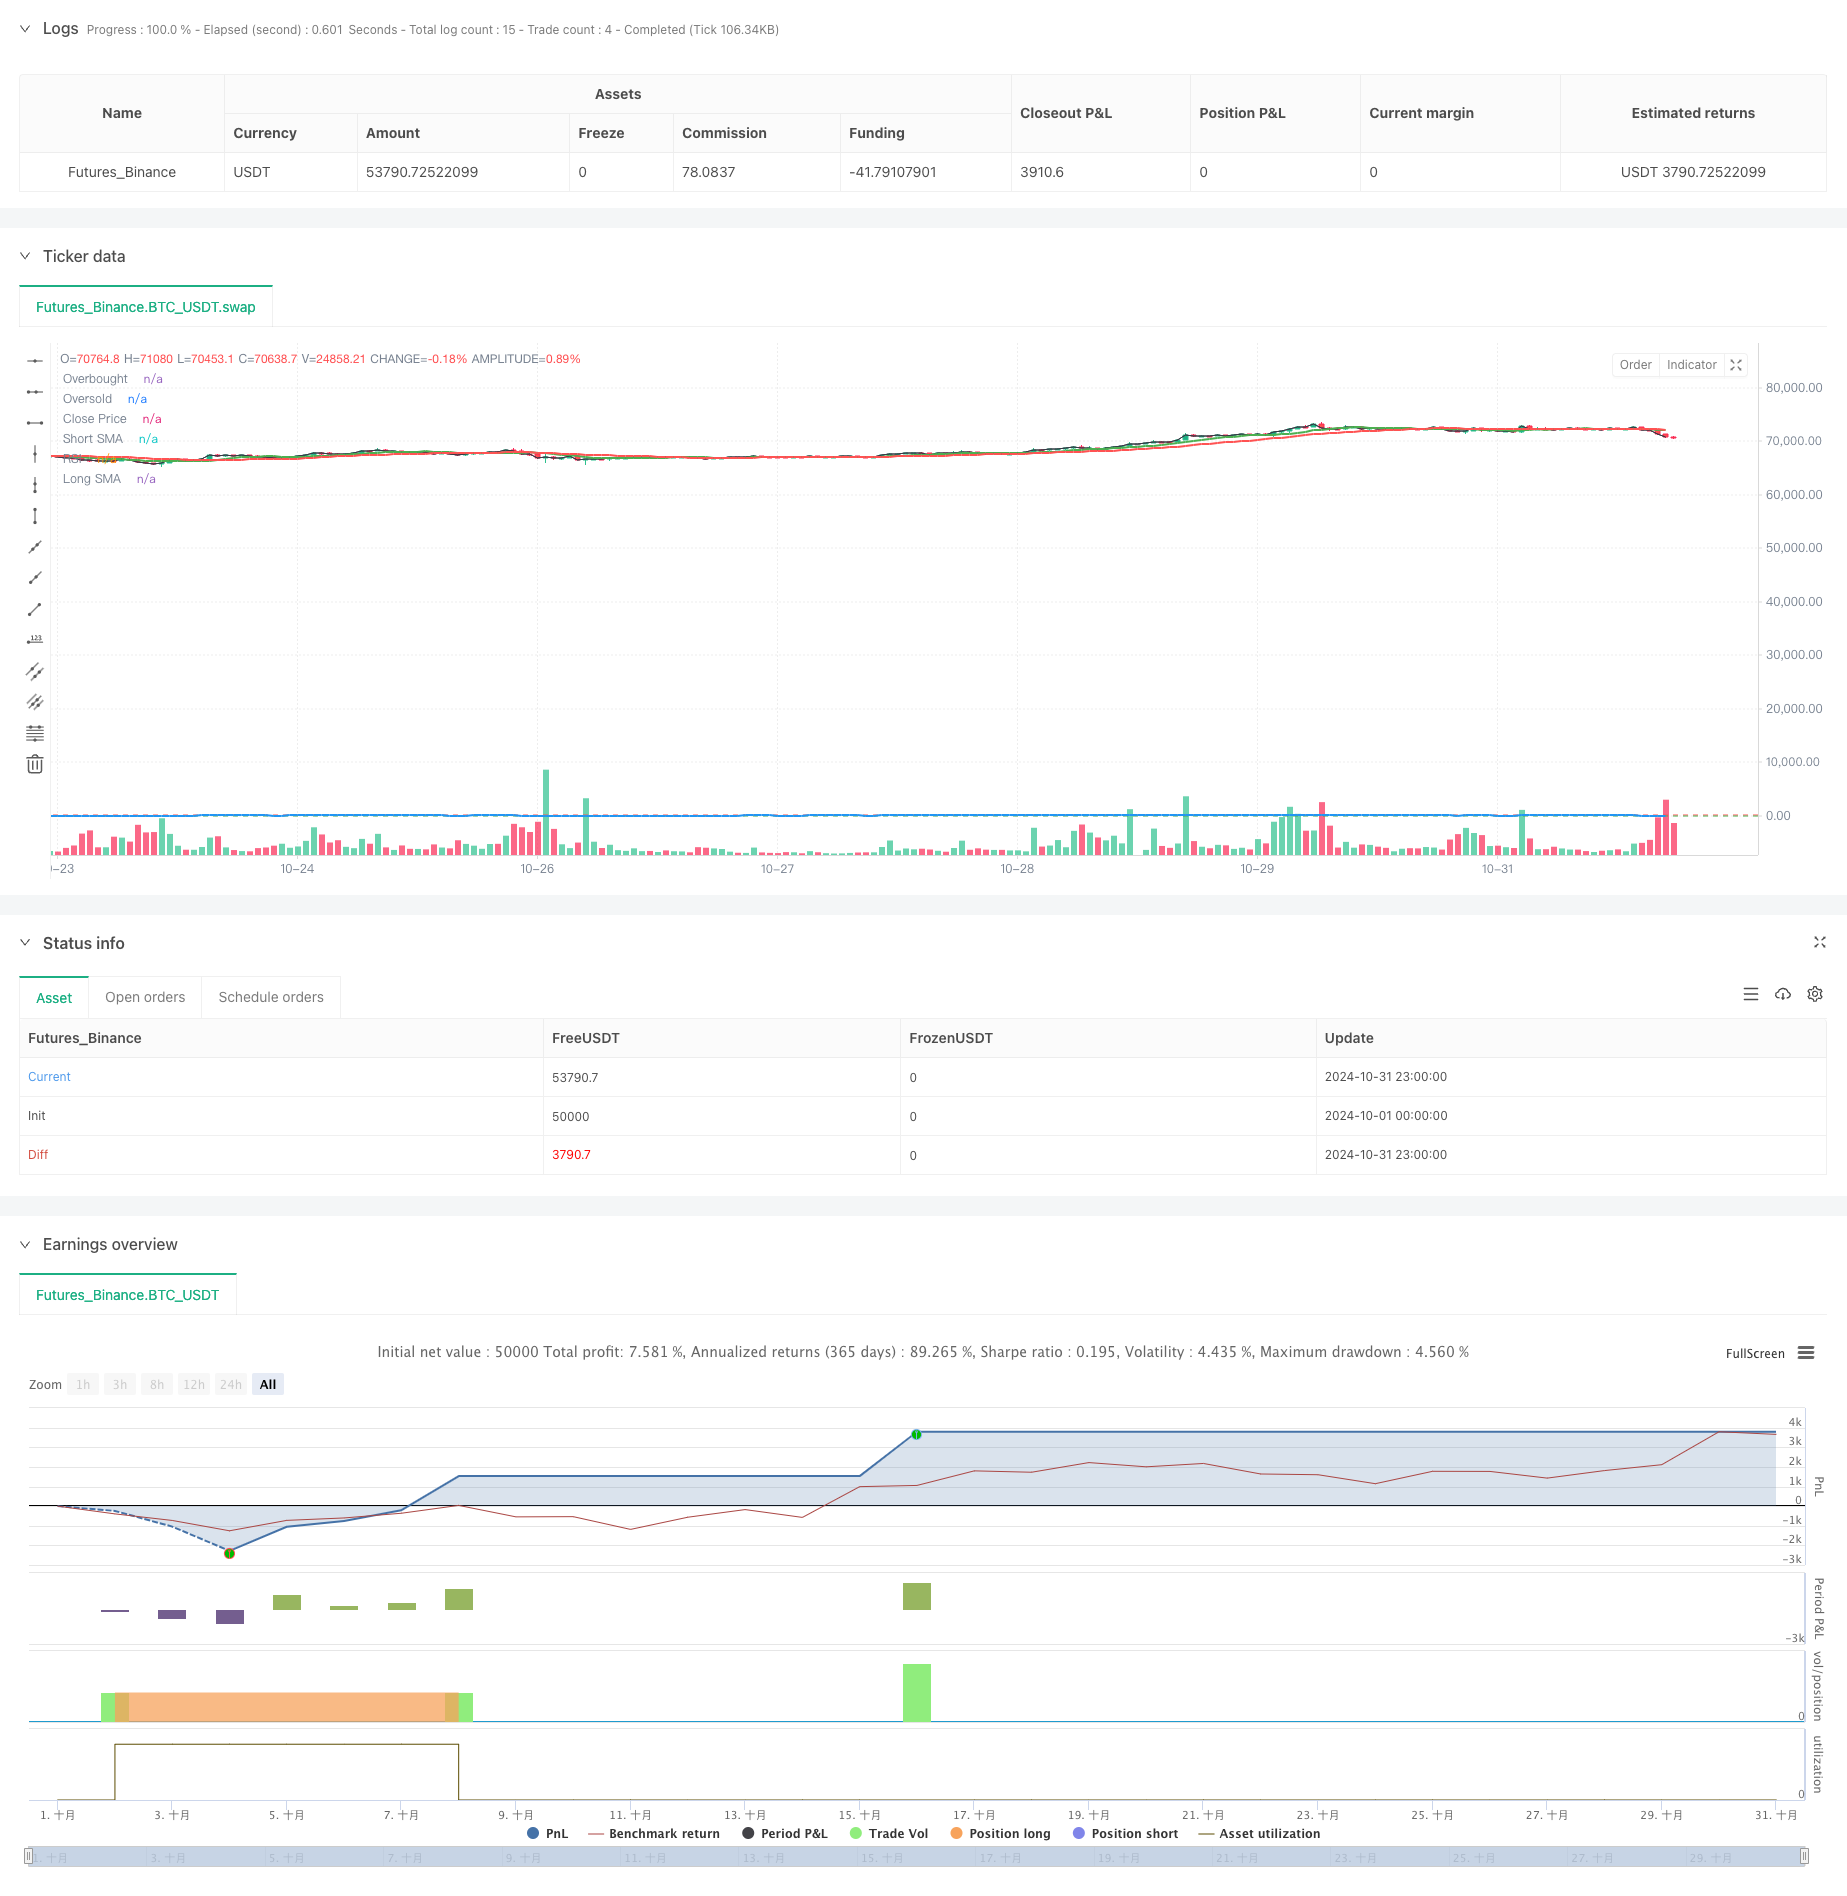
Gambaran keseluruhan
Ini adalah strategi perdagangan kuantitatif yang menggabungkan crossover dua garis rata, overbought dan oversold RSI, dan nisbah keuntungan risiko. Strategi ini menentukan arah trend pasaran melalui persilangan purata bergerak jangka pendek dan jangka panjang, sambil menggunakan indikator RSI untuk mengenal pasti kawasan overbought dan oversold, untuk penapisan isyarat perdagangan yang lebih tepat.
Prinsip Strategi
Strategi ini menggunakan dua purata bergerak pada 9 dan 21 sebagai asas untuk menilai trend, dan mengesahkan isyarat melalui kawasan overbought dan oversold RSI ((35⁄65)). Dalam keadaan masuk berbilang, rata-rata jangka pendek diperlukan di atas rata-rata jangka panjang dan RSI berada di kawasan overbought (<35); untuk masuk kosong, rata-rata jangka pendek diperlukan di bawah rata-rata jangka panjang dan RSI berada di kawasan overbought (<65); strategi ini menggunakan 1.5 kali nilai ATR untuk menetapkan jarak berhenti kerugian, dan berdasarkan 2:1 risiko keuntungan berbanding keuntungan yang dikira secara automatik.
Kelebihan Strategik
- Mekanisme pengesahan pelbagai isyarat meningkatkan kebolehpercayaan urus niaga
- Tetapan Henti Kerosakan Dinamik boleh disesuaikan mengikut turun naik pasaran
- Nisbah risiko dan ganjaran tetap membantu keuntungan yang stabil dalam jangka panjang
- Pembatasan jangka masa minimum berjaya mengelakkan perdagangan berlebihan
- Sistem penandaan visual untuk pemantauan dan analisis tindak balas
- Warna latar belakang berubah untuk menunjukkan kedudukan semasa
Risiko Strategik
- Sistem dua hala boleh menghasilkan isyarat palsu di pasaran yang bergolak
- RSI mungkin terlepas beberapa peluang perdagangan dalam trend yang kuat
- Nisbah ganjaran risiko tetap mungkin tidak fleksibel dalam keadaan pasaran tertentu
- Penangguhan ATR mungkin tidak tepat pada masanya apabila berlaku perubahan dinamik
- Tempoh pemegangan yang singkat boleh menyebabkan kehilangan peluang untuk menghentikan kerugian tepat pada masanya
Arah pengoptimuman strategi
- Memperkenalkan mekanisme pilihan kitaran linear yang menyesuaikan diri, menyesuaikan diri dengan keadaan pasaran yang dinamik
- Meningkatkan penapis kekuatan trend untuk meningkatkan kualiti isyarat
- Mengembangkan sistem imbangan risiko dan keuntungan yang dinamik untuk menyesuaikan diri dengan keadaan pasaran yang berbeza
- Integrasi penunjuk lalu lintas untuk meningkatkan kebolehpercayaan isyarat
- Menambah modul analisis turun naik pasaran, mengoptimumkan pilihan masa perdagangan
- Memperkenalkan algoritma pembelajaran mesin untuk mengoptimumkan pemilihan parameter
ringkaskan
Strategi ini membina sistem perdagangan yang agak lengkap melalui kerjasama kerjasama pelbagai petunjuk teknikal. Ia tidak hanya memberi perhatian kepada kualiti isyarat masuk, tetapi juga memberi perhatian kepada pengurusan risiko dan penetapan sasaran keuntungan. Walaupun terdapat beberapa tempat yang perlu dioptimumkan, reka bentuk kerangka keseluruhan adalah masuk akal, dengan nilai kegunaan yang baik dan ruang untuk pengembangan. Reka bentuk modular strategi juga menyediakan kemudahan untuk pengoptimuman seterusnya.
/*backtest
start: 2024-10-01 00:00:00
end: 2024-10-31 23:59:59
period: 1h
basePeriod: 1h
exchanges: [{"eid":"Futures_Binance","currency":"BTC_USDT"}]
*/

//@version=5
strategy("JakeJohn", overlay=true)

// Input parameters
smaShortLength = input(9, title="Short SMA Length")
smaLongLength = input(21, title="Long SMA Length")
lengthRSI = input(14, title="RSI Length")
rsiOverbought = input(65, title="RSI Overbought Level")
rsiOversold = input(35, title="RSI Oversold Level")
riskRewardRatio = input(2, title="Risk/Reward Ratio") // 2:1
atrMultiplier = input(1.5, title="ATR Multiplier") // Multiplier for ATR to set stop loss

// Calculate indicators
smaShort = ta.sma(close, smaShortLength)
smaLong = ta.sma(close, smaLongLength)
rsi = ta.rsi(close, lengthRSI)
atr = ta.atr(14)

// Entry conditions
longCondition = (smaShort > smaLong) and (rsi < rsiOversold) // Buy when short SMA is above long SMA and RSI is oversold
shortCondition = (smaShort < smaLong) and (rsi > rsiOverbought) // Sell when short SMA is below long SMA and RSI is overbought

// Variables for trade management
var float entryPrice = na
var float takeProfit = na
var int entryBarIndex = na

// Entry logic for long trades
if (longCondition and (strategy.position_size == 0))
    entryPrice := close
    takeProfit := entryPrice + (entryPrice - (entryPrice - (atr * atrMultiplier))) * riskRewardRatio
    strategy.entry("Buy", strategy.long)
    entryBarIndex := bar_index // Record the entry bar index
    label.new(bar_index, high, "BUY", style=label.style_label_up, color=color.green, textcolor=color.white, size=size.small)

// Entry logic for short trades
if (shortCondition and (strategy.position_size == 0))
    entryPrice := close
    takeProfit := entryPrice - (entryPrice - (entryPrice + (atr * atrMultiplier))) * riskRewardRatio
    strategy.entry("Sell", strategy.short)
    entryBarIndex := bar_index // Record the entry bar index
    label.new(bar_index, low, "SELL", style=label.style_label_down, color=color.red, textcolor=color.white, size=size.small)

// Manage trade duration and exit after a minimum of 3 hours
if (strategy.position_size != 0)
    // Check if the trade has been open for at least 3 hours (180 minutes)
    if (bar_index - entryBarIndex >= 180) // 3 hours in 1-minute bars
        if (strategy.position_size > 0)
            strategy.exit("Take Profit Long", from_entry="Buy", limit=takeProfit)
        else
            strategy.exit("Take Profit Short", from_entry="Sell", limit=takeProfit)

// Background colors for active trades
var color tradeColor = na
if (strategy.position_size > 0)
    tradeColor := color.new(color.green, 90) // Light green for long trades
else if (strategy.position_size < 0)
    tradeColor := color.new(color.red, 90) // Light red for short trades
else
    tradeColor := na // No color when no trade is active

bgcolor(tradeColor, title="Trade Background")

// Plotting position tools
if (strategy.position_size > 0)
    // Plot long position tool
    strategy.exit("TP Long", limit=takeProfit)

if (strategy.position_size < 0)
    // Plot short position tool
    strategy.exit("TP Short", limit=takeProfit)

// Plotting indicators
plot(smaShort, color=color.green, title="Short SMA", linewidth=2)
plot(smaLong, color=color.red, title="Long SMA", linewidth=2)

// Visual enhancements for RSI
hline(rsiOverbought, "Overbought", color=color.red)
hline(rsiOversold, "Oversold", color=color.green)
plot(rsi, color=color.blue, title="RSI", linewidth=2)

// Ensure there's at least one plot function
plot(close, color=color.black, title="Close Price", display=display.none) // Hidden plot for compliance