Стратегия обратного тренда Фибоначчи
Автор:Чао Чжан, Дата: 2024-04-28 14:05:45Тэги:ATRTSOTRMA
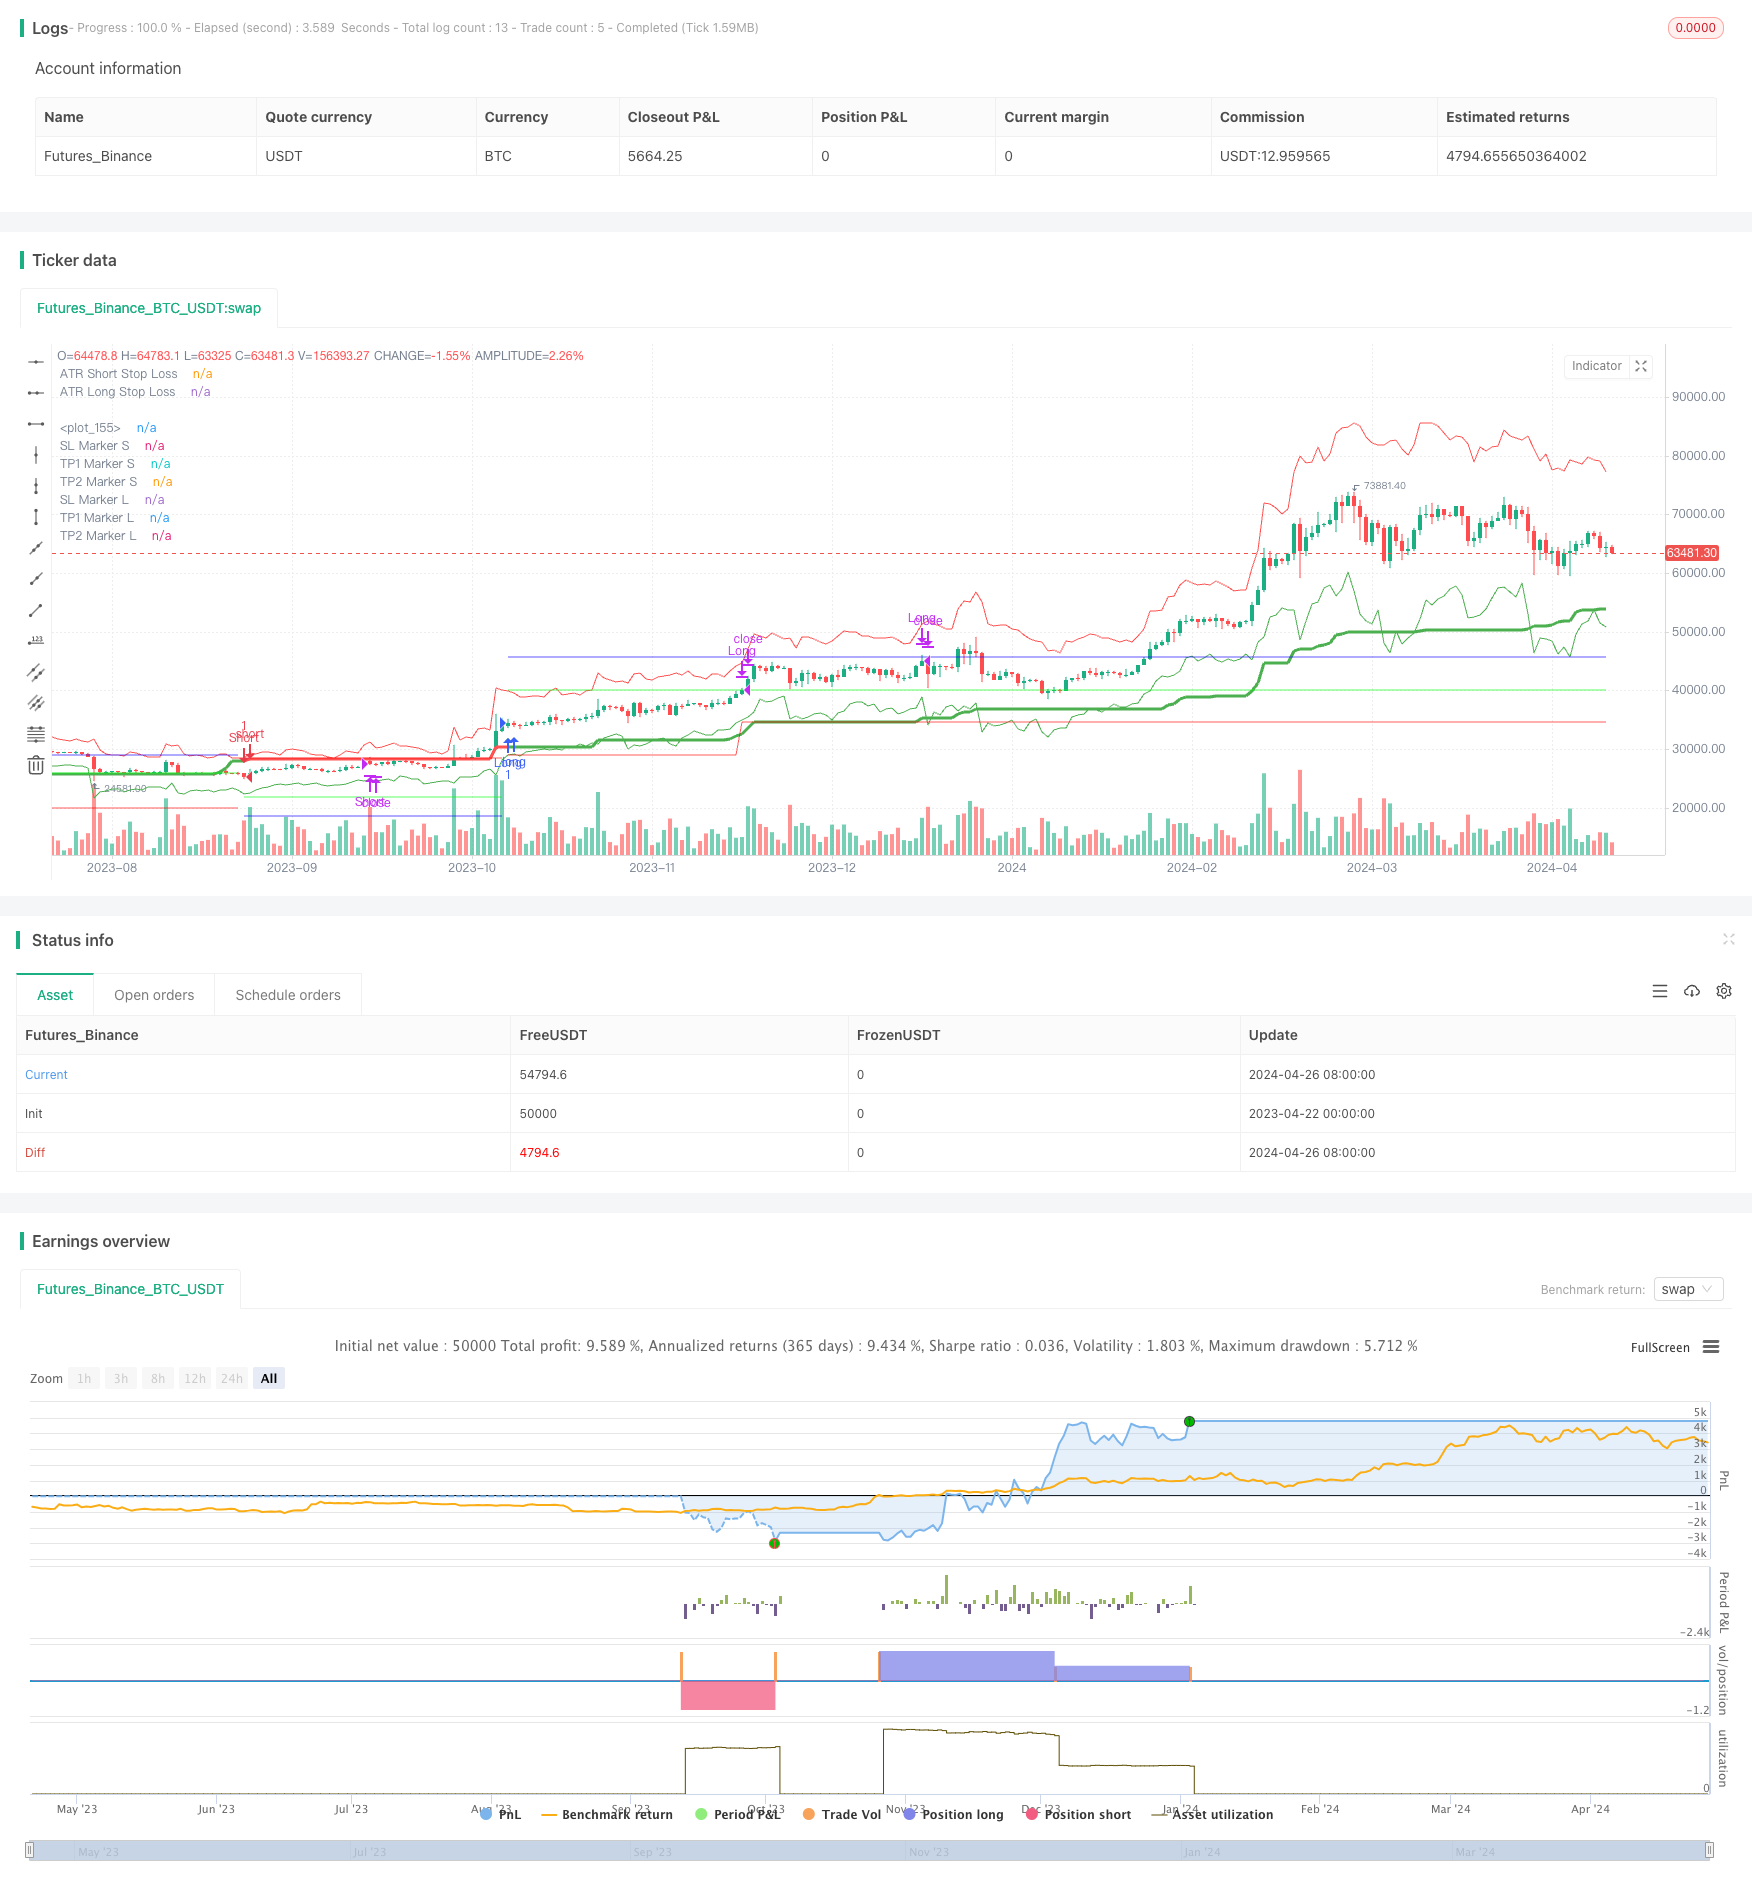
Обзор
Стратегия обратного тренда Фибоначчи (англ. Fibonacci Trend Reversal Strategy) - это торговая стратегия, которая использует уровни ретрасценции Фибоначчи и индикатор силы тренда с течением времени (TSOT) для обнаружения потенциальных точек обратного тренда на рынке.
Принципы стратегии
Стратегия использует уровни ретракции Фибоначчи (0,236, 0,5 и 0,786) для выявления потенциальных точек обратного движения тренда. Кроме того, индикатор TSOT измеряет силу тренда с использованием процентных рейтингов ценового действия. Когда цена превышает средний уровень Фибоначчи (0,5) с бычьим / медвежьим сигналом TSOT, стратегия входит в длинную / короткую позицию. Уровни стоп-лосса динамически рассчитываются с использованием ATR, в то время как уровни получения прибыли устанавливаются на основе частичного получения прибыли и соотношения риск-вознаграждение. Кроме того, стратегия позволяет изменение позиции на основе новых сигналов TSOT.
Преимущества стратегии
- Комбинируя ретрессинг Фибоначчи с индикатором силы тренда, стратегия может более точно идентифицировать точки переворота тренда.
- Динамическая система ATR с остановкой потери корректируется в соответствии с текущей волатильностью рынка, обеспечивая эффективное управление рисками.
- Настройки частичного получения прибыли позволяют своевременно получать прибыль, когда достигаются цели, позволяя прибыли продолжать работать.
- Возможность отмены позиций на основе новых сигналов повышает адаптивность и гибкость стратегии.
Стратегические риски
- На нестабильных рынках или в условиях неясного тренда частые сигналы об обратном движении могут привести к переоценке и потерям.
- Несмотря на то, что динамические режимы стоп-лосса и частичная прибыль помогают контролировать риск, в экстремальных рыночных условиях все еще могут произойти значительные снижения.
- Выбор параметров стратегии (например, уровни Фибоначчи, расчет TSOT) требует оптимизации для разных рынков и временных рамок; неправильные параметры могут повлиять на эффективность стратегии.
Направления оптимизации стратегии
- Включить дополнительные сигналы подтверждения (например, объем, индикаторы импульса) для фильтрации ложных сигналов и улучшения точности ввода.
- Оптимизировать логику получения прибыли и остановки потерь, например, динамически корректировать цели получения прибыли на основе силы тренда или внедрять отстающие остановки потерь.
- Для часто встречающихся сценариев отмены следует рассмотреть возможность установления ограничения количества отмены или введения условий фильтрации отмены, чтобы уменьшить чрезмерную торговлю.
- Проведение тщательной оптимизации и тестирования параметров стратегии, адаптированных к специфическим характеристикам рынка и торговым инструментам.
Резюме
Стратегия обратного тренда Фибоначчи эффективно отслеживает точки обратного тренда путем сочетания уровней ретрасценции Фибоначчи с индикатором TSOT, управляя при этом рисками и целями прибыли с помощью динамического стоп-лосса и частичного теке-прибыли.
/*backtest
start: 2023-04-22 00:00:00
end: 2024-04-27 00:00:00
period: 1d
basePeriod: 1h
exchanges: [{"eid":"Futures_Binance","currency":"BTC_USDT"}]
*/

// This Pine Script™ code is subject to the terms of the Mozilla Public License 2.0 at https://mozilla.org/MPL/2.0/
// © nioboi

//@version=5
strategy("Fibonacci Trend Reversals", overlay=true, process_orders_on_close = true, commission_value = 0.055, initial_capital = 1000)

// =========================================
// Input Groups
// =========================================
string rsi_group = "RSI"
string main_group = "Fib Sensitivity"
string atr_sl_finder_group = "ATR SL Finder"
string trade_execution_group = "Strategy Execution"

// =========================================
// Fibonacci Retracement Trend Reversal
// =========================================
sensitivity_input = input.float(title = 'Sensitive', step = 0.1, defval = 18, group = main_group)
var bool is_long_trend_started = false
var bool is_short_trend_started = false
var bool is_trend_change = na
var bool is_long_trend = false
var bool is_short_trend = false
var bool can_long = false
var bool can_short = false

sensitivity = sensitivity_input
sensitivity *= 10

high_line = ta.highest(high, int(sensitivity))
low_line = ta.lowest(low, int(sensitivity))
channel_range = high_line - low_line
fib_236 = high_line - channel_range * (0.236)
fib_5 = high_line - channel_range * 0.5
fib_786 = high_line - channel_range * (0.786)
imba_trend_line = fib_5

// =========================================
// TSOT | Trend Strength Over Time
// =========================================

// Calculate 75th percentile of price for each length
percentile_13H = ta.percentile_nearest_rank(high, 13, 75)
percentile_21H = ta.percentile_nearest_rank(high, 21, 75)
percentile_34H = ta.percentile_nearest_rank(high, 34, 75)
percentile_55H = ta.percentile_nearest_rank(high, 55, 75)
percentile_89H = ta.percentile_nearest_rank(high, 89, 75)

// Calculate 25th percentile of  price for each length
percentile_13L =  ta.percentile_nearest_rank(low, 13, 25)
percentile_21L =  ta.percentile_nearest_rank(low, 21, 25)
percentile_34L =  ta.percentile_nearest_rank(low, 34, 25)
percentile_55L = ta.percentile_nearest_rank(low, 55, 25)
percentile_89L = ta.percentile_nearest_rank(low, 89, 25)

// Calculate 75th and 25th for length 144 (longest length)
highest_high = ta.percentile_nearest_rank(high, 144, 75)
lowest_low = ta.percentile_nearest_rank(low, 144, 25)

// Calculate trend strength conditions
trendBull1 = percentile_13H > highest_high
trendBull2 = percentile_21H > highest_high
trendBull3 = percentile_34H > highest_high
trendBull4 = percentile_55H > highest_high
trendBull5 = percentile_89H > highest_high
trendBull6 = percentile_13L > highest_high
trendBull7 = percentile_21L > highest_high
trendBull8 = percentile_34L > highest_high
trendBull9 = percentile_55L > highest_high
trendBull10 = percentile_89L > highest_high

trendBear1 = percentile_13H < lowest_low
trendBear2 = percentile_21H < lowest_low
trendBear3 = percentile_34H < lowest_low
trendBear4 = percentile_55H < lowest_low
trendBear5 = percentile_89H < lowest_low
trendBear6 = percentile_13L < lowest_low
trendBear7 = percentile_21L < lowest_low
trendBear8 = percentile_34L < lowest_low
trendBear9 = percentile_55L < lowest_low
trendBear10 = percentile_89L < lowest_low

countBull =
     (trendBull1 ? 1 : 0) +
     (trendBull2 ? 1 : 0) +
     (trendBull3 ? 1 : 0) +
     (trendBull4 ? 1 : 0) +
     (trendBull5 ? 1 : 0) +
     (trendBull6 ? 1 : 0) +
     (trendBull7 ? 1 : 0) +
     (trendBull8 ? 1 : 0) +
     (trendBull9 ? 1 : 0) +
     (trendBull10 ? 1 : 0)

countBear =
     (trendBear1 ? 1 : 0) +
     (trendBear2 ? 1 : 0) +
     (trendBear3 ? 1 : 0) +
     (trendBear4 ? 1 : 0) +
     (trendBear5 ? 1 : 0) +
     (trendBear6 ? 1 : 0) +
     (trendBear7 ? 1 : 0) +
     (trendBear8 ? 1 : 0) +
     (trendBear9 ? 1 : 0) +
     (trendBear10 ? 1 : 0)

// Calculate weak bull count
weakBullCount =
     (percentile_13L < highest_high and percentile_13L > lowest_low ? 1 : 0) +
     (percentile_21L < highest_high and percentile_21L > lowest_low ? 1 : 0) +
     (percentile_34L < highest_high and percentile_34L > lowest_low ? 1 : 0) +
     (percentile_55L < highest_high and percentile_55L > lowest_low ? 1 : 0) +
     (percentile_89L < highest_high and percentile_89L > lowest_low ? 1 : 0)

// Calculate weak bear count
weakBearCount =
     (percentile_13H > lowest_low and percentile_13H < highest_high ? 1 : 0) +
     (percentile_21H > lowest_low and percentile_21H < highest_high ? 1 : 0) +
     (percentile_34H > lowest_low and percentile_34H < highest_high ? 1 : 0) +
     (percentile_55H > lowest_low and percentile_55H < highest_high ? 1 : 0) +
     (percentile_89H > lowest_low and percentile_89H < highest_high ? 1 : 0)

// Calculate bull strength and bear strength
bullStrength = 10 * (countBull + 0.5*weakBullCount - 0.5*weakBearCount - countBear)
bearStrength = 10 * (countBear + 0.5*weakBearCount - 0.5*weakBullCount - countBull)

// Calculate the current trend
currentTrendValue = bullStrength - bearStrength

tsot_bullish = currentTrendValue > 0
tsot_bearish = currentTrendValue < 0

// CAN LONG/SHORT
can_long := close >= imba_trend_line and close >= fib_236 and not is_long_trend and tsot_bullish
can_short := close <= imba_trend_line and close <= fib_786 and not is_short_trend and tsot_bearish

if can_long
    is_long_trend := true
    is_short_trend := false
    is_long_trend_started := is_long_trend_started ? false : true
else if can_short
    is_short_trend := true
    is_long_trend := false
    is_short_trend_started := is_short_trend_started ? false : true
else
    is_trend_change := false
    can_long := false
    can_short := false
    is_short_trend_started := false
    is_long_trend_started := false

is_trend_change := is_short_trend_started or is_long_trend_started
plotshape(is_long_trend and is_long_trend_started ? imba_trend_line : na, title="Long", style=shape.triangleup, location=location.belowbar, color=color.green, size=size.small)
plotshape(is_short_trend and is_short_trend_started ? imba_trend_line : na, title="Short", style=shape.triangledown, location=location.abovebar, color=color.red, size=size.small)
plot(imba_trend_line, color = is_long_trend[1] ? color.green : color.red, linewidth = 3)

// =========================================
// ATR SL Finder
// =========================================
atrlength = input.int(title='Length', defval=14, minval=1, group = atr_sl_finder_group)
smoothing = input.string(title='Smoothing', defval='RMA', options=['RMA', 'SMA', 'EMA', 'WMA'], group = atr_sl_finder_group)
m = input(3.5, 'Multiplier', group = atr_sl_finder_group)
src1 = high
src2 = low
ma_function(source, length) =>
    if smoothing == 'RMA'
        ta.rma(source, length)
    else
        if smoothing == 'SMA'
            ta.sma(source, length)
        else
            if smoothing == 'EMA'
                ta.ema(source, length)
            else
                ta.wma(source, length)

x = ma_function(ta.tr(true), atrlength) * m + src1 // SHORT SL
x2 = src2 - ma_function(ta.tr(true), atrlength) * m // LONG SL

p1 = plot(x, title="ATR Short Stop Loss", color=color.red)
p2 = plot(x2, title="ATR Long Stop Loss", color=color.green)

// =========================================
// Strategy Execution
// =========================================

tradeDirection = input.string("Both", "Trade Direction", ["Long Only", "Short Only", "Both"], group = trade_execution_group, tooltip = "Select if you want this strategy to run only Long or Only Short positions, or Both")

risk_reward_ratio = input.float(2, "Risk Reward Ratio", group = trade_execution_group)
partialTp = input.bool(true, "Use Partial Take Profit", tooltip = "Enable this if you want to exit 50% of your position when half point of your Risk Reward is reached.", group = trade_execution_group)
allowReversePosition = input.bool(true, "Allow Reversing of Position", tooltip = "Enable this if you want to reverse position when new opposite signal occurs", group = trade_execution_group)

// Long or Short Conditions
enterLong = can_long and (tradeDirection == "Long Only" or tradeDirection == "Both")
enterShort = can_short and (tradeDirection == "Short Only" or tradeDirection == "Both")

// Long Entry Variables
var bool plotMarkers_long = false
var bool firstTPHit_long = false
var float sl_long = na
var float breakEven_long = na
var float tp1_long = na
var float tp2_long = na
var float entryPrice_long = na
var bool inLongPosition = false

// Short Entry Variables
var bool plotMarkers_short = false
var bool firstTPHit_short = false
var float sl_short = na
var float breakEven_short = na
var float tp1_short = na
var float tp2_short = na
var float entryPrice_short = na
var bool inShortPosition = false


// Reversal Logic
if inLongPosition and can_short and allowReversePosition // in a long position and signal to enter short and havent yet hit first tp
    strategy.close("Long", "Reversing Long to Short") // close Long in preparation to enter short in the next few lines
    inLongPosition := false
else if inShortPosition and can_long and allowReversePosition // in a short position and signal to enter long and havent yet hit first tp
    strategy.close("Short", "Reversing Short to Long") // close Short in preparation to enter long in the next few lines
    inShortPosition := false

// Long Entries
if enterLong
    entryPrice_long := close
    sl_long := x2
    risk = entryPrice_long - sl_long
    tp1_long := entryPrice_long + ((risk_reward_ratio * risk) / 2)
    tp2_long := entryPrice_long + (risk_reward_ratio * risk)
    breakEven_long := entryPrice_long + (entryPrice_long * 0.002)
    strategy.entry("Long", strategy.long)
    if not partialTp
        strategy.exit("Exit Long", "Long", limit = tp2_long, stop = sl_long)
    firstTPHit_long := false
    inLongPosition := true

// Short Entries
if enterShort
    entryPrice_short := close
    sl_short := x
    risk = sl_short - entryPrice_short
    tp1_short := entryPrice_short - ((risk_reward_ratio * risk)/2)
    tp2_short := entryPrice_short - (risk_reward_ratio * risk)
    breakEven_short := entryPrice_short - (entryPrice_short * 0.002)
    strategy.entry("Short", strategy.short)
    if not partialTp
        strategy.exit("Exit Short", "Short", limit = tp2_short, stop = sl_short)
    firstTPHit_short := false
    inShortPosition := true

// Dynamic TP and exit strategy for Longs
if inLongPosition and partialTp // in long position and partial TP for exit strategy is enabled
    if high >= tp1_long and not firstTPHit_long // high of candle hit first TP of long, and not yet hit first TP before
        strategy.close("Long", "TP-1 Long", qty_percent = 50) // close 50% of our long position
        sl_long := breakEven_long
        firstTPHit_long := true // set the first TP checker flag to true
    else if high >= tp2_long and firstTPHit_long // already hit the first TP and we hit our 2nd tp
        strategy.close("Long", "TP-2 long") // close the remaining of the long position
        inLongPosition := false // not in long position anymore
    else if low <= sl_long and not firstTPHit_long // not yet hit first TP but hit our SL
        strategy.close("Long", "SL long") // close the entire long position
        inLongPosition := false // not in long position anymore
    else if low <= breakEven_long and firstTPHit_long // already hit first TP and retraced back to breakEven
        strategy.close("Long", "BE Long")
        inLongPosition := false // not in long position anymore

// Dynamic TP and exit strategy for Shorts
if inShortPosition and partialTp // in short position and partial TP for exit strategy is enabled
    if low <= tp1_short and not firstTPHit_short // low of candle hit first TP of short, and not yet hit first TP before
        strategy.close("Short", "TP-1 Short", qty_percent = 50) // close 50% of our short position
        firstTPHit_short := true // set the first TP checker flag to true
        sl_short := breakEven_short
    else if low <= tp2_short and firstTPHit_short // already hit the first TP and we hit our 2nd tp
        strategy.close("Short", "TP-2 Short") // close the remaining of the short position
        inShortPosition := false // not in short position anymore
    else if high >= sl_short and not firstTPHit_short // not yet hit first TP but hit our SL
        strategy.close("Short", "SL Short") // close the entire long position
        inShortPosition := false // not in long position anymore
    else if high >= breakEven_short and firstTPHit_short // already hit first TP and retraced back to breakEven
        strategy.close("Short", "BE Short")
        inShortPosition := false // not in long position anymore

// =========================================
// Entry Visuals
// =========================================

// Entry Visual Flags
if inLongPosition
    plotMarkers_long := true
    plotMarkers_short := false
else if inShortPosition
    plotMarkers_long := false
    plotMarkers_short := true

showEntryVisuals = input.bool(true, "Show Entry Visuals", group = trade_execution_group)
plot(plotMarkers_long and showEntryVisuals?sl_long:na, "SL Marker L", color = #ff0000a4, linewidth = 1, style = plot.style_linebr)
plot(plotMarkers_long and showEntryVisuals?tp1_long:na, "TP1 Marker L", color = #00ff08a8, linewidth = 1, style = plot.style_linebr)
plot(plotMarkers_long and showEntryVisuals?tp2_long:na, "TP2 Marker L", color = #1100ffa9, linewidth = 1, style = plot.style_linebr)
plot(plotMarkers_short and showEntryVisuals?sl_short:na, "SL Marker S", color = #ff0000a4, linewidth = 1, style = plot.style_linebr)
plot(plotMarkers_short and showEntryVisuals?tp1_short:na, "TP1 Marker S", color = #00ff08a8, linewidth = 1, style = plot.style_linebr)
plot(plotMarkers_short and showEntryVisuals?tp2_short:na, "TP2 Marker S", color = #1100ffa9, linewidth = 1, style = plot.style_linebr)
- Гибридный SSL
- Супер скальпер
- ESSMA
- SuperJump Turn Back Болинджерская полоса
- Супер скальпер - 5 минут 15 минут
- VAWSI и стратегия отмены стойкости тренда с системой анализа многопоказателей с динамическим расчетом длины
- Стратегия поддержки и сопротивления с динамической системой управления рисками
- Многопериодная динамическая стратегия торговли SuperTrend
- Прогрессия Фибоначчи с перерывами
- Милемашина
- Комбинированная долгосрочная стратегия торговли MACD и RSI
- Стратегия торговли DCA с двойной скользящей средней
- Торговая стратегия VWAP
- Стратегия комбинирования нескольких индикаторов (CCI, DMI, MACD, ADX)
- Стратегия RSI2 Внутренний реверсивный выигрыш
- Hurst Будущие линии стратегии демаркации
- Тенденция после стратегии, основанной на перекрестных сигналах OBV и MA
- Подтверждена стратегия GBS TOP Bottom
- Многопоказательная тенденция в соответствии со стратегией
- Преобразователь сжатия обратного теста v2.0
- Стратегия зигзагового пути HTF
- Стратегия WaveTrend Cross LazyBear
- Гибридная краткосрочная стратегия CCI, DMI и MACD
- Стратегия торговли AlphaTradingBot
- Улучшенная стратегия Vegas SuperTrend
- Количественная стратегия торговли, основанная на измененной скользящей средней и Ichimoku Kinko Hyo
- Стратегия отмены тренда по РСИ
- Стохастический кроссоверный индикатор импульсная стратегия торговли
- Количественная стратегия перекрестного сигнала RSI и двойной EMA
- Теория волн Эллиота 4-9 Импульсная волна Автоматическое обнаружение Стратегия торговли